U.S. Department of Transportation
Federal Highway Administration
1200 New Jersey Avenue, SE
Washington, DC 20590
202-366-4000


Skip to content
Facebook iconYouTube iconTwitter iconFlickr iconLinkedInInstagram

Federal Highway Administration Research and Technology
Coordinating, Developing, and Delivering Highway Transportation Innovations

 
REPORT
This report is an archived publication and may contain dated technical, contact, and link information
Back to Publication List        
Publication Number:  FHWA-HRT-14-039    Date:  May 2014
Publication Number: FHWA-HRT-14-039
Date: May 2014


An FHWA Special Study: Post-Tensioning Tendon Grout Chloride Thresholds

CHAPTER 4. TEST RESULTS AND DISCUSSION

This chapter presents electrochemical data that were collected weekly, other laboratory test results, autopsy results, and discussion with the outcomes of the indepth data analyses. The first set of test results is presented with experimental data versus time plots to show data changes as a function of time. In each plot shown in figure 88 through figure 90, figure 108 through figure 115, figure 120 through figure 127, figure 144 through figure 151, figure 154, figure 155, and figure 164 through figure 171, the duration of individual H & H and F & D cycles is highlighted with red and blue columns, respectively. White columns indicate either initial ambient or ambient cycles. The second set of test results shown in figure 100 through figure 107 is related to individual mean values of experimental datasets collected over time to show major trends associated with admixed chloride concentration, stress level, existence of void, and/or exposure conditions (i.e., initial ambient, ambient, H & H, and F & D). The first three datasets collected during the first ambient cycle were treated separately as the initial ambient cycle because they indicated more active electrochemical behavior than those collected in the other ambient cycles at later times. It is thought that most strands experienced active corrosion during the initial ambient exposure as they were first in contact with fresh grout and then started to corrode. The initial corrosion process continued until the formation of protective oxide layers (passive film) on the strands was completed. Once the stable passivity was established, the strands maintained a low corrosion state as discussed in figure 7. The third set of test results shows photographs that were taken throughout the study. Lastly, corrosion damage of the autopsied specimens is documented with pit depth measurements, photographs, and condition mapping sheets.

From all of the results, a comparative analysis of the collected non-destructive data and the observed physical corrosion damage data was performed to determine chloride threshold values for PT tendons in chloride-contaminated grout.

TASK 2.1: ELECTROCHEMICAL TESTING OF SINGLE-WIRE SPECIMENS IN AQUEOUS TEST SOLUTIONS

Preliminary tests were conducted to become familiar with experimental setup and select the initial conditioning parameters for king wires prior to performing actual electrochemical testing. These parameters were maintained throughout the task 2.1 experiment. Physical aspects of the experiment setup such as installing test cells and applying target stress in the wires were finalized after several trials. The immersion time in the test solutions and solution agitation were two main issues. After reviewing the preliminary test results, initial conditioning of 24-h immersion time without agitating solution was selected for actual specimens. Figure 79 and figure 80 present corrosion potential data and corrosion rate data of king wires, respectively.
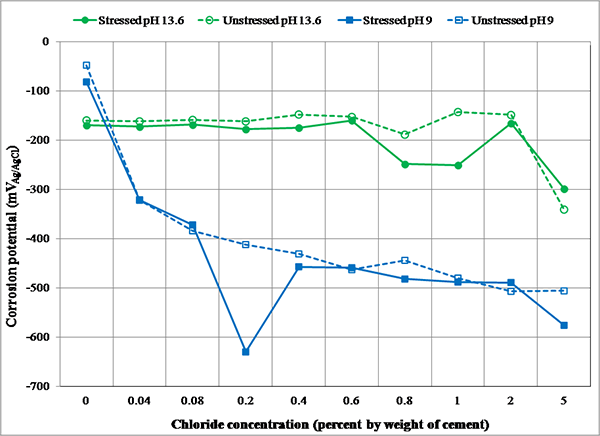
Figure 79. Graph. Corrosion potentials of center wires in different test environments. This graph shows corrosion potential versus chloride concentration data of center wires in different test environments. Corrosion potential is on the y-axis from -700 to 0 mV, and chloride concentration is on the x-axis from 0 to 5 percent by weight of cement. Four lines are shown on the graph: stressed wires in pH 13.6 solution, unstressed wires in pH 13.6 solution, stressed wires in pH 9 solution, and unstressed wires in pH 9 solution. The wires immersed in the pH 13.6 solutions exhibited relatively positive corrosion potentials indicating an inactive thermodynamic state for corrosion. In the pH 9.0 solutions, corrosion potentials became progressively more negative as chloride concentration increased.
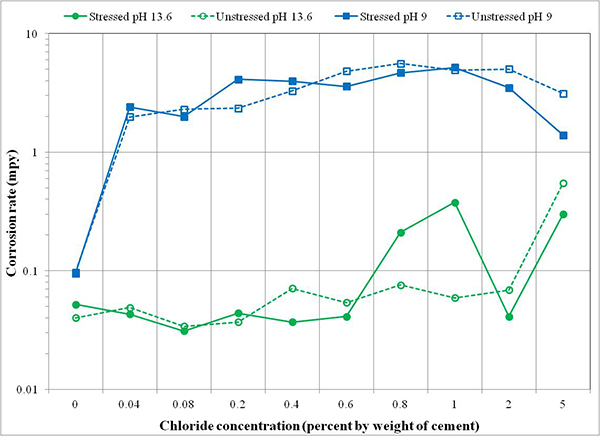
Figure 79 . Graph. Corrosion potentials of center wires in different test environments.

Figure 80. Graph. Corrosion rates of center wires in different test environments. This graph shows corrosion rate versus chloride concentration data of center wires in different test environments. Corrosion rate is on the y-axis from 0.01 to 10 mil/year, and chloride concentration is on the x-axis from 0 to 5 percent by weight of cement. Four lines are shown on the graph: stressed wires in pH 13.6 solution, unstressed wires in pH 13.6 solution, stressed wires in pH 9 solution, and unstressed wires in pH 9 solution. The wires immersed in the pH 13.6 solutions exhibited virtually zero corrosion rate up to an equivalent chloride concentration of 0.6 percent by weight of cement and then slightly increased at higher chloride concentrations. In the pH 9.0 solutions, corrosion rates went up sharply compared to those obtained in the chloride-free pH 9.0 solutions and all 13.6 pH solutions.
Figure 80. Graph. Corrosion rates of center wires in different test environments.

As expected, the wires immersed in the 13.6 pH solutions were protected by the passive film formed in the high pH environment. Their performance was characterized by relatively positive corrosion potentials, indicating an inactive thermodynamic state for corrosion and low corrosion rates indicating slow metal dissolution rate. In the high pH environment, the corrosion rate was virtually 0 mil/year up to an equivalent chloride concentration of 0.6 percent by weight of cement and then slightly increased at higher chloride concentrations. Corrosion products observed on the tested wires and in the solutions were also negligible. The effect of stress was not apparent in a low chloride concentration up to 0.6 percent, but the stressed wires exposed at 0.8 and 1.0 percent chloride concentration showed slightly higher corrosion rates than the unstressed counterparts in the same test conditions. However, conflicting data from corrosion behavior at 2.0 and 5.0 percent chloride concentrations indicated that there was no trend. Additional tests are suggested to yield statistically significant results in the future.

For the specimens tested in the pH 9.0 solutions containing an equivalent chloride concentration of 0.04 percent by weight of cement and higher concentrations, corrosion potentials became progressively more negative as chloride concentration increased. Conversely, the matching corrosion rates went up sharply compared to the electrochemical data obtained in the chloride-free 9.0 pH solutions and all 13.6 pH solutions. The corrosion products deposited on the tested wires and bottom of the test cells were much more visible and abundant compared to the high pH counterparts. Also, color of the solutions became darker by dissolved corrosion products as corrosion rate increased. The observed reduction of corrosion rate at 5.0 percent chloride concentration is thought to be caused by a lack of dissolved oxygen in the low pH solutions due to excessive chloride ions. Again, there was no consistency observed regarding the effect of stress on corrosion rate regardless of chloride concentration.

The observed passive behavior of king wires in the high pH solutions signifies the importance of maintaining a high pH environment to prevent corrosion of PT strands. Formation of sound passive film is only possible on PT strands completely surrounded by high-quality grout that offers the high pH environment. The protective film will eventually become compromised when chloride ions exceed threshold values. The electrochemical data in figure 79 and figure 80 suggest that PT strands can tolerate chloride contamination without significant corrosion up to 0.6 percent by weight of cement in carbonation-free (high pH) grout, whereas PT strands with as low as 0.04 percent chloride by weight of cement can initiate active corrosion in the carbonated (low pH) grout. This is below the AASHTO specified chloride limit of 0.08 percent by weight of cement. Any air getting through the grout voids and cracked duct/grout will likely expose PT strands to a lower pH environment through carbonation process. Once corrosion starts in the low pH environment, the level of corrosion damage will depend on chloride concentration.

ADMIXED VERSUS EXTRACTED CHLORIDE CONTENTS

Figure 81 shows chloride analysis results of the 10-day trial mixes. Mean background acid-soluble chloride content in the grout powder was determined to be 0.009 percent (90 ppm) by weight of sample. It was small enough to consider the acquired grout chloride-free. The 0.009 percent by weight of sample is equivalent to 0.017 percent by weight of cement. The conversion was made based on known cement weight of 33.33 lb per 50-lb grout bag and 12.5 lb of mixing water added per bag.
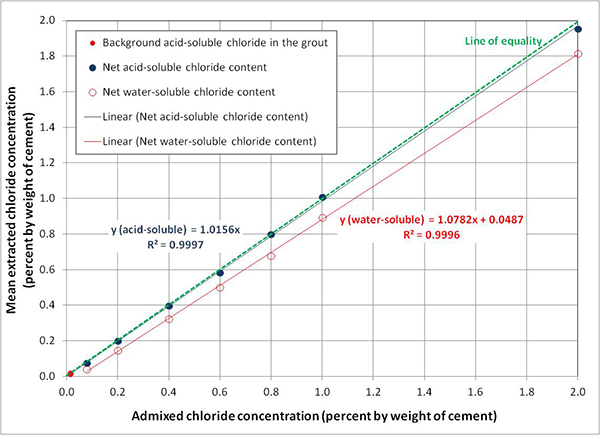
Figure 81. Graph. Relationship between admixed chloride contents and actual concentrations in the trial grout mixes extracted by ASTM water-soluble and AASHTO acid-soluble methods. This graph shows chloride analysis results of the 10-day trial mixes extracted by ASTM water-soluble and American Association of State Highway and Transportation Officials (AASHTO) acid-soluble methods. Mean extracted chloride concentration is on the y-axis from 0 to 2 percent by weight of cement, and admixed chloride concentration is on the x-axis from 0 to 2 percent by weight of cement. Two lines are shown on the graph: linear (net acid-soluble chloride content) and linear (net water-soluble chloride content). Three types of data are found on those two lines: background acid-soluble chloride in the grout (solid red circle), net acid-soluble chloride content (solid blue circle), and net water-soluble chloride content (hollow red circle). Mean background acid-soluble chloride content in the grout powder was determined to be 0.009 percent (90 ppm) by weight of sample. It was small enough to consider the acquired grout chloride-free. Mean extracted acid-soluble chloride concentrations were virtually identical to the admixed chloride concentrations in that a linear regression line runs nearly over the line of equality with almost perfect coefficient of determination (R-squared = 0.9997).
Figure 81. Graph. Relationship between admixed chloride contents and actual concentrations in the trial grout mixes extracted by ASTM water-soluble and AASHTO acid-soluble methods.(15,16)

As shown in figure 81, mean extracted acid-soluble chloride concentrations were virtually identical to the admixed chloride concentrations in that a linear regression line runs nearly over the line of equality with almost perfect coefficient of determination (R2 = 0.9997). This means that nearly all admixed sodium chloride contents were extracted through the acid-soluble titration method. It is also true that the calculated sodium chloride weights listed in table 2 were accurate. For water-soluble chloride data, the extracted amounts were somewhat less compared to the acid-soluble results, and the difference increased as chloride concentration increased. Nonetheless, the water-soluble data also yielded R2 = 0.9996. After confirming adequacy of the mix proportions, actual grout mixes were made to cast tasks 2.2 and 2.3 specimens.

Figure 82 shows acid-soluble chloride analysis results, expressed in three different units, of grout powder samples taken from single-strand specimens and multi-strand specimens after the accelerated corrosion testing was terminated. It can be seen that the extracted acid-soluble chloride contents were virtually the same between single-strand specimens and multi-strand specimens. This finding confirms that the admixed sodium chloride was uniformly dispersed in the fresh grout, and both types of specimens were tested in the identical chloride concentrations.
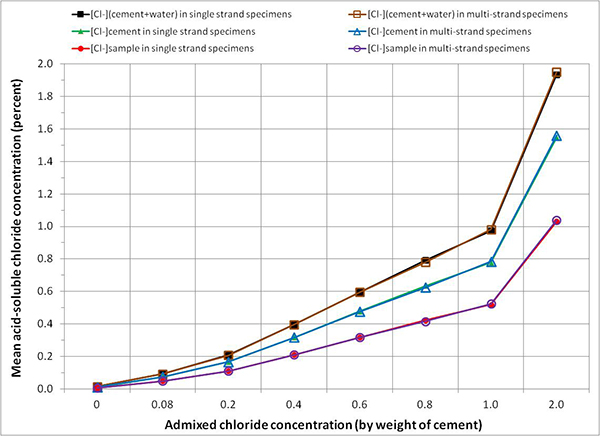
Figure 82. Graph. Mean acid-soluble chloride contents in grout powder samples calculated by three conversion methods. This graph shows mean acid-soluble chloride analysis results of grout powder samples taken from single-strand specimens and multi-strand specimens after the accelerated corrosion testing was terminated. Mean acid-soluble chloride concentration is on the y-axis from 0 to 2 percent, and admixed chloride concentration is on the x-axis from 0 to 2 percent by weight of cement. In the graph, two groups of acid-soluble chloride data are presented for single-strand specimens and multi-strand specimens, respectively. Within each group, experimentally determined chloride data are presented by three concentration conversion units that are distinguished by different symbols and trend lines. The observed perfect agreement between two groups of the chloride data indicates that the extracted acid-soluble chloride contents were virtually the same between single-strand specimens and multi-strand specimens at every admixed chloride concentration.
Figure 82. Graph. Mean acid-soluble chloride contents in grout powder samples calculated by three conversion methods.

It can be also seen in figure 82 that three different chloride concentration units yielded three different extracted concentrations for a given admixed chloride concentration (see table 8).

Table 8. Different chloride concentration units reported in this study.

Notation Description of Acid-Soluble (Total) Chloride Concentration Units
[Cl-](cement + water) Percent by weight of cement plus weight of mixing water
[Cl-]cement Percent by weight of cement excluding weight of mixing water
[Cl-]sample Percent by weight of grout powder sample

Mean extracted acid-soluble chloride concentrations expressed by [Cl-](cement + water) accounted for almost 100 percent of the admixed chloride concentrations. Those expressed by [Cl-]cement and by [Cl-]sample resulted in approximately 75 and 50 percent of the admixed chloride concentrations, respectively. The following example exemplifies the 1.0 percent admixed chloride concentration case to demonstrate why different concentration units yield different concentration values.

As listed in table 2, a six-bag grout mix containing 1.0 percent chloride by weight of cement requires 2.0 lb of chloride ions (60.6 percent of 3.3 lb sodium chloride) dissolved in 75 lb distilled water and six 50-lb grout bags. Theoretical acid-soluble chloride concentration in the hardened grout powder sample should be as follows:

Figure 83. Equation. Example of calculating acid-soluble chloride concentration in the hardened grout powder sample. Open bracket Cl superscript minus closed bracket subscript acid-soluble equals 2.0 pounds divided by open bracket 300 pounds plus 75 pounds plus 2.2 pounds closed parenthesis equals 0.005287 equals 0.5287 percent equals 5,287 ppm by weight of sample.
Figure 83. Equation. Example of calculating acid-soluble chloride concentration in the hardened grout powder sample.

Mean acid-soluble chloride concentration in the grout powder samples taken from 1.0 percent chloride multi-strand specimen was 0.5235 percent, or 5,235 ppm by weight of sample. This is close to the theoretical value and is also about 50 percent of the original chloride concentration by weight of cement.

There are two correction factors to convert the chloride concentration [Cl-]sample back to either [Cl-](cement + water) or [Cl-]cement. If weight of mixing water is considered, use a correction factor of 1.875 as follows (see figure 84):

Figure 84. Equation. Example of converting chloride concentration by weight of grout sample to chloride concentration by weight of cement plus weight of mixing water. Open bracket Cl superscript minus closed bracket subscript acid-soluble equals 0.5235 percent times 1 divided by 0.5333 equals 0.5235 percent times 1.875 equals 0.9816 percent by weight of cement plus water.
Figure 84. Equation. Example of converting chloride concentration by weight of grout sample to chloride concentration by weight of cement plus weight of mixing water.

This can be considered 100 percent of the original chloride concentration by weight of cement. If weight of mixing water is not considered, use a correction factor of 1.5 as follows (see figure 85):

Figure 85. Equation. Example of converting chloride concentration by weight of grout sample to chloride concentration by weight of cement without weight of mixing water. Open bracket Cl superscript minus closed bracket subscript acid-soluble equals 0.5235 percent times 1 divided by 0.6667 equals 0.5235 percent times 1.5 equals 
0.7853 percent by weight of cement without water.
Figure 85. Equation. Example of converting chloride concentration by weight of grout sample to chloride concentration by weight of cement without weight of mixing water.

This can be treated approximately 75 percent of the original chloride concentration by weight of cement.

Even though any of three chloride concentration units may be used interchangeably for hardened grout powder samples, each unit is suitable for different circumstances. Specifically, a chloride concentration expressed by [Cl-](cement + water) is the best if precise mix proportion including weight of mixing water is known like the present study. This is because it represents almost 100 percent of acid-soluble chloride concentration in the hardened grout. For the particular grout product used in this study, a correction factor of 1.875 should be used. If weight of cement is known and weight of mixing water is unknown, concentration expressed by [Cl-]cement can be used; however, it accounts for approximately 75 percent of acid-soluble chloride concentration in the hardened grout. In the same grout case, use a correction factor of 1.5. If none is known, concentration expressed by [Cl-]sample is the only choice. In practice, the last option may be the most frequently used and easy to use because no conversion is necessary. However, it is important to indicate that a chloride concentration expressed by this unit represents only 50 percent of true acid-soluble chloride concentration in the hardened grout.

To illustrate differences in these concentration units, figure 86 plots fractions of mean acid-soluble chloride data presented in figure 82 to their respective admixed chloride concentrations. Fractions of 0.08 and 0.2 percent data exceeded those of the higher chloride concentrations because background chloride concentration was significant for the two lowest chloride concentrations. For the other commercially available pre-bagged grout products, similar conversion relationships can be developed provided that exact weight of cement in a bag is known.
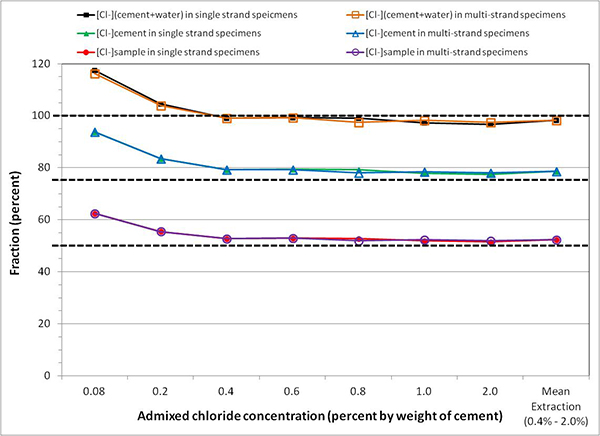
Figure 86. Graph. Mean chloride extraction rates based on three conversion methods. This graph shows mean chloride extraction rates based on three conversion methods. Fraction is on the y-axis from 0 to 120 percent, and admixed chloride concentration is on the x-axis from 0.08 to 2 percent by weight of cement In the graph, two groups of chloride extraction ratio data are presented for single-strand specimens and multi-strand specimens, respectively. Within each group, chloride extraction ratios of experimentally determined chloride concentrations expressed by three concentration conversion units were calculated with respect to the corresponding admixed chloride concentrations and the results are presented with different symbols and trend lines. A perfect agreement was observed between the two groups of the chloride extraction ratio data obtained from two types of specimens. The chloride concentrations expressed by weight of cement plus weight of mixing water approach 100 percent of their admixed chloride concentrations except for 0.08 and 0.2 percent concentrations. Similarly, those expressed by weight of cement and sample weight yield 75 and 50 percent of their admixed chloride concentrations, respectively. In all cases, the 0.08 and 0.2 percent data exceeded the observed 100, 75, and 50 percent extraction efficiencies.
Figure 86. Graph. Mean chloride extraction rates based on three conversion methods.

Figure 87 provides detailed chloride data analysis results of multi-strand specimens. It shows mean chloride data grouped by sampling location and depth. It can be seen in the figure that mean extracted chloride concentrations were identical within each sample group except for those at the grout/strand interface being slightly lower. The adherence of chloride ions to the steel surface might be responsible for the lower chloride concentration at the interface. The same trend is typical for reinforcing steel bar/concrete interface as well. From this dataset, the admixed chloride ions were confirmed to be evenly distributed in each grout mix, and no biased test results were originated from uneven chloride distribution. The single-strand specimens had the same level of even chloride distribution at each target concentration.
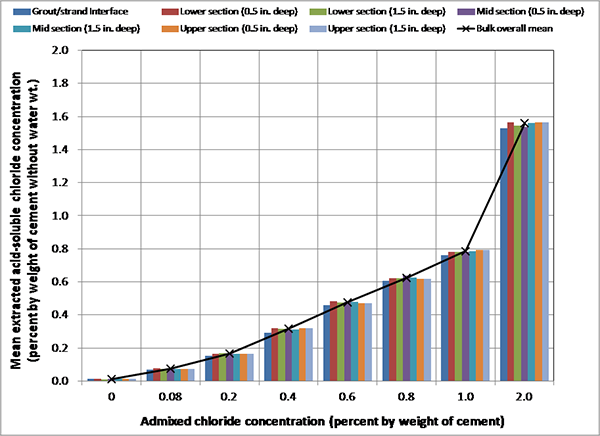
Figure 87. Graph. Mean extracted acid-soluble chloride concentrations at different locations of multi-strand specimens. This bar graph provides detailed chloride data analysis results of multi-strand specimens grouped by sampling location and sampling depth. Mean extracted acid-soluble chloride concentration is on the y-axis from 0 to 2 percent by weight of cement without water weight, and eight admixed chloride concentrations are on the x-axis: 0, 0.08, 0.2, 0.4, 0.6, 0.8, 1.0, and 2.0 percent by weight cement. The following eight bars are shown for the eight chloride concentrations: grout/strand interface, midsection (1.5 inches deep), lower section (0.5 inches deep), upper section (0.5 inches deep), lower section (1.5 inches deep), upper section (1.5 inches deep), midsection (0.5 inches deep), and bulk overall mean. Mean extracted chloride concentrations were identical within each sample group except for those at the grout/strand interface being slightly lower.
Figure 87. Graph. Mean extracted acid-soluble chloride concentrations at different locations of multi-strand specimens.

ENVIRONMENTAL DATA

Figure 88 shows temperature variations in the environmental chambers and interior of two multi-strand specimens during the accelerated corrosion testing.
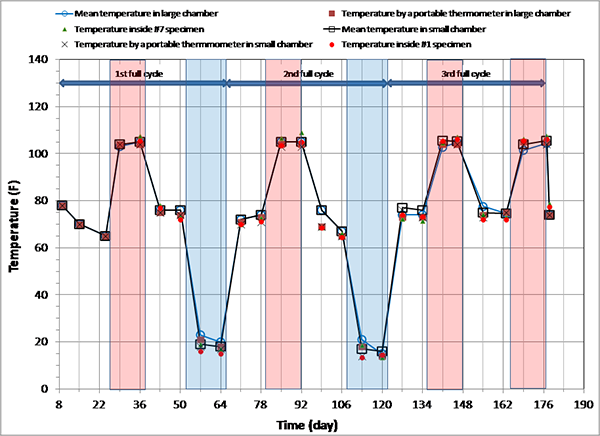
Figure 88. Graph. Sequence of exposure cycles and temperature changes during accelerated testing. This graph shows temperature variations in the environmental chambers and interior of two multi-strand specimens during the accelerated corrosion testing. Temperature is on the y-axis from 0 to 140 °F, and time is on the x-axis from 8 to 190 days. Individual hot and humid (H & H) and freezing and dry (F & D) cycles are highlighted with red and blue columns, respectively. White columns indicate either initial ambient or ambient cycles. Three blue horizontal arrows indicate the duration of a full exposure cycle. The plot contains two sets of temperature data collected from two environmental chambers. Each dataset includes temperature measured with a portable thermometer, specimen interior temperature measured with a thermocouple, and mean temperature measured with a permanent thermometer installed in the chamber. All of the collected temperature data matched well with the target temperatures during the H & H and F & D exposure conditions.
Figure 88. Graph. Sequence of exposure cycles and temperature changes during accelerated testing.

Figure 89 shows variations of mean RH readings in the environmental chambers. It can be seen that target temperatures were fairly well maintained, whereas target RHs were somewhat difficult to control. Overall, environmental loading was thought to be adequate enough to expedite the corrosion process fairly well.
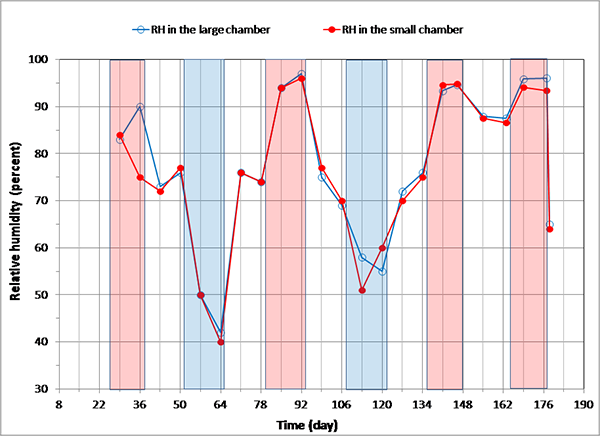
Figure 89. Graph. Recorded mean RH readings in the environmental chambers. This graph shows variations of mean relative humidity (RH) readings in the environmental chambers. Individual hot and humid and freezing and dry cycles are highlighted with red and blue columns, respectively. White columns indicate either initial ambient or ambient cycles. RH is on the y-axis from 30 to 100 percent, and time is on the x-axis from 8 to 190 days. Two lines are shown on the graph: RH in the large chamber (solid blue line) and RH in the small chamber (solid red line). Target temperatures were fairly well maintained, whereas target RHs were somewhat difficult to control. The recorded RH data indicate that both chambers are considered to maintain fairly accurate RH even though there were discrepancies at several data collection times.
Figure 89. Graph. Recorded mean RH readings in the environmental chambers.

POTENTIAL DATA

PSE Versus ACE

The portable ACE and CSE are the most widely used and commercially available reference electrodes. They have finite potential differences at any given temperature with respect to the standard hydrogen electrode, a specially constructed reference electrode for all other reference electrodes. The potential readings taken with one type of reference electrode can be converted to those measured with other types as inherent potential difference between the two reference electrodes is known.

The PSE used in this study was a custom-made project-specific reference electrode used to collect potential data for the strand specimens. For the purpose of potential conversion to ACE, corrosion potentials of PSEs embedded in the calibration blocks containing eight chloride concentrations were measured weekly. These calibration blocks were subjected to the same temperature/RH cycles as the strand specimens in the environmental chambers. Figure 90 shows exemplary corrosion potential data of three PSEs versus ACE. The other PSE potential data fell within the ranges exhibited by these PSEs. It can be seen that 0 percent chloride PSE tended to show more temperature sensitive behavior than the others, especially during the F & D cycles. Also, 1.0 percent PSE exhibited nearly -220 mV versus ACE at an early measurement. The reason for the negative potential reading could not be identified.
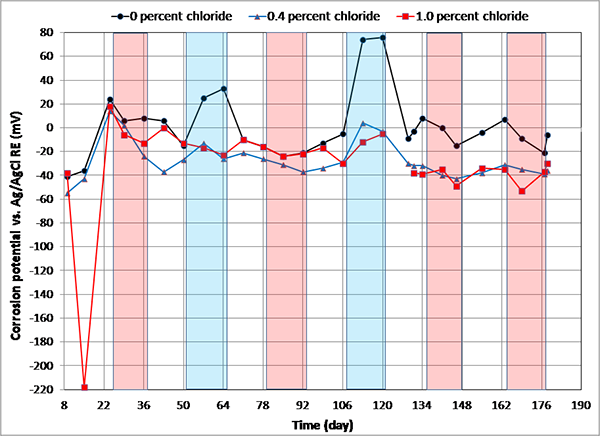
Figure 90. Graph. Corrosion potential versus time for three PSEs embedded in the calibration cylinders measured with respect to ACE. This graph shows corrosion potential versus time for three pseudo-reference electrodes (PSEs) embedded in the calibration cylinders measured with respect to silver-silver chloride reference electrode (ACE). Corrosion potential versus ACE is on the y-axis from -220 to 80 mV, and time is on the x-axis from 8 to 190 days. Three lines are shown on the graph: 0, 0.4, and 1.0 percent chloride. Individual hot and humid and freezing and dry (F & D) cycles are highlighted with red and blue columns, respectively. White columns indicate either initial ambient or ambient cycles. It can be seen that 0 percent chloride PSE tended to show more temperature sensitive behavior than the others, especially during the F & D cycles. Also, 1.0 percent PSE exhibited nearly -220 mV versus ACE at an early measurement.
Figure 90. Graph. Corrosion potential versus time for three PSEs embedded in the calibration cylinders measured with respect to ACE.

Figure 91 shows PSE mean corrosion potentials for each chloride concentration calculated from individual corrosion potential data for 6 months in ambient, H & H, and F & D cycles. All exhibited relatively positive corrosion potentials during the F & D cycles. Since PSE potential can be influenced by many factors, it would be difficult to come up with an accurate, universal conversion factor. For the sake of simplifying the data analysis, a mean value of -30 mV versus ACE was chosen for this study as a single conversion factor regardless of chloride concentration and exposure condition. The number was selected based on a dominant trend observed during ambient and H & H cycles in figure 91. Since the potential data collected in ambient and H & H cycles account for majority of the potential data and corrosion activity observed in F & D was insignificant, use of the conversion factor should be considered reasonable. The converted potential values were used to compare them to the existing corrosion potential criteria given in ASTM C876.(18) With the -30 mV conversion factor, -100 mV versus PSE is equivalent to -130 mV versus ACE or -230 mV versus CSE. Conversely, -350 mV (90 percent probability of corrosion per ASTM C876) and -200 mV (90 percent probability of no corrosion per ASTM C876) versus CSE are equivalent to -220 and -70 mV versus PSE, respectively.
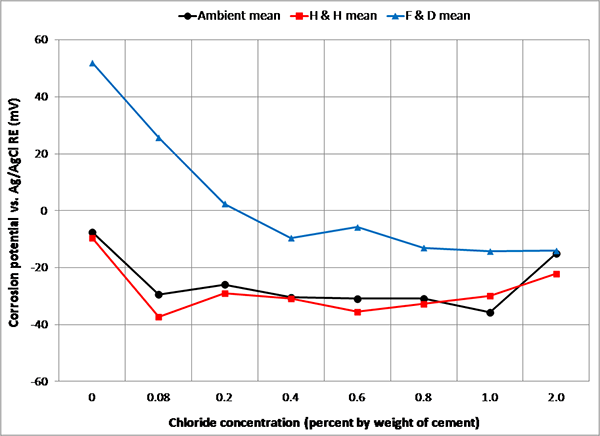
Figure 91. Graph. Mean corrosion potentials of PSEs versus ACE in three exposure conditions. This graph shows mean corrosion potentials of pseudo-reference electrodes (PSEs) versus silver-silver chloride reference electrode (ACE) calculated from individual corrosion potential data for 6 months in ambient, hot and humid (H & H), and freezing and dry (F & D) cycles. Corrosion potential versus ACE is on the y-axis from -6.0 to 6.0 mV, and chloride concentration is on the x-axis from 0 to 2.0 percent by weight of cement. Three lines are shown: ambient mean, H & H mean, and F & D mean. The mean potential data exhibited relatively positive corrosion potentials during the F & D cycles, especially at 0, 0.08, and 0.2 percent chloride concentrations. The other mean corrosion potential datasets obtained in ambient and H & H cycles varied slightly around -30 mV except for 0 percent chloride concentration.
Figure 91. Graph. Mean corrosion potentials of PSEs versus ACE in three exposure conditions.

TASK 2.2: CORROSION POTENTIAL OF SINGLE-STRAND SPECIMENS

Figure 92 through figure 99 present corrosion potentials versus time plots for single-strand specimens. The first measurements after receiving water and/or air holes are indicated in the relevant plots. Most specimens in the environmental chambers exhibited fluctuating potentials as they were subjected to temperature and RH changes. The majority of corrosion potential data stayed between -70 and -220 mV versus PSE or -200 and -350 mV versus CSE. This range corresponds to uncertain corrosion state according to ASTM C876 criteria.(18)

While a voided specimen containing 0.08 percent chloride showed little change upon water recharging, the other specimens containing 0.4, 0.6, 0.8, and 2.0 percent chloride concentrations experienced a potential drop in the negative direction as soon as water entered the voids. Since more negative corrosion potential means more thermodynamically susceptible to corrosion, the added water should have made these voided specimens more corrosion active. The most negative corrosion potential, -380 mV versus PSE, was exhibited by a stressed specimen containing 2.0 percent chloride concentration (see figure 99), which is equivalent to approximately -410 mV versus ACE or -510 mV versus CSE. Such a negative potential is considered very active corrosion even for ordinary reinforced concrete.

Most control specimens in room temperature remained in the relatively positive potential range throughout the study, indicating enhanced passive behavior regardless of chloride concentration. Introduction of air holes (no water added) to 0.08, 0.4, and 0.8 percent chloride specimens did not influence their corrosion potential trends. One exception was noted for 1.0 percent chloride voided control specimen. This specimen exhibited a sudden potential drop to nearly -200 mV versus PSE or -330 mV versus CSE at the 177th day as shown in figure 87, indicating that corrosion might have just initiated in the specimen containing the highest chloride concentration among the voided specimens. Comparing corrosion potential data of the accelerated corrosion testing specimens to those exposed in the room temperature reveals that alternating temperature and RH was effective to expedite strand corrosion in the former group.
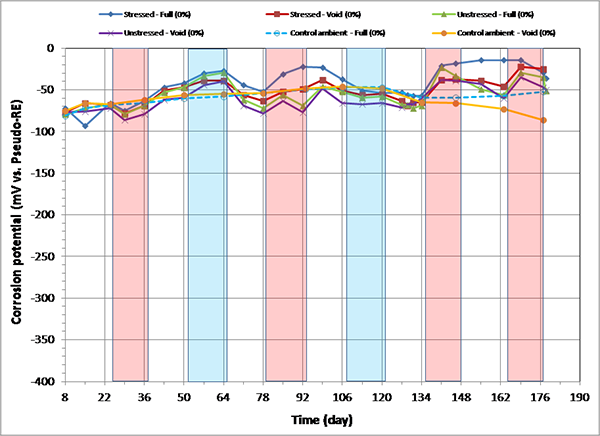
Figure 92. Graph. Corrosion potential versus time for 0 percent chloride single-strand specimens. This graph shows corrosion potential versus time for 0 percent chloride single-strand specimens. Corrosion potential is on the y-axis from -400 to 0 mV, and time is on the x-axis from 8 to 190 days. Six lines are shown, all at 0 percent chloride: stressed full, unstressed void, stressed void, control ambient full, unstressed full, and control ambient void. Individual hot and humid and freezing and dry cycles are highlighted with red and blue columns, respectively. White columns indicate either initial ambient or ambient cycles. All data exhibited positive potentials, indicating passive behavior.
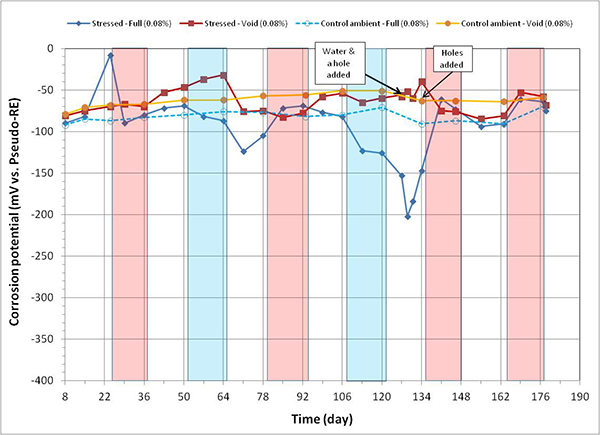
Figure 92. Graph. Corrosion potential versus time for 0 percent chloride single-strand specimens.

Figure 93. Graph. Corrosion potential versus time for 0.08 percent chloride single-strand specimens. This graph shows corrosion potential versus time for 0.08 percent chloride single-strand specimens. Corrosion potential is on the y-axis from -400 to 0 mV, and time is on the x-axis from 8 to 190 days. Four lines are shown, all at 0.08 percent chloride: stressed full, stressed void, control ambient full, and control ambient void. Individual hot and humid and freezing and dry cycles are highlighted with red and blue columns, respectively. White columns indicate either initial ambient or ambient cycles. A duct hole and water were introduced into the stressed specimen’s void after 129 days of testing, and 4 duct holes were introduced in the control specimen’s void after 134 days of testing. All data exhibited positive potentials, indicating passive behavior except for the fully grouted stressed specimen.
Figure 93. Graph. Corrosion potential versus time for 0.08 percent chloride single-strand specimens.
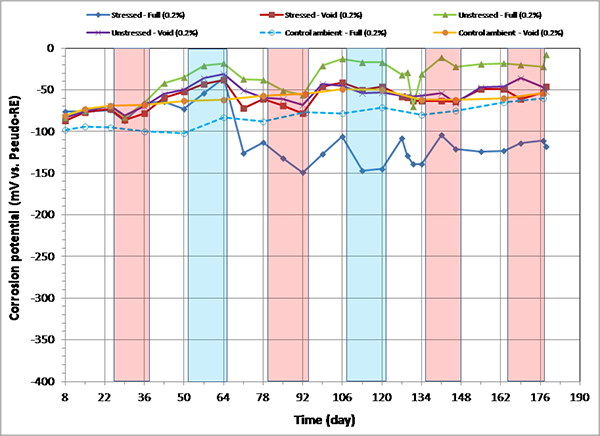
Figure 94. Graph. Corrosion potential versus time for 0.2 percent chloride single-strand specimens. This graph shows corrosion potential versus time for 0.2 percent chloride single-strand specimens. Corrosion potential is on the y-axis from -400 to 0 mV, and time is on the x-axis from 8 to 190 days. Six lines are shown, all at 0.2 percent chloride: stressed full, unstressed void, stressed void, control ambient full, unstressed full, and control ambient void. Individual hot and humid and freezing and dry cycles are highlighted with red and blue columns, respectively. White columns indicate either initial ambient or ambient cycles. All data exhibited positive potentials, indicating passive behavior except for the fully grouted stressed specimen.
Figure 94. Graph. Corrosion potential versus time for 0.2 percent chloride single-strand specimens.
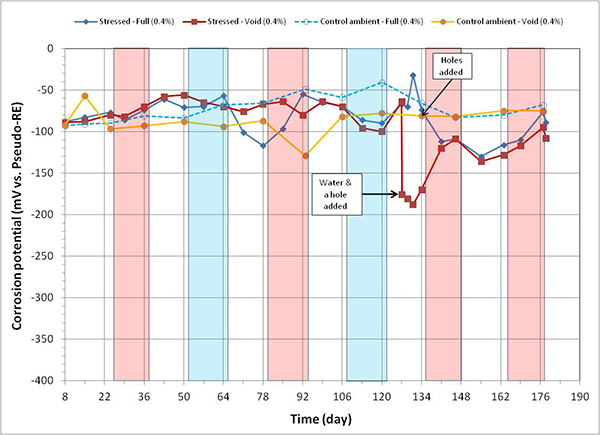
Figure 95. Graph. Corrosion potential versus time for 0.4 percent chloride single-strand specimens. This graph shows corrosion potential versus time for 0.4 percent chloride single-strand specimens. Corrosion potential is on the y-axis from -400 to 0 mV, and time is on the x-axis from 8 to 190 days. Four lines are shown, all at 0.4 percent chloride: stressed full, stressed void, control ambient full, and control ambient void. Individual hot and humid and freezing and dry cycles are highlighted with red and blue columns, respectively. White columns indicate either initial ambient or ambient cycles. A duct hole and water were introduced into the stressed specimen’s void after 129 days of testing, and 4 duct holes were introduced in the control specimen’s void after 134 days of testing. All data exhibited positive potentials, indicating passive behavior except for the voided stressed specimen upon water recharging.
Figure 95. Graph. Corrosion potential versus time for 0.4 percent chloride single-strand specimens.
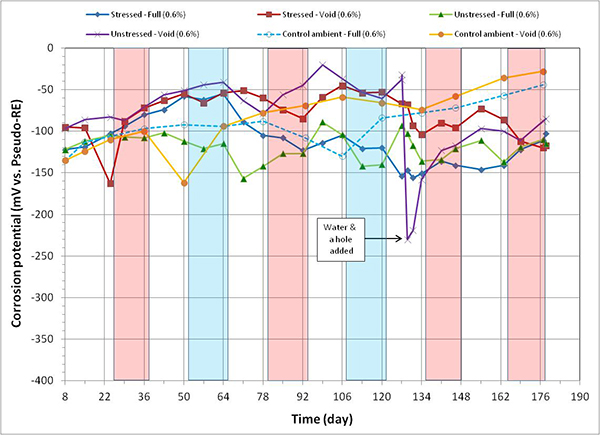
Figure 96. Graph. Corrosion potential versus time for 0.6 percent chloride single-strand specimens. This graph shows corrosion potential versus time for 0.6 percent chloride single-strand specimens. Corrosion potential is on the y-axis from -400 to 0 mV, and time is on the x-axis from 8 to 190 days. Six lines are shown, all at 0.6 percent chloride: stressed full, unstressed void, stressed void, control ambient full, unstressed full, and control ambient void. Individual hot and humid and freezing and dry cycles are highlighted with red and blue columns, respectively. White columns indicate either initial ambient or ambient cycles. A duct hole and water were introduced into the unstressed specimen’s void after 129 days of testing. The control specimens exhibited positive potentials, indicating passive behavior, whereas the others showed a slightly active behavior, especially the voided unstressed specimen upon water recharging.
Figure 96. Graph. Corrosion potential versus time for 0.6 percent chloride single-strand specimens.
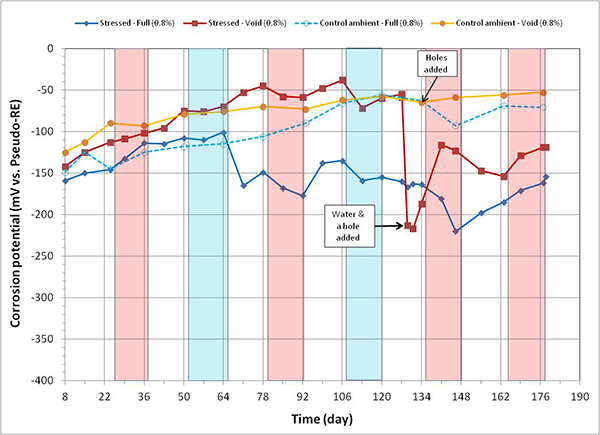
Figure 97. Graph. Corrosion potential versus time for 0.8 percent chloride single-strand specimens. This graph shows corrosion potential versus time for 0.8 percent chloride single-strand specimens. Corrosion potential is on the y-axis from -400 to 0 mV, and time is on the y-axis from 8 to 190 days. Four lines are shown, all at 0.8 percent chloride: stressed full, stressed void, control ambient full, and control ambient void. Individual hot and humid and freezing and dry cycles are highlighted with red and blue columns, respectively. White columns indicate either initial ambient or ambient cycles. A duct hole and water were introduced into the stressed specimen’s void after 129 days of testing, and 4 duct holes were introduced in the control specimen’s void after 134 days of testing. Control specimens exhibited positive potentials, indicating passive behavior, whereas the others showed active behavior, especially the voided stressed specimen upon water recharging.
Figure97. Graph. Corrosion potential versus time for 0.8 percent chloride single-strand specimens.
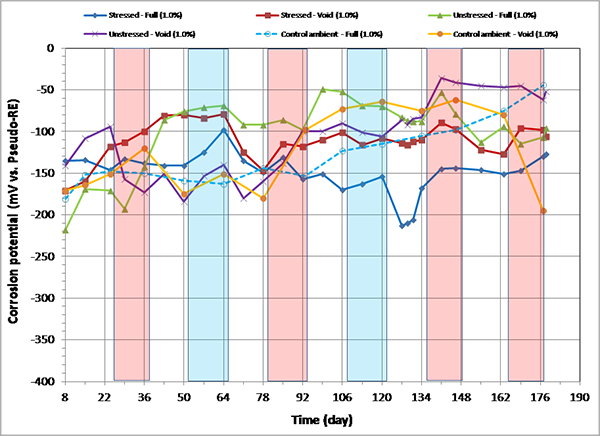
Figure 98. Graph. Corrosion potential versus time for 1.0 percent chloride single-strand specimens. This graph shows corrosion potential versus time for 1.0 percent chloride single-strand specimens. Corrosion potential is on the y-axis from -400 to 0 mV, and time is on the x-axis from 8 to 190 days. Six lines are shown, all at 1.0 percent chloride: stressed full, unstressed void, stressed void, control ambient full, unstressed full, and control ambient void. Individual hot and humid and freezing and dry cycles are highlighted with red and blue columns, respectively. White columns indicate either initial ambient or ambient cycles. Control specimens exhibited positive potentials, indicating passive behavior, whereas the others showed active behavior.
Figure 98. Graph. Corrosion potential versus time for 1.0 percent chloride single-strand specimens.
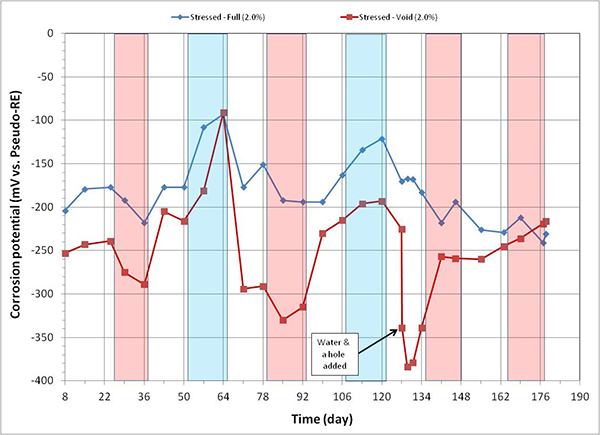
Figure 99. Graph. Corrosion potential versus time for 2.0 percent chloride single-strand specimens. This graph shows corrosion potential versus time for 2.0 percent chloride single-strand specimens. Corrosion potential is on the y-axis from -400 to 0 mV, and time is on the x-axis from 8 to 190 days. Two lines are shown, both at 2.0 percent chloride: stressed full and stressed void. Individual hot and humid and freezing and dry cycles are highlighted with red and blue columns, respectively. White columns indicate either initial ambient or ambient cycles. A duct hole and water were introduced into the stressed specimen’s void after 
129 days of testing. Both specimens exhibited very active corrosion behavior, especially the voided stressed specimen upon water recharging.
Figure 99. Graph. Corrosion potential versus time for 2.0 percent chloride single-strand specimens.

Fully Grouted Specimens Versus Voided Specimens

Figure 100 through figure 103 summarize mean corrosion potentials calculated for the stressed and unstressed strands in fully grouted specimens per chloride concentration in initial ambient, ambient, H & H, and F & D cycles, respectively. Similar plots for the voided specimens are presented in figure 104 through figure 107. Because water was added to some of the voided specimens after initial ambient and F & D cycles were completed, mean corrosion potential data related to post-water recharging event are presented in figure 105 (ambient) and figure 106 (H & H) only. In addition, control specimen data were also included in relevant initial ambient and ambient plots.

In general, mean corrosion potentials of both specimen types were gradually more negative as chloride concentration increased. As a result, the 2.0 percent chloride specimens exhibited the most negative mean corrosion potentials in each exposure condition except for F & D condition. Adding 0.17 fl oz of distilled water to the 0.08 percent chloride specimen did not change its mean corrosion potentials as shown in figure 105 and figure 106. Conversely, the voided specimens containing 0.4 to 2.0 percent chloride resulted in more negative mean corrosion potentials upon water recharging relative to those measured before adding water. The risk of corrosion is elevated with increasing chloride concentration if water enters voids in the grout containing higher acid-soluble chloride concentration than 0.08 percent by weight of cement, which is the current chloride limit specified by many design codes and specifications.(1)

The control specimens did not exhibit noticeable changes in corrosion potentials upon air hole introduction. Conversely, the specimens that received recharging water became active regardless of air holes. Therefore, it is concluded that presence of air holes alone did not impact corrosion potentials of the voided single-strand specimens.

The effect of stress on mean corrosion potential was not apparent for fully grouted specimens. For voided specimens after water recharging, stressed specimens containing 0.4 and 0.8 percent chloride experienced larger potential drops than a single unstressed specimen containing 0.6 percent chloride (see figure 105 and figure 106). The limited data suggest that stressed strands may be more susceptible to corrosion compared to the unstressed ones if the grout void is filled with water.
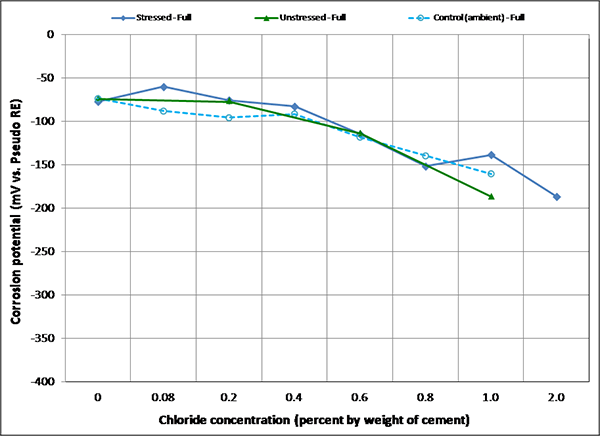
Figure 100. Graph. Mean corrosion potential of fully grouted single-strand specimens in initial ambient condition. This graph shows mean corrosion potentials for stressed and unstressed strands in fully grouted specimens per chloride concentration in initial ambient condition. Corrosion potential is on the y-axis from -400 to 0 mV, and chloride concentration is on the x-axis from 0 to 2.0 percent by weight of cement. Three lines are shown: stressed full, unstressed full, and control (ambient) full. In general, mean corrosion potentials of both specimen types were gradually more negative as chloride concentration increased. As a result, the 2.0 percent chloride specimens exhibited the most negative mean corrosion potentials in each exposure condition.
Figure 100. Graph. Mean corrosion potential of fully grouted single-strand specimens in initial ambient condition.
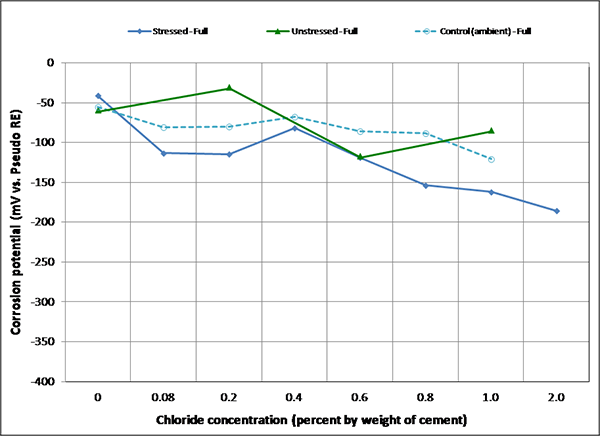
Figure 101. Graph. Mean corrosion potential of fully grouted single-strand specimens in ambient condition. This graph shows mean corrosion potentials for stressed and unstressed strands in fully grouted specimens per chloride concentration in ambient condition. Corrosion potential is on the y-axis from -400 to 0 mV, and chloride concentration is on the x-axis from 0 to 2.0 percent by weight of cement. Three lines are shown: stressed full, unstressed full, and control (ambient) full. In general, mean corrosion potentials of both specimen types were more negative gradually as chloride concentration increased. As a result, the 2.0 percent chloride specimens exhibited the most negative mean corrosion potentials in each exposure condition.
Figure 101. Graph. Mean corrosion potential of fully grouted single-strand specimens in ambient condition.
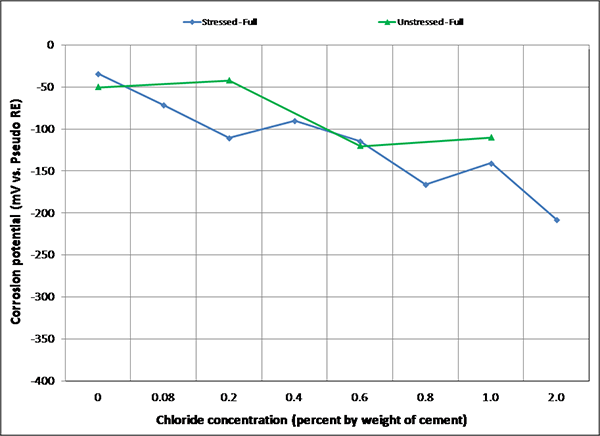
Figure 102. Graph. Mean corrosion potential of fully grouted single-strand specimens in H & H condition. This graph shows mean corrosion potentials for stressed and unstressed strands in fully grouted specimens per chloride concentration in the hot and humid (H & H) condition. Corrosion potential is on the y-axis from -400 to 0 mV, and chloride concentration is on the x-axis from 0 to 2.0 percent by weight of cement. Two lines are shown: stressed full and unstressed full. In general, mean corrosion potentials of both specimen types were gradually more negative as chloride concentration increased. As a result, the 2.0 percent chloride specimens exhibited the most negative mean corrosion potentials in each exposure condition.
Figure 102. Graph. Mean corrosion potential of fully grouted single-strand specimens in H & H condition.
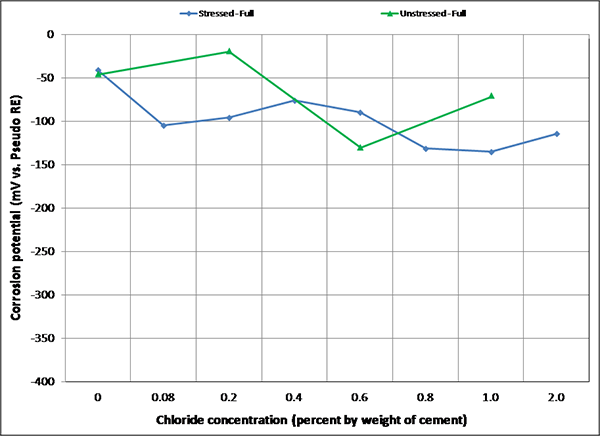
Figure 103. Graph. Mean corrosion potential of fully grouted single-strand specimens in F & D condition. This graph shows mean corrosion potentials for stressed and unstressed strands in fully grouted specimens per chloride concentration in the freezing and dry (F & D) condition. Corrosion potential is on the y-axis from -400 to 0 mV, and chloride concentration is on the x-axis from 0 to 2.0 percent by weight of cement. In general, mean corrosion potentials of both specimen types tended to be more positive compared to other exposure conditions even if chloride concentration increased.
Figure 103. Graph. Mean corrosion potential of fully grouted single-strand specimens in F & D condition.
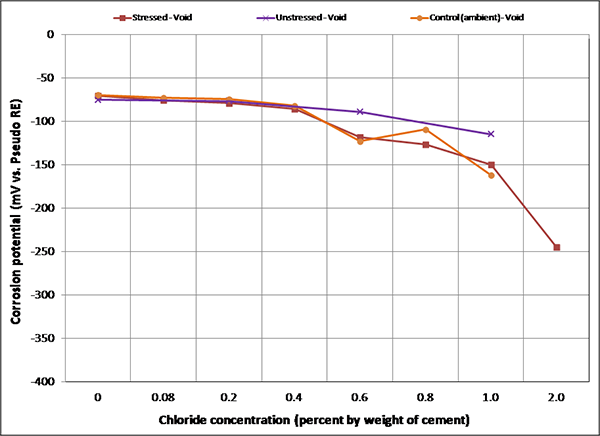
Figure 104. Graph. Mean corrosion potential of voided single-strand specimens in initial ambient condition. This graph shows mean corrosion potential for stressed and unstressed strands in voided single-strand specimens per chloride concentration in initial ambient condition. Corrosion potential is on the y-axis from -400 to 0 mV, and chloride concentration is on the x-axis from 0 to 2.0 percent by weight of cement. Three lines are shown: stressed void, unstressed void, and control (ambient) void. In general, mean corrosion potentials of both specimen types were more negative gradually as chloride concentration increased. As a result, the 2.0 percent chloride specimens exhibited the most negative mean corrosion potentials in each exposure condition.
Figure 104. Graph. Mean corrosion potential of voided single-strand specimens in initial ambient condition.
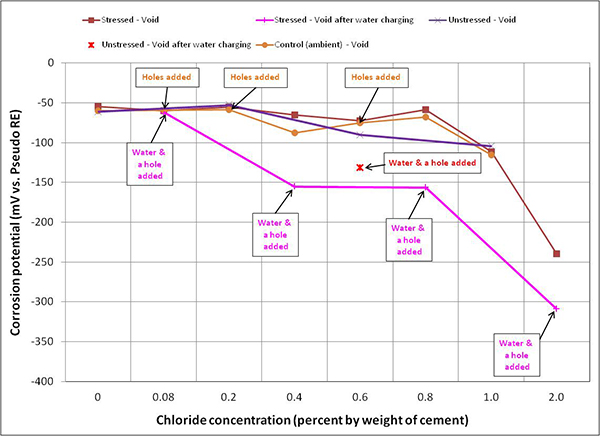
Figure 105. Graph. Mean corrosion potential of voided single-strand specimens in ambient condition. This graph shows mean corrosion potential for stressed and unstressed strands in voided single-strand specimens per chloride concentration in ambient condition. Corrosion potential is on the y-axis from -400 to 0 mV, and chloride concentration is on the x-axis from 0 to 2.0 percent by weight of cement. Five types of data are shown: stressed void, unstressed void after water recharging, stressed void after water charging, unstressed void, and control (ambient) void. Duct holes and water were introduced into 0.08, 0.4, 0.6, 0.8, and 2.0 percent chloride specimens, and duck holes were introduced to 0.08, 0.2, and 0.6 percent chloride control specimens. In general, mean corrosion potentials were more gradually negative as chloride concentration increased. As a result, the 2.0 percent chloride specimens exhibited the most negative mean corrosion potentials in each exposure condition. Adding 0.17 fl oz of distilled water made the mean corrosion potentials more negative except for the 0.08 percent chloride specimen.
Figure 105. Graph. Mean corrosion potential of voided single-strand specimens in ambient condition.
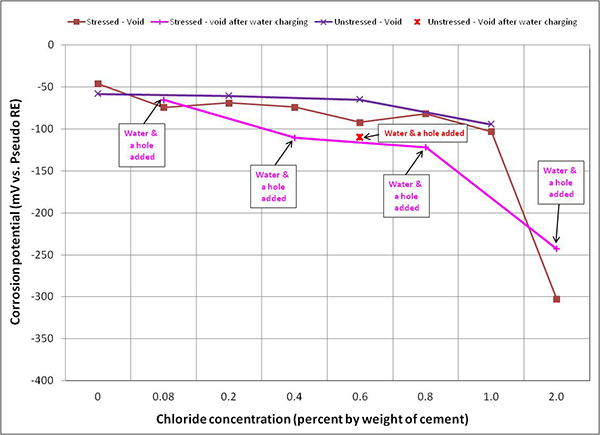
Figure 106. Graph. Mean corrosion potential of voided single-strand specimens in H & H condition. This graph shows mean corrosion potential for stressed and unstressed strands in voided single-strand specimens per chloride concentration in the hot and humid (H & H) condition. Corrosion potential is on the y-axis from -400 to 0 mV, and chloride concentration is on the x-axis from 0 to 2.0 percent by weight of cement. Duct holes and water were introduced into 0.08, 0.4, 0.6, 0.8, and 2.0 percent chloride specimens, and duck holes were introduced to 0.08, 0.2, and 0.6 percent chloride control specimens. In general, mean corrosion potentials of both specimen types were gradually more negative as chloride concentration increased. As a result, the 2.0 percent chloride specimens exhibited the most negative mean corrosion potentials in each exposure condition. Adding 0.17 fl oz of distilled water made its mean corrosion potentials more negative except for the 0.08 percent chloride specimen.
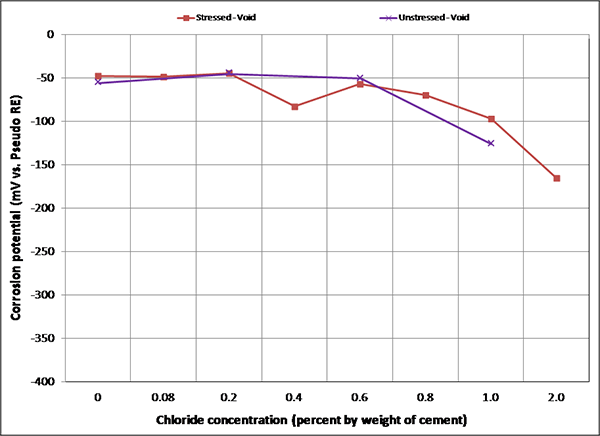
Figure 106. Graph. Mean corrosion potential of voided single-strand specimens in H & H condition.

Figure 107. Graph. Mean corrosion potential of voided single-strand specimens in F & D condition. This graph shows mean corrosion potentials for stressed and unstressed strands in voided single-strand specimens per chloride concentration in the freezing and dry (F & D) condition. Corrosion potential is on the y-axis from -400 to 0 mV, and chloride concentration is on the x-axis from 0 to 2.0 percent by weight of cement. Two lines are shown: stressed void and unstressed void. In general, mean corrosion potentials of both specimen types were gradually more negative as chloride concentration increased. As a result, the 2.0 percent chloride specimens exhibited the most negative mean corrosion potentials in each exposure condition.
Figure 107. Graph. Mean corrosion potential of voided single-strand specimens in F & D condition.

TASK 2.3: CORROSION POTENTIALS AND POLARIZED POTENTIALS OF MULTI-STRAND SPECIMENS

Figure 108 through figure 115 present corrosion potentials of stressed strands (macro-anode) and unstressed strands (macro-cathode) versus time plots for multi-strand specimens. The plots also contain their polarized potentials. Polarization in electrochemistry is defined as a potential shift corresponding to a directional current flow. Anodic polarization occurs in the positive potential direction when current leaves the electrode into electrolyte, while cathodic polarization occurs in the negative potential direction if current enters the electrode from the electrolyte. Flow of electrons is opposite to the current flow by the known sign convention. The polarized potential is often called “mixed potential” because macro-anode is polarized from its corrosion potential in the positive direction, and macro-cathode is polarized from its corrosion potential in the negative direction until their polarized potentials intersect at a mid-point where steady state macro-cell current is maintained.

Corrosion potentials of macro-anode and macro-cathode of multi-strand specimens containing 0 to 0.2 percent chloride remained above -150 mV versus PSE, thus their potential difference was small (roughly less than 100 mV). Their data are shown in figure 108 through figure 110. When chloride concentration increased to between 0.4 and 1.0 percent, the majority of stressed strand corrosion potentials became more negative than -200 mV versus PSE. Since they were equivalent to more negative than -350 mV versus CSE, active corrosion of the stressed strands was evident. These data are shown in figure 111 through figure 114. The majority of unstressed strands corrosion potentials still remained above -150 mV versus PSE. As a result, potential difference became larger than 150 mV in many cases. A larger potential difference means a greater driving force for macro-cell corrosion current to flow. Subsequently, when acid-soluble chloride concentration was higher than 0.4 percent by weight of cement, multi-strand specimens developed large driving voltage between macro-anode (stressed strands) and macro-cathode (unstressed strands) to facilitate active macro-cell corrosion. Multi-strand specimens were intended to create intensive macro-cell corrosion by design, and actual data supported that the specimen design worked to produce realistic macro-cell corrosion damage on the stressed strands.

When 5.1 fl oz of distilled water was added in the voids, most specimens (0.08, 0.2, 0.4, 0.6, 1.0, and 2.0 percent chloride) experienced negative potential shifts immediately. The others experienced either no change (0 percent chloride in figure 108) or positive potential shifts (0.8 percent chloride in figure 113) upon water recharging. All three kinds of potentials of the 0.8 percent chloride specimen remained in the positive range afterwards. This specimen’s duct cracked during the second F & D cycle, and emergency repair was made just before water recharging (see figure 50 through figure 55). In addition, 24 0.5-inch-diameter holes were introduced over the repaired duct along with the water recharging event to see whether more oxygen can diffuse to the strands (see figure 57 and figure 58). This is the only multi-strand specimen that received the air holes. As will be discussed later, the upward potential shifts might have been caused by increased oxygen levels at the strands.

Corrosion potential data of macro-cathode in 2.0 percent chloride specimen started to corrode approximately 1 month after accelerated corrosion testing began (see figure 115). Such an early corrosion of macro-cathode shifted its corrosion potential steadily toward the more negative direction approaching corrosion potential of macro-anode. Figure 115 shows that both corrosion potentials became similar from the 106th day onward. Consequently, the intended macro-cell corrosion setup of 2.0 percent chloride specimen became less effective with time in association with the shrinking driving voltage.
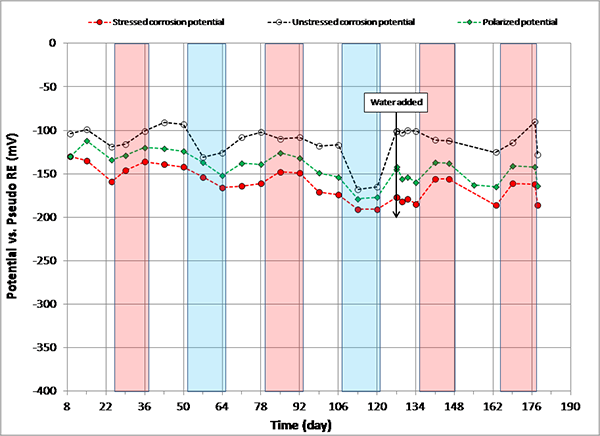
Figure 108. Graph. Potential versus time for 0 percent chloride multi-strand specimen. This graph shows corrosion potential of stressed strands (macro-anode) and unstressed strands (macro-cathode) versus time for 0 percent multi-strand specimen. Corrosion potential is on the y-axis from -400 to 0 mV, and time is on the x-axis from 8 to 190 days. Three lines are shown: stressed corrosion potential, unstressed corrosion potential, and polarized potential. Individual hot and humid and freezing and dry cycles are highlighted with red and blue columns, respectively. White columns indicate either initial ambient or ambient cycles. Water was added to the voided space after 127 days of testing. Corrosion potentials of macro-anode and macro-cathode remained above -150 mV, thus their potential difference was small (roughly less than 100 mV).
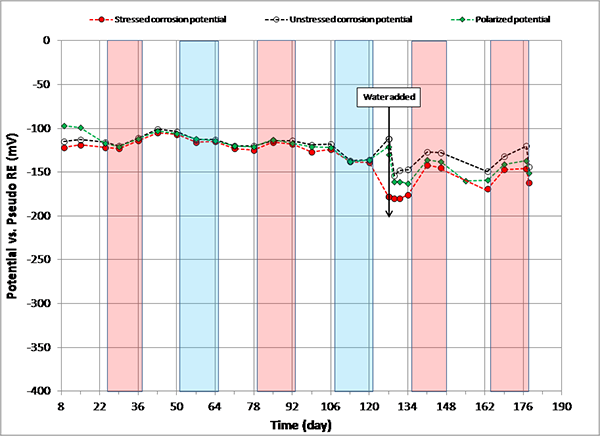
Figure 108. Graph. Potential versus time for 0 percent chloride multi-strand specimen.

Figure 109. Graph. Potential versus time for 0.08 percent chloride multi-strand specimen. This graph shows corrosion potential of stressed strands (macro-anode) and unstressed strands (macro-cathode) versus time for 0.08 percent multi-strand specimen.  Corrosion potential is on the y-axis from -400 to 0 mV, and time is on the x-axis from 8 to 190 days. Three lines are shown: stressed corrosion potential, unstressed corrosion potential, and polarized potential. Individual hot and humid and freezing and dry cycles are highlighted with red and blue columns, respectively. White columns indicate either initial ambient or ambient cycles. Water was added to the voided space after 127 days of testing. Corrosion potentials of the macro-anode and the macro-cathode remained above -150 mV, thus their potential difference was small (roughly less than 100 mV).
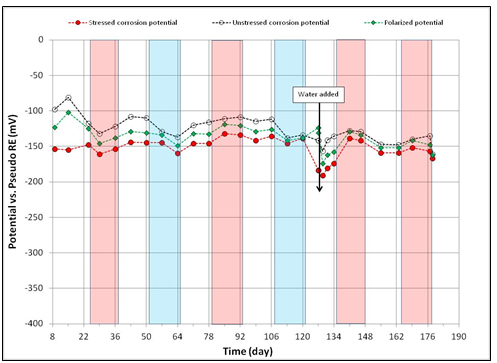
Figure 109. Graph. Potential versus time for 0.08 percent chloride multi-strand specimen.

Figure 110. Graph. Potential versus time for 0.2 percent chloride multi-strand specimen. This graph shows corrosion potential of stressed strands (macro-anode) and unstressed strands (macro-cathode) versus time for 0.2 percent multi-strand specimen. Corrosion potential is on the y-axis from -400 to 0 mV, and time is on the x-axis from 8 to 190 days. Three lines are shown: stressed corrosion potential, unstressed corrosion potential, and polarized potential. Individual hot and humid and freezing and dry cycles are highlighted with red and blue columns, respectively. White columns indicate either initial ambient or ambient cycles. Water was added to the voided space after 127 days of testing. Corrosion potentials of the macro-anode and the macro-cathode remained above -150 mV, thus their potential difference was small (roughly less than 100 mV).
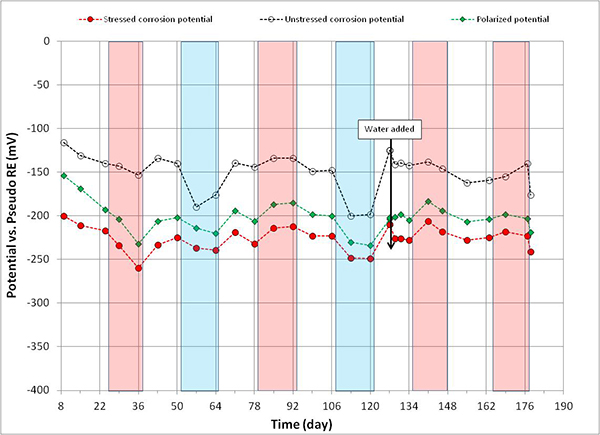
Figure 110. Graph. Potential versus time for 0.2 percent chloride multi-strand specimen.
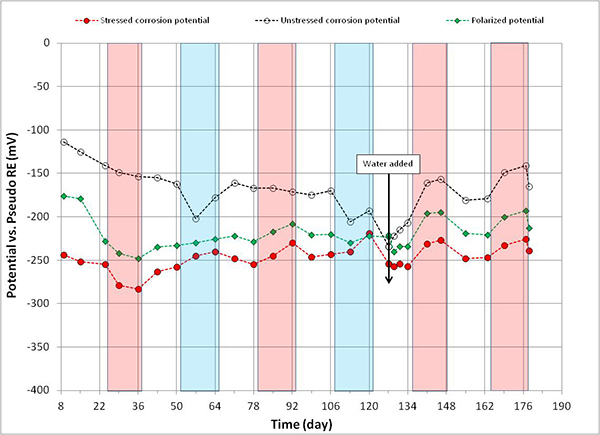
Figure 111. Graph. Potential versus time for 0.4 percent chloride multi-strand specimen. This graph shows corrosion potential of stressed strands (macro-anode) and unstressed strands (macro-cathode) versus time for 0.4 percent multi-strand specimen. Corrosion potential is on the y-axis from -400 to 0 mV, and time is on the x-axis from 8 to 190 days. Three lines are shown: stressed corrosion potential, unstressed corrosion potential, and polarized potential. Individual hot and humid and freezing and dry cycles are highlighted with red and blue columns, respectively. White columns indicate either initial ambient or ambient cycles. Water was added to the voided space after 127 days of testing. The majority of stressed strand corrosion potentials became more negative than -200 mV, and active corrosion of the stressed strands was evident. The majority of unstressed strands corrosion potentials still remained above -150 mV. As a result, potential difference became larger than 150 mV in many cases.
Figure 111 . Graph. Potential versus time for 0.4 percent chloride multi-strand specimen.

Figure 112. Graph. Potential versus time for 0.6 percent chloride multi-strand specimen. This graph shows corrosion potential of stressed strands (macro-anode) and unstressed strands (macro-cathode) versus time for 0.6 percent multi-strand specimen. Corrosion potential is on the y-axis from -400 to 0 mV, and time is on the x-axis from 8 to 190 days. Three lines are shown: stressed corrosion potential, unstressed corrosion potential, and polarized potential. Individual hot and humid and freezing and dry cycles are highlighted with red and blue columns, respectively. White columns indicate either initial ambient or ambient cycles. Water was added to the voided space after 127 days of testing. The majority of stressed strand corrosion potentials became more negative than -200 mV, and active corrosion of the stressed strands was evident. The majority of unstressed strands corrosion potentials still remained above -150 mV. As a result, potential difference became larger than 150 mV in many cases.
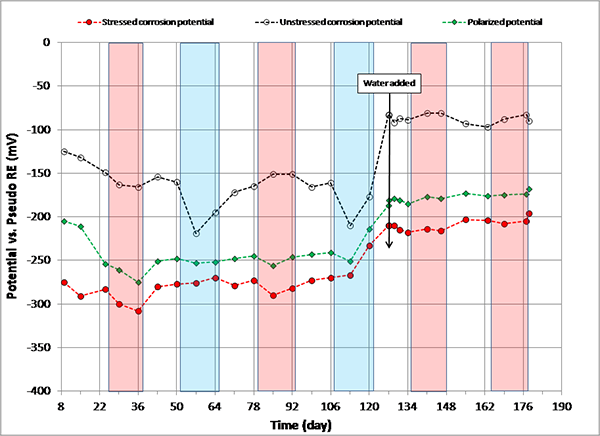
Figure 112. Graph. Potential versus time for 0.6 percent chloride multi-strand specimen.
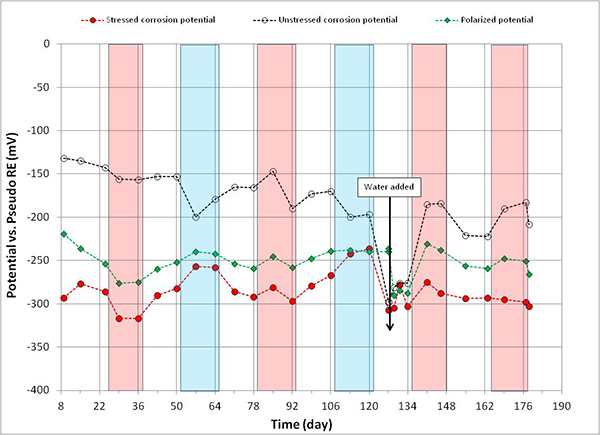
Figure 113. Graph. Potential versus time for 0.8 percent chloride multi-strand specimen. This graph shows corrosion potential of stressed strands (macro-anode) and unstressed strands (macro-cathode) versus time for 0.8 percent multi-strand specimen. Corrosion potential is on the y-axis from -400 to 0 mV, and time is on the x-axis from 8 to 190 days. Three lines are shown: stressed corrosion potential, unstressed corrosion potential, and polarized potential. Individual hot and humid and freezing and dry cycles are highlighted with red and blue columns, respectively. White columns indicate either initial ambient or ambient cycles. Water was added to the voided space after 127 days of testing. The majority of stressed strand corrosion potentials became more negative than -200 mV, and active corrosion of the stressed strands was evident. The majority of unstressed strands corrosion potentials still remained above -150 mV. As a result, potential difference became larger than 150 mV in many cases.
Figure 113 . Graph. Potential versus time for 0.8 percent chloride multi-strand specimen.

Figure 114. Graph. Potential versus time for 1.0 percent chloride multi-strand specimen. This graph shows corrosion potential of stressed strands (macro-anode) and unstressed strands (macro-cathode) versus time for 1.0 percent multi-strand specimen. Corrosion potential is on the y-axis from -400 to 0 mV, and time is on the x-axis from 8 to 190 days. Three lines are shown: stressed corrosion potential, unstressed corrosion potential, and polarized potential. Individual hot and humid and freezing and dry cycles are highlighted with red and blue columns, respectively. White columns indicate either initial ambient or ambient cycles. Water was added to the voided space after 127 days of testing. The majority of stressed strand corrosion potentials became more negative than -200 mV, and active corrosion of the stressed strands was evident. The majority of unstressed strands corrosion potentials still remained above -150 mV. As a result, potential difference became larger than 150 mV in many cases.
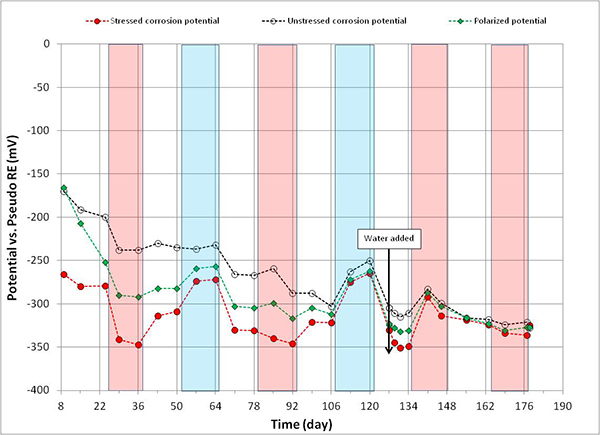
Figure 114. Graph. Potential versus time for 1.0 percent chloride multi-strand specimen.

Figure 115. Graph. Potential versus time for 2.0 percent chloride multi-strand specimen. This graph shows corrosion potential of stressed strands (macro-anode) and unstressed strands (macro-cathode) versus time for 2.0 percent multi-strand specimen. Corrosion potential is on the y-axis from -400 to 0 mV, and time is on the x-axis from 8 to 190 days. Three lines are shown: stressed corrosion potential, unstressed corrosion potential, and polarized potential. Individual hot and humid and freezing and dry cycles are highlighted with red and blue columns, respectively. White columns indicate either initial ambient or ambient cycles. Water was added to the voided space after 127 days of testing. The majority of stressed strand corrosion potentials became more negative than -200 mV, and active corrosion of the stressed strands was evident. Corrosion potential data of macro-cathode started to corrode approximately 1 month after the accelerated corrosion testing begun. Such an early corrosion of macro-cathode shifted its corrosion potential steadily toward more negative direction approaching corrosion potential of macro-anode, and both corrosion potentials became similar from the 106th day onward.
Figure 115. Graph. Potential versus time for 2.0 percent chloride multi-strand specimen.

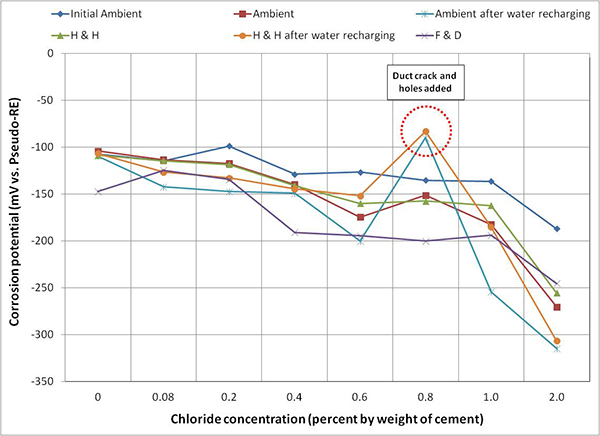
Figure 116 through figure 118 present mean corrosion potentials per chloride concentration and exposure condition of stressed strands, unstressed strands, and mean polarized potentials, respectively. As discussed earlier, stressed strands (macro-anode) exhibited more negative mean corrosion potentials than unstressed ones (macro-cathode). Comparing all the plots in the figures, it appears that the stressed strands exhibited the most negative potentials at any chloride concentration, irrespective of exposure condition and water in the void. It is unclear if presence of stress or localized corrosion at the void/grout interface or both factors made the entire stressed strands active. Although water recharging made the corrosion potentials of the stressed strands more negative, potential changes before and after water recharging were less than 50 mV in most chloride concentrations. Once chloride concentration increased to 0.4 percent, mean corrosion potentials of stressed strands fell into the 90 percent corrosion probability threshold, -220 mV versus PSE (-350 mV versus CSE), independent of exposure condition as shown in figure 116. The same situation occurred for unstressed strands only after chloride concentration reached 2.0 percent as shown in figure 117.
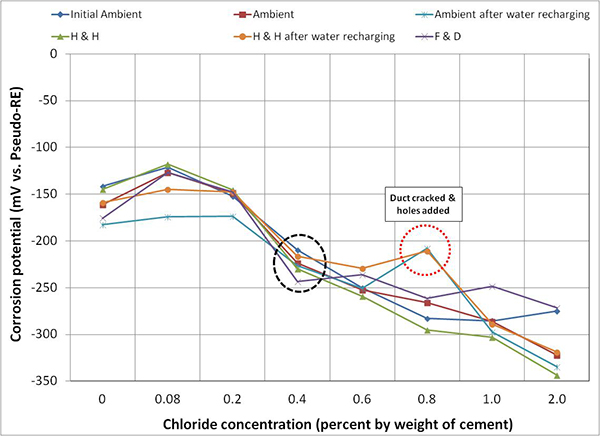
Figure 116. Graph. Mean corrosion potentials of stressed strands in multi-strand specimens. This graph shows mean corrosion potentials of stressed strands in multi-strand specimens per chloride concentration and exposure condition. Corrosion potential is on the 
y-axis from -350 to 0 mV, and chloride concentration is on the x-axis from 0 to 2.0 percent by weight of cement. Six lines are shown: initial ambient, hot and humid (H & H), ambient, H & H after water recharging, ambient after water recharging, and freezing and dry. All lines exhibited more negative mean corrosion potentials with increasing chloride concentration. The mean corrosion potentials of stressed strands at 0.4 percent chloride, encompassed by a black circle, fell into the 90 percent corrosion probability threshold, -220 mV versus pseudo-reference electrode, independent of exposure condition. The mean corrosion potentials of stressed strands at 0.8 percent chloride, grouped by a red circle, became more positive upon duct cracking and adding holes during the ambient and H & H exposure conditions than those determined under the other exposure conditions.
Figure 116. Graph. Mean corrosion potential of stressed strands in multi-strand specimens.

Figure 117. Graph. Mean corrosion potential of unstressed strands in multi-strand specimens. This graph shows mean corrosion potentials of unstressed strands in multi-strand specimens per chloride concentration and exposure condition. Corrosion potential is on the y-axis from -350 to 0 mV, and chloride concentration is on the x-axis from 0 to 2.0 percent by weight of cement. Six lines are shown: initial ambient, hot and humid (H & H), ambient, H & H after water recharging, ambient after water recharging, and freezing and dry. All lines exhibited more negative mean corrosion potentials with increasing chloride concentration but less negative mean corrosion potentials than those shown in figure 116. The mean corrosion potentials of unstressed strands at 0.8 percent chloride, grouped by a red circle, became more positive upon duct cracking and adding holes during the ambient and H & H exposure conditions than those determined under the other exposure conditions.
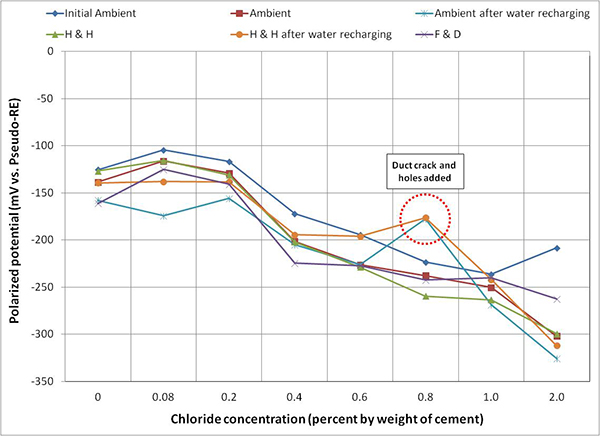
Figure 117. Graph. Mean corrosion potential of unstressed strands in multi-strand specimens.

Figure 118. Graph. Mean polarized potential of multi-strand specimens. This graph shows mean polarized potentials of multi-strand specimens per chloride concentration and exposure condition with increasing chloride concentration. Polarized potential is on the y-axis from -350 to 0 mV, and chloride concentration is on the x-axis from 0 to 2.0 percent by weight of cement. Six lines are shown: initial ambient, hot and humid (H & H), ambient, H & H after water recharging, ambient after water recharging, and freezing and dry. The mean polarized potentials of all strands at 0.8 percent chloride, grouped by a red circle, become more positive upon duct cracking and adding holes during the ambient and H & H exposure conditions than those determined under the other exposure conditions. All lines exhibit more negative mean polarized potentials with increasing chloride concentration. They are more negative than the mean corrosion potentials shown in figure 117 but more positive than those shown in figure 116.
Figure 118. Graph. Mean polarized potential of multi-strand specimens.

Figure 119 shows overall mean corrosion potentials of stressed and unstressed strands and overall mean polarized potentials as a function of chloride concentration. Overall mean corrosion potentials of stressed strands decreased more than 120 mV when chloride concentration increased to 0.4 percent by weight of cement. Such a large decrease suggests that the stressed PT strands initiated active corrosion at 0.4 percent chloride concentration. At chloride concentrations between 0.4 and 1.0 percent, overall mean polarized potential was closer to overall mean stressed corrosion potentials instead of being near the overall mean unstressed corrosion potentials. This behavior suggests that the macro-cell corrosion process in these multi-strand specimens was under cathodic control. Under this condition, oxygen availability must have controlled the most common cathodic reaction given in figure 11.
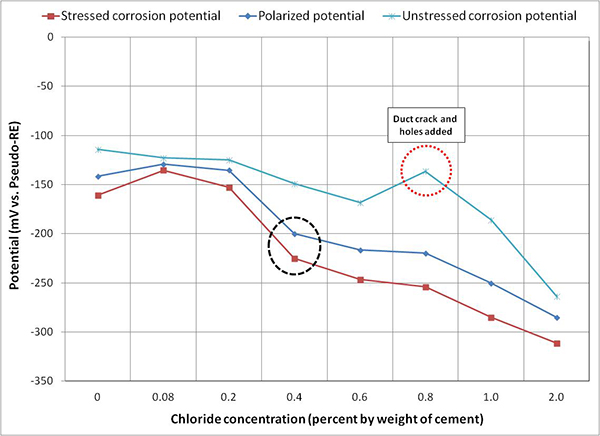
Figure 119. Graph. Overall mean potential of multi-strand specimens. This graph shows overall mean corrosion potentials of stressed and unstressed strands and overall mean polarized potentials as a function of chloride concentration. Corrosion potential is on the y-axis from -350 to 0 mV, and chloride concentration is on the x-axis from 0 to 2.0 percent by weight of cement. Three lines are shown: stressed corrosion potential, polarized potential, and unstressed corrosion potential. The overall mean corrosion and polarized potentials of stressed strands at 0.4 percent chloride, encompassed by a black circle, fall into the 90 percent corrosion probability threshold, -200 mV versus pseudo-reference electrode. The overall mean corrosion potential of unstressed strands at 0.8 percent chloride, grouped by a red circle, become more positive upon duct cracking and adding holes than those determined under undisturbed conditions. Overall mean corrosion potentials of stressed strands decreased more than 120 mV when chloride concentration increased to 0.4 percent by weight of cement. At chloride concentrations between 0.4 and 1.0 percent, the overall mean polarized potential was closer to overall mean stressed corrosion potentials instead of being close to the overall mean unstressed corrosion potentials.
Figure 119 . Graph. Overall mean potential of multi-strand specimens.

Figure 116 through figure 119 show data humps on 0.8 percent chloride specimen data. It was mentioned earlier that the PVC duct of 0.8 percent chloride specimen was cracked, and 24 artificial holes were introduced afterwards. These irregular potential jumps were only related to the data collected after the integrity of the PVC duct was compromised. It is speculated that the positive potential shifts were caused by more oxygen available at the strands that would move potentials in the positive direction by concentration polarization process. This phenomenon can be described with corrosion potential changes from case (1) to case (1') and from case (2) to case (2') in figure 20. This theory also suggests the opposite situation for the other multi-strand specimens, which were encased by tightly sealed ducts that created less oxygen environment.

As will be discussed in the Characterization of Corrosion Morphologies section, it was confirmed that 0 percent chloride concentration specimen corroded due to excessive free sulfate ions at the void/grout interface. In normal conditions without the unintended corrosion, the specimen should have experienced no corrosion, and its potential values should have increased in the positive direction so that their data are placed in more positive positions in the plots than the 0.08 percent chloride potential data.

If the duct cracking problem and excessive sulfate ions in 0 percent chloride concentration specimen as discussed above had not occurred, the data trend lines would have looked more like linear as a function of chloride concentration.

CORROSION RATE AND MACRO-CELL CORROSION CURRENT DENSITY DATA

Task 2.2: Corrosion Rate Data of Single-Strand Specimens

Figure 120 through figure 127 present corrosion rates versus time plots for single-strand specimens. The first measurements after receiving water and/or introducing air holes are indicated in the relevant plots. Total surface area of a PT strand in contact with grout was used to calculate the nominal corrosion rate. The surface area information is listed in table 6. Since the actual size of corroding areas by pitting corrosion and crevice corrosion was relatively small compared to the total surface area, the calculated corrosion rates were low in all chloride concentrations. The corrosion rate data obtained in this study can fall into the negligible range if the corrosion rate criteria listed in table 7 are strictly applied. Since there is little published information available regarding corrosion rate of PT strands measured by the same technique, it is difficult to interpret the experimental data as they were collected. For this reason, data analysis in this section takes into account actual conditions of the extracted strands during the autopsy.

A general trend observed in figure 120 through figure 127 is that specimens subjected to accelerated corrosion testing experienced higher corrosion rates during the H & H cycles and much lower corrosion rates during the F & D cycles. Intermediate corrosion rates were observed in initial ambient and ambient cycles. The observed data confirmed the corrosion rate’s dependency on temperature. However, the corrosion rates also gradually decreased with time. The 1.0 and 2.0 percent chloride specimens depict this trend well because it is easy to see their higher corrosion rates compared to the lower concentration specimens. As observed in corrosion potential data of the voided single-strand specimens, corrosion rate increased when water was added in the voids. As chloride concentration increased, the magnitude of the corrosion rate increase became proportionally larger. The lowest chloride concentration to induce noticeable increase was 0.4 percent (see figure 123). Increased corrosion rates decreased again in the subsequent measurements with time. Introduction of air holes did not change the corrosion rate.

All control specimens showed steadily decreasing corrosion rates with time as their corrosion potentials moved upward steadily in the more positive direction. Again, formation of passive film on the strand surface was thought to be responsible for the corrosion rate reduction under the mild room temperature environment in every chloride concentration.
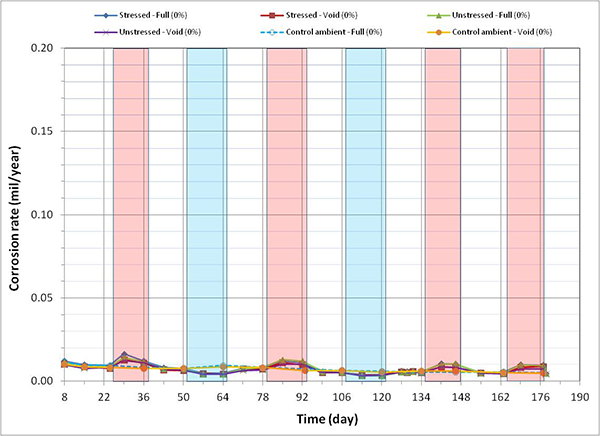
Figure 120. Graph. Corrosion rate versus time for 0 percent chloride single-strand specimens. This graph presents corrosion rate versus time for 0 percent chloride single-strand specimens. Corrosion rate is on the y-axis from 0 to 0.20 mil/year, and time is on the y-axis from 8 to 190 days. Six lines are shown, all at 0 percent chloride: stressed full, unstressed void, stressed void, control ambient full, unstressed full, and control ambient void. Individual hot and humid and freezing and dry cycles are highlighted with red and blue columns, respectively. White columns indicate either initial ambient or ambient cycles. Very low corrosion rate was evident regardless of specimen type and exposure condition.
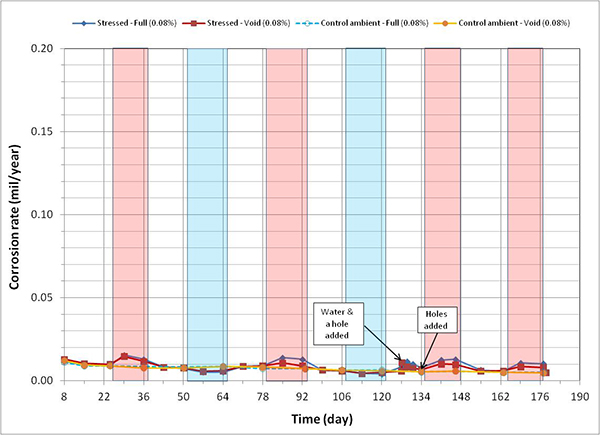
Figure 120. Graph. Corrosion rate versus time for 0 percent chloride single-strand specimens.

Figure 121. Graph. Corrosion rate versus time for 0.08 percent chloride single-strand specimens. This graph presents corrosion rates versus time for 0.08 percent chloride single-strand specimens. Corrosion rate is on the y-axis from 0 to 0.20 mil/year, and time is on the x-axis from 8 to 190 days. Four lines are shown, all at 0.08 percent chloride: stressed full, stressed void, control ambient full, and control ambient void. Individual hot and humid and freezing and dry cycles are highlighted with red and blue columns, respectively. White columns indicate either initial ambient or ambient cycles. A duct hole and water were introduced into the stressed specimen’s void after 129 days of testing, and 4 duct holes were introduced in the control specimen’s void after 134 days of testing. Very low corrosion rate was evident regardless of specimen type and exposure condition.
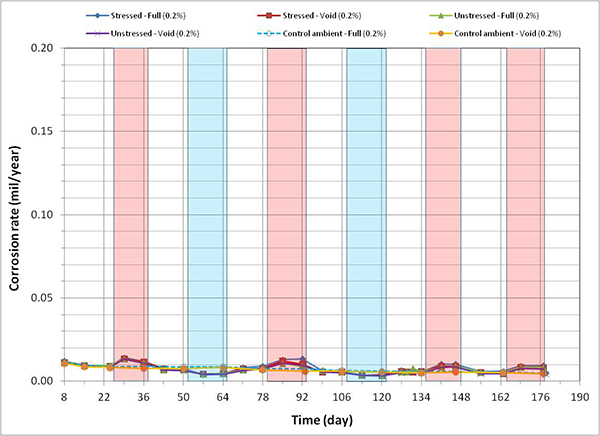
Figure 121. Graph. Corrosion rate versus time for 0.08 percent chloride single-strand specimens.

Figure 122. Graph. Corrosion rate versus time for 0.2 percent chloride single-strand specimens. This graph presents corrosion rates versus time for 0.2 percent chloride single-strand specimens. Corrosion rate is on the y-axis from 0 to 0.20 mil/year, and time is on the x-axis from 8 to 190 days. Six lines are shown, all at 0.2 percent chloride: stressed full, unstressed void, stressed void, control ambient full, unstressed full, and control ambient void. Individual hot and humid and freezing and dry cycles are highlighted with red and blue columns, respectively. White columns indicate either initial ambient or ambient cycles. Very low corrosion rates were evident regardless of specimen type and exposure condition.
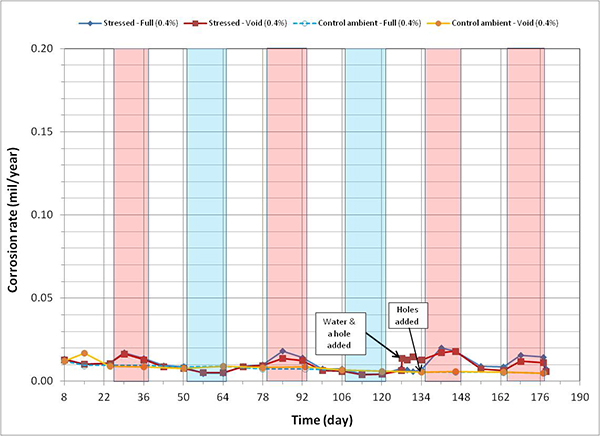
Figure 122. Graph. Corrosion rate versus time for 0.2 percent chloride single-strand specimens.

Figure 123. Graph. Corrosion rate versus time for 0.4 percent chloride single-strand specimens. This graph presents corrosion rates versus time for 0.4 percent chloride single-strand specimens. Corrosion rate is on the y-axis from 0 to 0.20 mil/year, and time is on the x-axis from 8 to 190 days. Four lines are shown, all at 0.4 percent chloride: stressed full, stressed void, control ambient full, and control ambient void. Individual hot and humid (H & H) and freezing and dry (F & D) cycles are highlighted with red and blue columns, respectively. White columns indicate either initial ambient or ambient cycles. A duct hole and water were introduced into the stressed specimen’s void after 129 days of testing, and 4 duct holes were introduced in the control specimen’s void after 134 days of testing. Low corrosion rates were evident regardless of specimen type. The specimens subjected to accelerated corrosion testing experienced higher corrosion rates during the H &H cycles and much lower corrosion rates during the F & D cycles. Intermediate corrosion rates were observed in initial ambient and ambient cycles. All control specimens showed steadily decreasing corrosion rates with time as their corrosion potentials steadily increased.
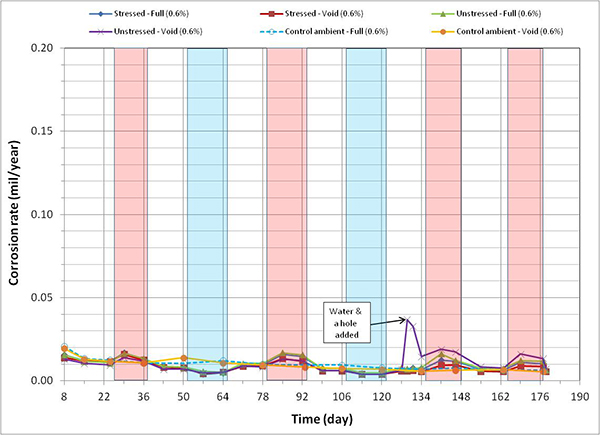
Figure 123. Graph. Corrosion rate versus time for 0.4 percent chloride single-strand specimens.

Figure 124. Graph. Corrosion rate versus time for 0.6 percent chloride single-strand specimens. This graph presents corrosion rate versus time for 0.6 percent chloride single-strand specimens. Corrosion rate is on the y-axis from 0 to 0.20 mil/year, and time is on the x-axis from 8 to 190 days. Six lines are shown, all at 0.6 percent chloride: stressed full, unstressed void, stressed void, control ambient full, unstressed full, and control ambient void. Individual hot and humid (H & H) and freezing and dry (F & D) cycles are highlighted with red and blue columns, respectively. White columns indicate either initial ambient or ambient cycles. A duct hole and water were introduced into the unstressed specimen’s void after 129 days of testing. Low corrosion rate was evident regardless of specimen type. The specimens subjected to the accelerated corrosion testing experienced higher corrosion rates during the H & H cycles and much lower corrosion rates during the F & D cycles. Intermediate corrosion rates were observed in initial ambient and ambient cycles. All control specimens showed steadily decreasing corrosion rates over time as their corrosion potentials steadily increased.
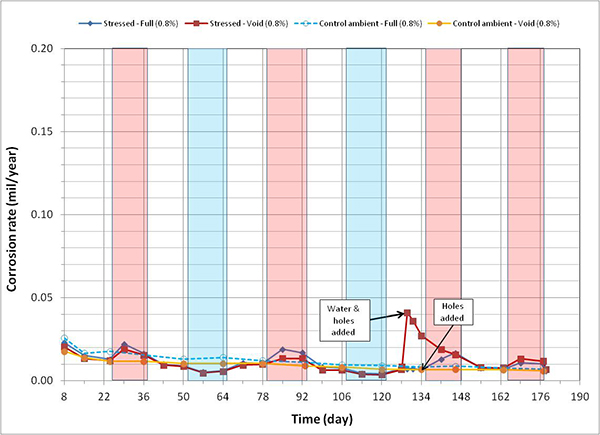
Figure 124. Graph. Corrosion rate versus time for 0.6 percent chloride single-strand specimens.

Figure 125. Graph. Corrosion rate versus time for 0.8 percent chloride single-strand specimens. This graph presents corrosion rate versus time for 0.8 percent chloride single-strand specimens. Corrosion rate is on the y-axis from 0 to 0.20 mil/year, and time is on the x-axis from 8 to 190 days. Four lines are shown, all at 0.8 percent chloride: stressed full, stressed void, control ambient full, and control ambient void. Individual hot and humid (H & H) and freezing and dry (F & D) cycles are highlighted with red and blue columns, respectively. White columns indicate either initial ambient or ambient cycles. A duct hole and water were introduced into the stressed specimen’s void after 129 days of testing, and 4 duct holes were introduced in the control specimen’s void after 134 days of testing. Low corrosion rates were evident regardless of specimen type. The specimens subjected to the accelerated corrosion testing experienced higher corrosion rates during the H & H cycles and much lower corrosion rates during the F & D cycles. Intermediate corrosion rates were observed in initial ambient and ambient cycles. All control specimens showed steadily decreasing corrosion rates with time as their corrosion potentials steadily increased.
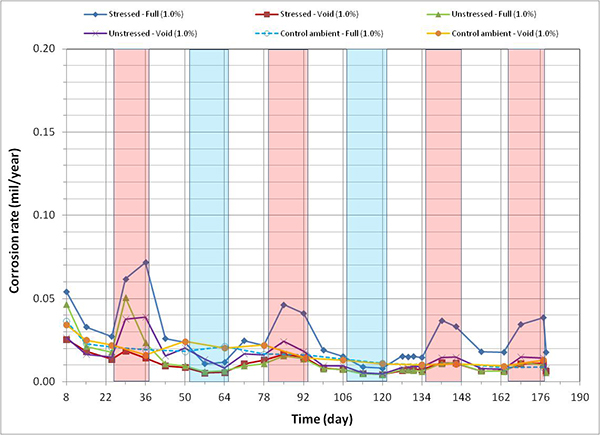
Figure 125. Graph. Corrosion rate versus time for 0.8 percent chloride single-strand specimens.

Figure 126. Graph. Corrosion rate versus time for 1.0 percent chloride single-strand specimens. This graph presents corrosion rate versus time for 1.0 percent chloride single-strand specimens. Corrosion rate is on the y-axis from 0 to 0.20 mil/year, and time is on the x-axis from 8 to 190 days. Six lines are shown, all at 1.0 percent chloride: stressed full, unstressed void, stressed void, control ambient full, unstressed full, and control ambient void. Individual hot and humid (H & H) and freezing and dry (F & D) cycles are highlighted with red and blue columns, respectively. White columns indicate either initial ambient or ambient cycles. Low corrosion rates were evident regardless of specimen type. The specimens subjected to the accelerated corrosion testing experienced higher corrosion rates during the H & H cycles and much lower corrosion rates during the F & D cycles. Intermediate corrosion rates were observed in initial ambient and ambient cycles. All control specimens showed steadily decreasing corrosion rates with time as their corrosion potentials steadily increased.
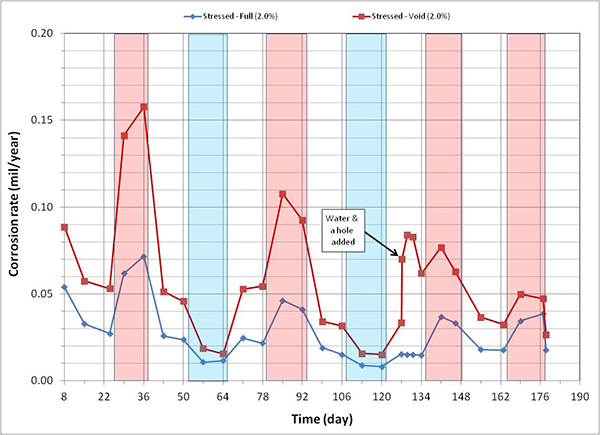
Figure 126. Graph. Corrosion rate versus time for 1.0 percent chloride single-strand specimens.

Figure 127. Graph. Corrosion rate versus time for 2.0 percent chloride single-strand specimens. This graph presents corrosion rate versus time for 2.0 percent chloride single-strand specimens. Corrosion rate is on the y-axis from 0 to 0.20 mil/year, and time is on the x-axis from 8 to 190 days. Two lines are shown, both at 2.0 percent chloride: stressed full and stressed void. Individual hot and humid (H & H) and freezing and dry (F & D) cycles are highlighted with red and blue columns, respectively. White columns indicate either initial ambient or ambient cycles. A duct hole and water were introduced into the stressed specimen’s void after 129 days of testing. Relatively high corrosion rates were evident for both specimens. The specimens subjected to the accelerated corrosion testing experienced higher corrosion rates during the H & H cycles and much lower corrosion rates during the F & D cycles. Intermediate corrosion rates were observed in initial ambient and ambient cycles.
Figure 127. Graph. Corrosion rate versus time for 2.0 percent chloride single-strand specimens.

Fully Grouted Specimens Versus Voided Specimens

Figure 128 through figure 131 summarize mean corrosion rates calculated for the stressed and unstressed strands in fully grouted specimens per chloride concentration in initial ambient, ambient, H & H, and F & D cycles, respectively. The data for control specimens were also included in initial ambient and ambient plots. Similar plots for voided specimens are presented in figure 132 through figure 135. In each exposure condition, mean corrosion rates per chloride concentration were grouped by stress versus no stress. Because water was added to some of the voided specimens after initial ambient and F & D cycles were completed, mean corrosion rate data related to post-water recharging event are presented in figure 133 (ambient) and figure 134 (H & H) only.

To maintain the same scale in each plot, maximum corrosion rate was set at 0.2 mil/year, close to the highest corrosion rate reported in figure 127. As a result, it is hard to see subtle differences among different sets of corrosion rate data. There were no clear trends observed by stress level and presence of void except that voided specimens exhibited increased mean corrosion rates upon water recharging, and this trend is more pronounced at higher chloride concentrations as shown in figure 133 and figure 134. The effect of drilling air holes on corrosion rate was not observed.
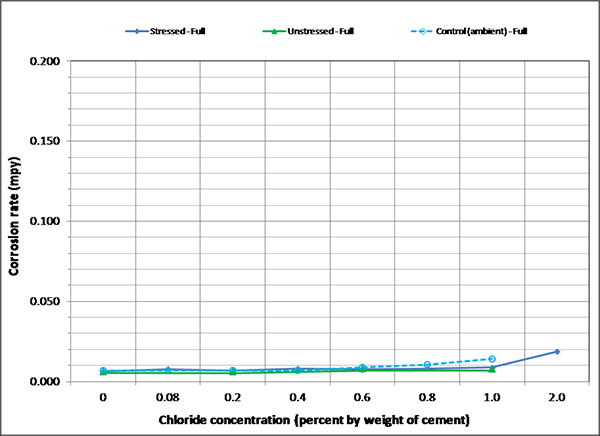
Figure 128. Graph. Mean corrosion rate of fully grouted single-strand specimens in initial ambient condition. This graph shows mean corrosion rate for stressed and unstressed strands in fully grouted single-strand specimens per chloride concentration in initial ambient condition. Corrosion rate is on the y-axis from 0 to 0.20 mil/year, and chloride concentration is on the x-axis from 0 to 2.0 percent by weight of cement. Three lines are shown: stressed full, unstressed full, and control (ambient) full. The data indicate very low mean corrosion rates for all three lines.
Figure 128. Graph. Mean corrosion rate of fully grouted single-strand specimens in initial ambient condition.

Figure 129. Graph. Mean corrosion rate of fully grouted single-strand specimens in ambient condition. This graph shows mean corrosion rate for stressed and unstressed strands in fully grouted single-strand specimens per chloride concentration in ambient condition. Corrosion rate is on the y-axis from 0 to 0.20 mil/year, and chloride concentration is on the x-axis from 0 to 2.0 percent by weight of cement. Three lines are shown: stressed full, unstressed full, and control (ambient) full. The data indicate very low mean corrosion rates.
Figure 129. Graph. Mean corrosion rate of fully grouted single-strand specimens in ambient condition.
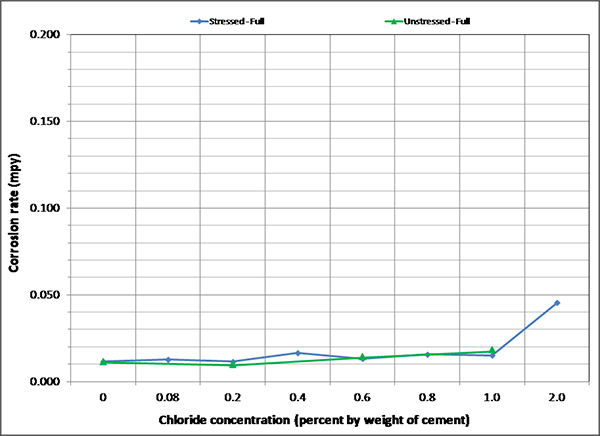
Figure 130. Graph. Mean corrosion rate of fully grouted single-strand specimens in H & H condition. This graph shows mean corrosion rate for stressed and unstressed strands in fully grouted single-strand specimens per chloride concentration in the hot and humid (H & H) condition. Corrosion rate is on the y-axis from 0 to 0.20 mil/year, and chloride concentration is on the x-axis from 0 to 2.0 percent by weight of cement. Two lines are shown: stressed full and unstressed full. The data indicate low mean corrosion rates except for the fully stressed specimen at 2.0 percent chloride.
Figure 130. Graph. Mean corrosion rate of fully grouted single-strand specimens in H & H condition.
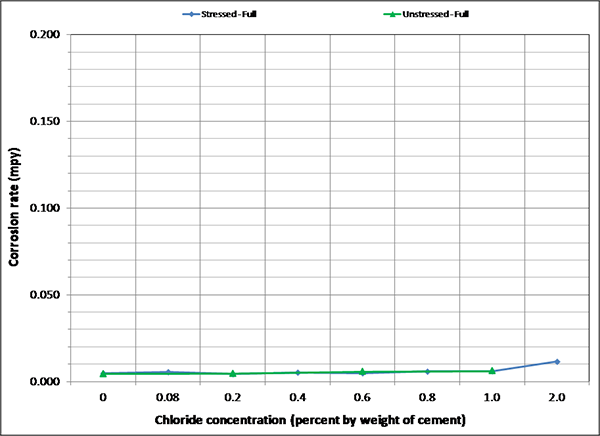
Figure 131. Graph. Mean corrosion rate of fully grouted single-strand specimens in F & D condition. This graph shows mean corrosion rate for stressed and unstressed strands in fully grouted single-strand specimens per chloride concentration in the freezing and dry (F & D) condition. Corrosion rate is on the y-axis from 0 to 0.20 mil/year, and chloride concentration is on the x-axis from 0 to 2.0 percent by weight of cement. Two lines are shown: stressed full and unstressed full. The data indicate negligible mean corrosion rates regardless of chloride concentration.
Figure 131. Graph. Mean corrosion rate of fully grouted single-strand specimens in F & D condition.
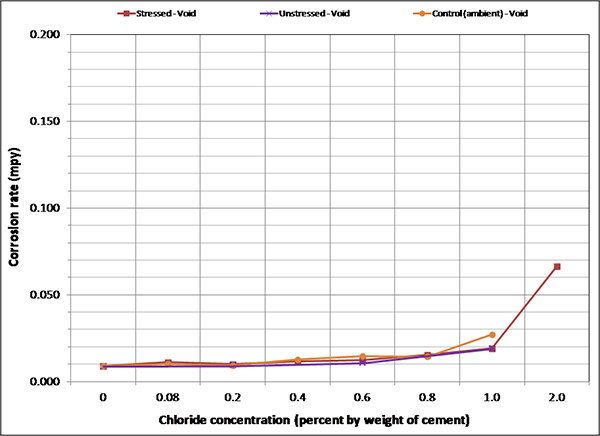
Figure 132. Graph. Mean corrosion rate of voided single-strand specimens in initial ambient condition. This graph shows mean corrosion rate for stressed and unstressed strands in the voided single-strand specimens per chloride concentration in initial ambient condition. Corrosion rate is on the y-axis from 0 to 0.20 mil/year, and chloride concentration is on the x-axis from 0 to 2.0 percent by weight of cement. Three lines are shown: stressed void, unstressed void, and control (ambient) void. The data indicate very low mean corrosion rates except for the voided control specimen at 2.0 percent chloride.
Figure 132. Graph. Mean corrosion rate of voided single-strand specimens in initial ambient condition.
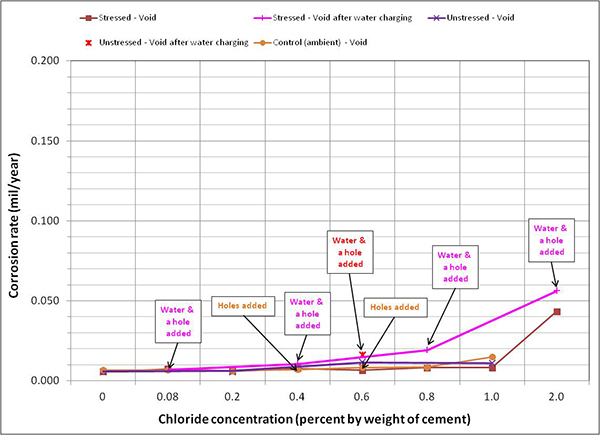
Figure 133. Graph. Mean corrosion rate of voided single-strand specimens in ambient condition. This graph shows mean corrosion rate for stressed and unstressed strands in the voided single-strand specimens per chloride concentration in ambient condition. Corrosion rate is on the y-axis from 0 to 0.20 mil/year, and chloride concentration is on the x-axis from 0 to 2.0 percent by weight of cement. Five types of data are shown: stressed void, stressed void after water charging, unstressed void, unstressed void after water charging, and control (ambient) void. The data related to water and water and holes are also presented. The data indicate very low mean corrosion rates except for the voided and stressed specimen after water charging and the voided and stressed specimen at 2.0 percent chloride.
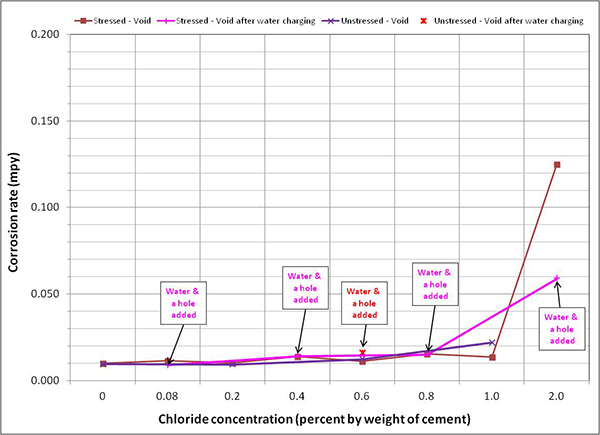
Figure 133. Graph. Mean corrosion rate of voided single-strand specimens in ambient condition.

Figure 134. Graph. Mean corrosion rate of voided single-strand specimens in H & H condition. This graph shows mean corrosion rate for stressed and unstressed strands in the voided single-strand specimens per chloride concentration in the hot and humid (H & H) condition. Corrosion rate is on the y-axis from 0 to 0.20 mil/year, and chloride concentration is on the x-axis from 0 to 2.0 percent by weight of cement. Four types of data are shown: stressed void, stressed void after water charging, unstressed void, and unstressed void after water charging. Data related to water and water and holes being added are also presented. The data indicate low mean corrosion rates except for voided and stressed and voided and stressed after water charging specimens at 2.0 percent chloride.
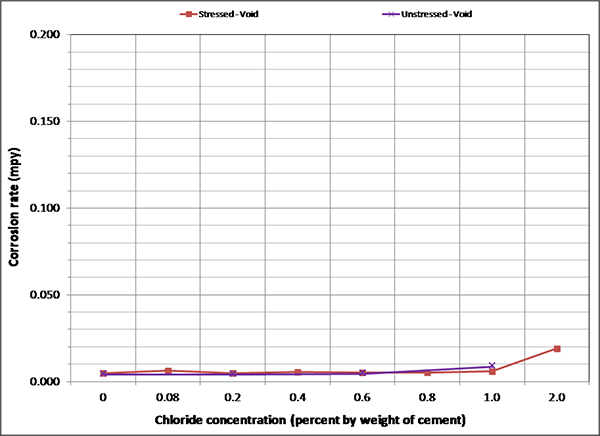
Figure 134. Graph. Mean corrosion rate of voided single-strand specimens in H & H condition.

Figure 135. Graph. Mean corrosion rate of voided single-strand specimens in F & D condition. This graph shows mean corrosion rate for stressed and unstressed strands in the voided single-strand specimens per chloride concentration in the freezing and dry (F & D) condition. Corrosion rate is on the y-axis from 0 to 0.20 mil/year, and chloride concentration is on the x-axis from 0 to 2.0 percent by weight of cement. Two lines are shown: stressed voided and unstressed voided. The data indicate negligible mean corrosion rates regardless
Figure 135. Graph. Mean corrosion rate of voided single-strand specimens in F & D condition.

Figure 136 through figure 141 present enlarged portions of mean corrosion rate plots related to initial ambient (see figure 128 and figure 132), ambient (see figure 129 and figure 133), and H & H (see figure 130 and figure 134) conditions. Since corrosion activity diminished in the F & D condition, their data were not included in figure 136 through figure 141. The plots in figure 136, figure 138, and figure 140 contain mean corrosion rate data of fully grouted specimens, and the plots in figure 137, figure 139, and figure 141 contain the same data for voided specimens. To capture subtle trends for undisturbed conditions, corrosion rate data after water recharging were removed from the original plots, and the maximum scale for the plots was set at 0.03 mil/year. Because the key point of the plots was to understand corrosion rate behaviors corresponding to chloride concentrations between 0 and 0.8 percent, losing some of the 2.0 percent chloride specimen data in the enlarged plots was accepted. Two more enlarged plots are presented in figure 142 and figure 143. The former is related to overall mean corrosion rates per chloride concentration, and the latter is related to mean corrosion rates grouped by stress level per chloride concentration. Careful examination of figure 136 through figure 143 leads to the following findings:
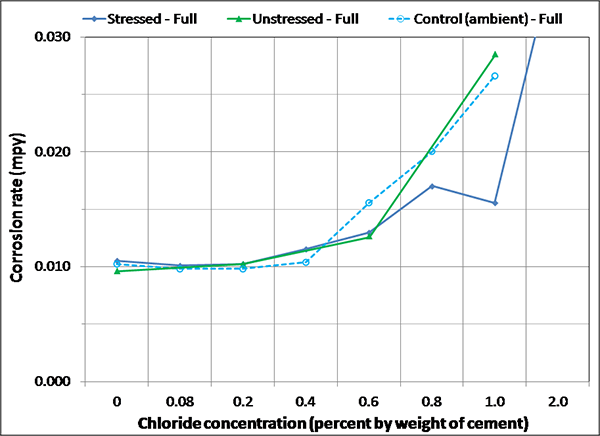
Figure 136. Graph. Magnified corrosion rate for initial ambient condition of fully grouted specimens. This graph shows a magnified view of the corrosion rate for the initial ambient condition of fully grouted specimens. Corrosion rate is on the y-axis from 0 to 0.03 mil/year, and chloride concentration is on the x-axis from 0 to 2.0 percent by weight of cement. Three lines are shown: stressed full, unstressed full, and control (ambient) full. The stressed and unstressed strands embedded in full grout show a corrosion rate higher than 0.01 mil/year from 0.4 percent chloride. This trend is more pronounced with higher chloride concentrations. The control strand embedded in full grout shows the same trend from 0.6 percent chloride.
Figure 136. Graph. Magnified corrosion rate for initial ambient condition of fully grouted specimens.
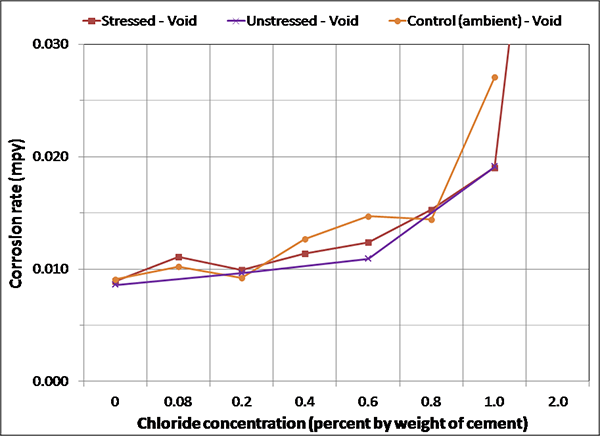
Figure 137. Graph. Magnified corrosion rate for initial ambient condition of voided specimens. This graph shows a magnified view of corrosion rate for initial ambient condition of voided specimens. Corrosion rate is on the y-axis from 0 to 0.03 mil/year, and chloride concentration is on the x-axis from 0 to 2.0 percent by weight of cement. Three lines are shown: stressed void, unstressed void, and control (ambient) void. The stressed, unstressed, and control strands embedded in voided grout exhibit a corrosion rate slightly lower than 0.01 mil/year at 0 percent chloride. The corrosion rate increases with higher chloride concentrations.
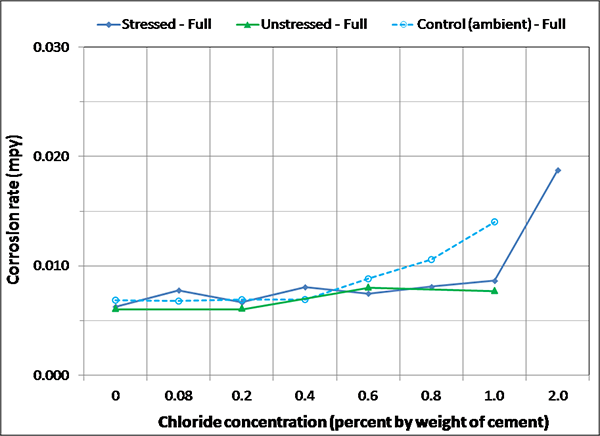
Figure 137. Graph. Magnified corrosion rate for initial ambient condition of voided specimens.

Figure 138. Graph. Magnified corrosion rate for ambient condition of fully grouted specimens. This graph shows a magnified view of corrosion rate for ambient condition of fully grouted specimens. Corrosion rate is on the y-axis from 0 to 0.03 mil/year, and chloride concentration is on the x-axis from 0 to 2.0 percent by weight of cement. Three lines are shown: stressed full, unstressed full, and control (ambient) full. The stressed, unstressed, and control strands embedded in full grout exhibit a corrosion rate slightly higher than 0.005 mil/year at 0 to 0.2 percent chloride, The corrosion rate increases with higher chloride concentration. This trend is more pronounced for the control strand exposed to 0.8 and 1.0 percent chloride.
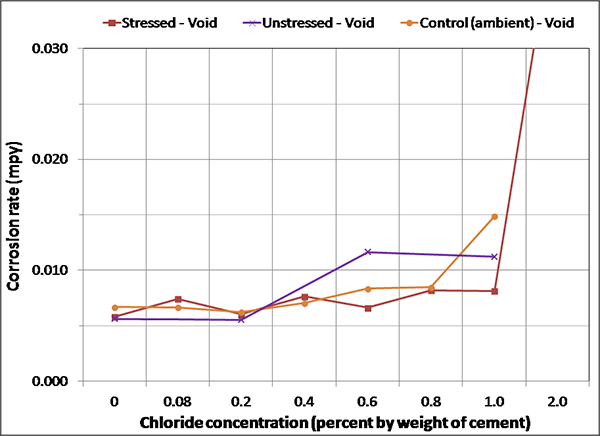
Figure 138. Graph. Magnified corrosion rate for ambient condition of fully grouted specimens.

Figure 139. Graph. Magnified corrosion rate for ambient condition of voided specimens. This graph shows a magnified view of corrosion rate for ambient condition of fully grouted specimens. Corrosion rate is on the y-axis from 0 to 0.03 mil/year, and chloride concentration is on the x-axis from 0 to 2.0 percent by weight of cement. Three lines are shown: stressed void, unstressed void, and control (ambient) void. The stressed, unstressed, and control strands embedded in the voided grout exhibit a corrosion rate slightly higher than 0.005 mil/year at 0 to 0.2 percent chloride. The corrosion rate increases with higher chloride concentrations. This trend is more pronounced for those exposed to 1.0 and 
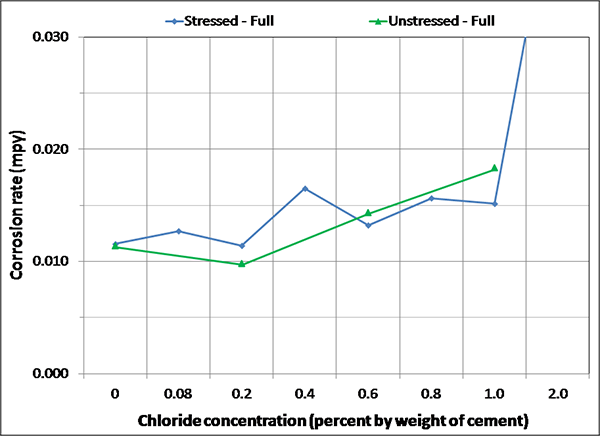
2.0 percent chloride.
Figure 139. Graph. Magnified corrosion rate for ambient condition of voided specimens.

Figure 140. Graph. Magnified corrosion rate for H & H condition of fully grouted specimens. This graph shows a magnified view of corrosion rate for the hot and humid (H & H) condition of fully grouted specimens. Corrosion rate is on the y-axis from 0 to 0.03 mil/year, and chloride concentration is on the x-axis from 0 to 2.0 percent by weight of cement. Three lines are shown: stressed full, unstressed full, and control (ambient) full. The stressed and unstressed strands embedded in full grout exhibit a corrosion rate slightly higher than 0.010 mil/year at 0 to 0.2 percent chloride. The corrosion rate increases with higher chloride concentrations.
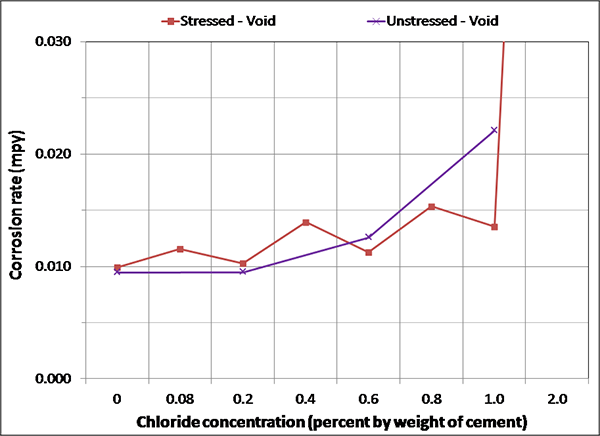
Figure 140. Graph. Magnified corrosion rate for H & H condition of fully grouted specimens.

Figure 141. Graph. Magnified corrosion rate for H & H condition of voided specimens. This graph shows a magnified view of corrosion rate for the hot and humid (H & H) condition of voided specimens. Corrosion rate is on the y-axis from 0 to 0.03 mil/year, and chloride concentration is on the x-axis from 0 to 2.0 percent by weight of cement. Three lines are shown: stressed void, unstressed void, and control (ambient) void. The stressed and unstressed strands embedded in the voided grout exhibit a corrosion rate around 0.010 mil/year at 0 to 0.2 percent chloride. The corrosion rate increases with higher chloride concentrations.
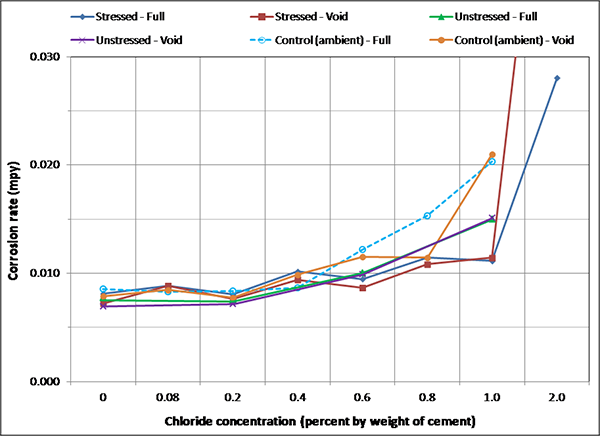
Figure 141. Graph. Magnified corrosion rate for H & H condition of voided specimens.

Figure 142. Graph. Overall mean corrosion rates of single-strand specimens. This graph shows overall mean corrosion rates of single-strand specimens per chloride concentration. Corrosion rate is on the y-axis from 0 to 0.03 mil/year, and chloride concentration is on the x-axis from 0 to 2.0 percent by weight of cement. Six lines are shown: stressed full, unstressed void, stressed void, control (ambient) full, unstressed full, and control (ambient) void. Mean corrosion rates of 0, 0.08, and 0.2 percent specimens are nearly the same. They are thought to be in sound passive state. At 0.4 percent chloride concentration, mean corrosion rates started to increase.
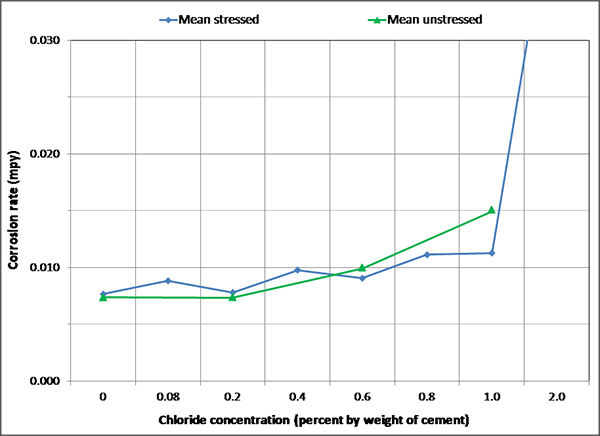
Figure 142. Graph. Overall mean corrosion rates of single-strand specimens.

Figure 143. Graph. Overall mean corrosion rates of single-strand specimens grouped by stress level. This graph shows overall mean corrosion rates of single-strand specimens grouped by stress level. Corrosion rate is on the y-axis from 0 to 0.03 mil/year, and chloride concentration is on the x-axis from 0 to 2.0 percent by weight of cement. Two lines are shown: mean stressed and mean unstressed. There was no discernible difference between stressed and unstressed specimens.
Figure 143. Graph. Overall mean corrosion rates of single-strand specimens grouped by stress level.

Task 2.3: Corrosion Current Density and Driving Voltage Data of Multi-Strand Specimens

Figure 144 through figure 151 present macro-cell corrosion current density (imacro-cell) data and the corresponding driving voltage data versus time plots for multi-strand specimens. The driving voltage is the difference of corrosion potentials between macro-anode and macro-cathode. The magnitude of imacro-cell increases proportionally to that of driving voltage. Figure 144 through figure 146 show a small driving voltage (nearly zero macro-cell corrosion current density relationship (i.e., less than 50 mV and less than 0.01 µA/cm2)) for 0, 0.08, and 0.2 percent chloride specimens. Figure 149 and figure 150 provide examples of a large driving voltage (substantial macro-cell corrosion current density relationship (i.e., over 100 mV and 0.10 µA/cm2)) for 0.8 and 1.0 percent specimens. The relationships are particularly pronounced during the H & H cycles. As discussed previously in conjunction with figure 115, the 2.0 percent chloride specimen data shown in figure 151 indicated that unstressed strands were already corroding in the highest chloride contaminated grout mix. This situation resulted in reduction of driving voltage between macro-anode and macro-cathode. Such a reduced driving voltage attributed to the gradual reduction of imacro-cell to nearly zero and even a small current reversal at the end of testing.
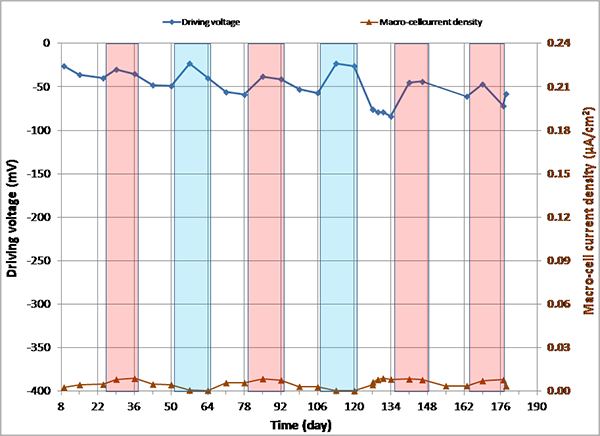
Figure 144. Graph. imacro-cell and driving voltage versus time for 0 percent chloride multi-strand specimen. This graph presents macro-cell corrosion current density (imacro-cell) data and the corresponding driving voltage data versus time for 0 percent chloride multi-strand specimens. Driving voltage is on the left y-axis from -400 to 0 mV, macro-cell current density is on the right y-axis from 0 to 0.24 micro-A/cm2, and time is on the x-axis from 8 to 190 days. Two lines are shown: driving voltage and macro-cell current density. Individual hot and humid and freezing and dry cycles are highlighted with red and blue columns, respectively. White columns indicate either initial ambient or ambient cycles. The plot shows a small driving voltage. There was a small macro-cell corrosion current density relationship (less than 50 mV and less than 0.01 micro-A/cm2).
Figure 144. Graph. imacro-cell and driving voltage versus time for 0 percent chloride multi-strand specimen.
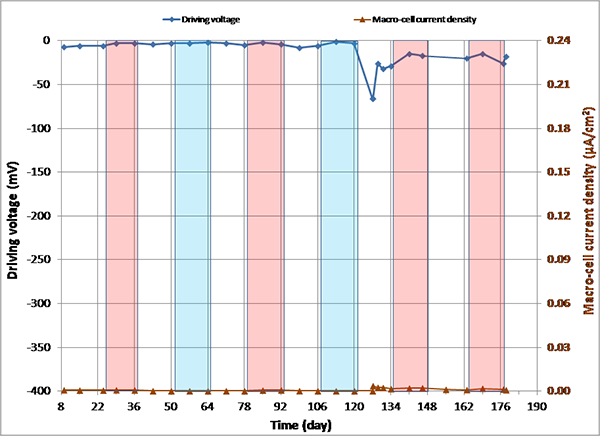
Figure 145. Graph. imacro-cell and driving voltage versus time for 0.08 percent chloride multi-strand specimen. This graph presents macro-cell corrosion current density (imacro-cell) data and the corresponding driving voltage data versus time for 0.08 percent chloride multi-strand specimens. Driving voltage is on the left y-axis from -400 to 0 mV, macro-cell current density is on the right y-axis from 0 to 0.24 micro-A/cm2, and time is on the x-axis from 8 to 190 days. Two lines are shown: driving voltage and macro-cell current density. Individual hot and humid and freezing and dry cycles are highlighted with red and blue columns, respectively. White columns indicate either initial ambient or ambient cycles. The plot shows a small driving voltage. There was a small macro-cell corrosion current density relationship (less than 50 mV and less than 0.01 micro-A/cm2).
Figure 145. Graph. imacro-cell and driving voltage versus time for 0.08 percent chloride multi-strand specimen.
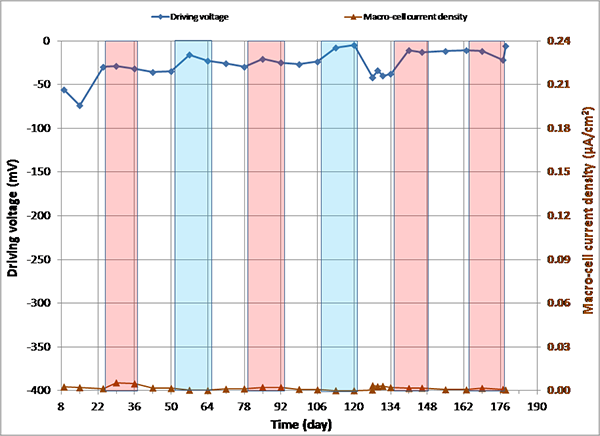
Figure 146. Graph. imacro-cell and driving voltage versus time for 0.2 percent chloride multi-strand specimen. This graph presents macro-cell corrosion current density (imacro-cell) data and the corresponding driving voltage data versus time for 0.2 percent chloride multi-strand specimens. Driving voltage is on the left y-axis from -400 to 0 mV, macro-cell current density is on the right y-axis from 0 to 0.24 micro-A/cm2, and time is on the x-axis from 8 to 190 days. Two lines are shown: driving voltage and macro-cell current density. Individual hot and humid and freezing and dry cycles are highlighted with red and blue columns, respectively. White columns indicate either initial ambient or ambient cycles. The plot shows a small driving voltage. There was a small macro-cell corrosion current density relationship (less than 50 mV and less than 0.01 micro-A/cm2).
Figure 146. Graph. imacro-cell and driving voltage versus time for 0.2 percent chloride multi-strand specimen.

Figure 147. Graph. imacro-cell and driving voltage versus time for 0.4 percent chloride    multi-strand specimen. This graph presents macro-cell corrosion current density (imacro-cell) data and the corresponding driving voltage data versus time for 0.4 percent chloride multi-strand specimens. Driving voltage is on the left y-axis from -400 to 0 mV, macro-cell current density is on the right y-axis from 0 to 0.24 micro-A/cm2, and time is on the x-axis from 8 to 190 days. Two lines are shown: driving voltage and macro-cell current density. Individual hot and humid (H & H) and freezing and dry cycles are highlighted with red and blue columns, respectively. White columns indicate either initial ambient or ambient cycles. The plot shows slightly increasing driving voltage and macro-cell corrosion current density relationship (between 50 and 100 mV and less than 0.03 micro-A/cm2), which was particularly pronounced during the H & H cycles.
Figure 147. Graph. imacro-cell and driving voltage versus time for 0.4 percent chloride multi-strand specimen.
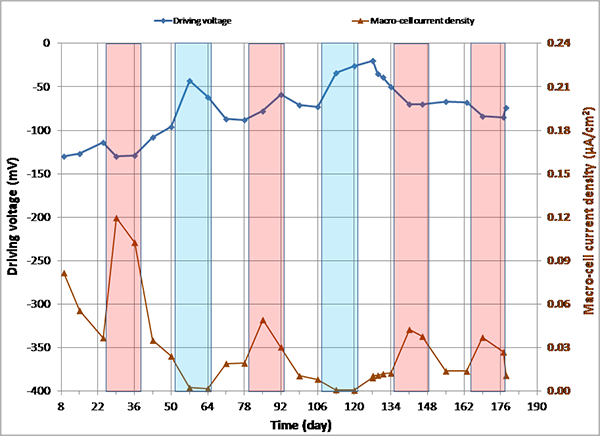
Figure 148. Graph. imacro-cell and driving voltage versus time for 0.6 percent chloride    multi-strand specimen. This graph presents macro-cell corrosion current density (imacro-cell) data and the corresponding driving voltage data versus time for 0.6 percent chloride multi-strand specimens. Driving voltage is on the left y-axis from -400 to 0 mV, macro-cell current density is on the right y-axis from 0 to 0.24 micro-A/cm2, and time is on the x-axis from 8 to 190 days. Two lines are shown: driving voltage and macro-cell current density. Individual hot and humid (H & H) and freezing and dry cycles are highlighted with red and blue columns, respectively. White columns indicate either initial ambient or ambient cycles. The plot shows moderately increasing driving voltage and macro-cell corrosion current density relationship (around 100 mV and 0.06 micro-A/cm2), which was particularly pronounced during the H & H cycles
Figure 148. Graph. imacro-cell and driving voltage versus time for 0.6 percent chloride multi-strand specimen.
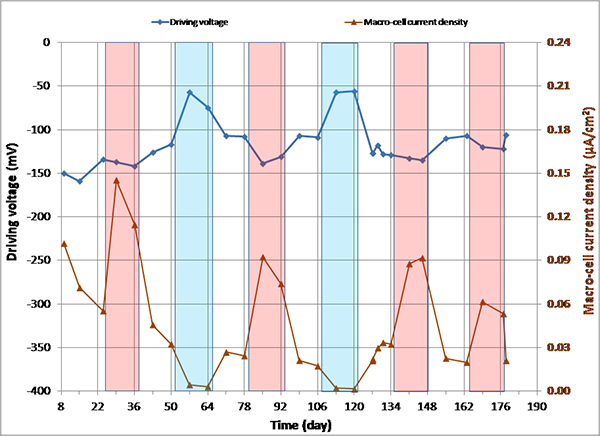
Figure 149. Graph. imacro-cell and driving voltage versus time for 0.8 percent chloride  multi-strand specimen. This graph presents macro-cell corrosion current density (imacro-cell) data and the corresponding driving voltage data versus time for 0.8 percent chloride multi-strand specimens. Driving voltage is on the left y-axis from -400 to 0 mV, macro-cell current density is on the right y-axis from 0 to 0.24 micro-A/cm2, and time is on the x-axis from 8 to 190 days. Two lines are shown: driving voltage and macro-cell current density. Individual hot and humid (H & H) and freezing and dry cycles are highlighted with red and blue columns, respectively. White columns indicate either initial ambient or ambient cycles. The plot shows a large driving voltage. A substantial macro-cell corrosion current density relationship (over 100 mV and 0.10 micro-A/cm2) was particularly pronounced during the H & H cycles.
Figure 149. Graph. imacro-cell and driving voltage versus time for 0.8 percent chloride multi-strand specimen.
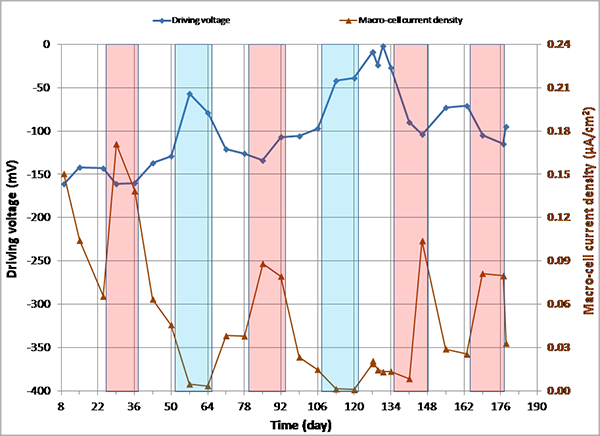
Figure 150. Graph. imacro-cell and driving voltage versus time for 1.0 percent chloride multi-strand specimen. This graph presents macro-cell corrosion current density (imacro-cell) data and the corresponding driving voltage data versus time for 1.0 percent chloride multi-strand specimens. Driving voltage is on the left y-axis from -400 to 0 mV, macro-cell current density is on the right y-axis from 0 to 0.24 micro-A/cm2, and time is on the x-axis from 8 to 190 days. Two lines are shown: driving voltage and macro-cell current density. Individual hot and humid (H & H) and freezing and dry cycles are highlighted with red and blue columns, respectively. White columns indicate either initial ambient or ambient cycles. The plot shows a large driving voltage. There was a substantial macro-cell corrosion current density relationship (over 100 mV and 0.10 micro-A/cm2), which was particularly pronounced during the H & H cycles.
Figure 150. Graph. imacro-cell and driving voltage versus time for 1.0 percent chloride multi-strand specimen.
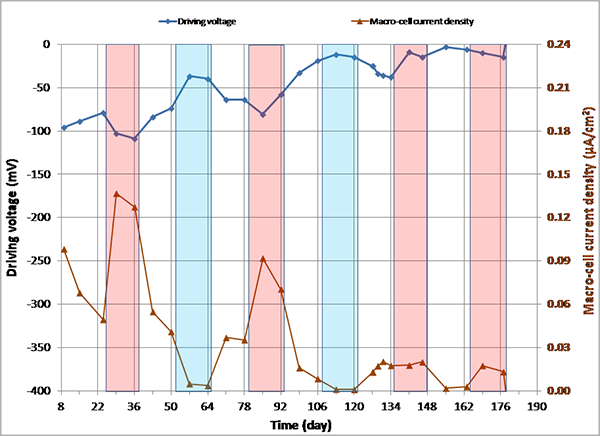
Figure 151. Graph. imacro-cell and driving voltage versus time for 2.0 percent chloride multi-strand specimen. This graph presents macro-cell corrosion current density (imacro-cell) data and the corresponding driving voltage data versus time for 2.0 percent chloride multi-strand specimens. Driving voltage is on the left y-axis from -400 to 0 mV, macro-cell current density is on the right y-axis from 0 to 0.24 micro-A/cm2, and time is on the x-axis from 8 to 190 days. Two lines are shown: driving voltage and macro-cell current density. Individual hot and humid and freezing and dry cycles are highlighted with red and blue columns, respectively. White columns indicate either initial ambient or ambient cycles. The plot indicates that unstressed strands were already corroding and resulted in reduction of driving voltage between the macro-anode and the macro-cathode. Consequently, the shrinking driving voltage attributed to the gradual reduction of imacro-cell to nearly 0 mV as well as a small current reversal at the end.
Figure 151. Graph. imacro-cell and driving voltage versus time for 2.0 percent chloride multi-strand specimen.

Figure 152 presents mean imacro-cell data grouped by exposure condition for each chloride concentration. It is clear that imacro-cell started to increase substantially once chloride concentration exceeded 0.4 percent. The H & H cycles produced the highest mean imacro-cell at all chloride concentrations in different environmental conditions: mean imacro-cell increased almost linearly as a function of chloride concentration up to 1.0 percent. In contrast, the lowest mean imacro-cell data were obtained during the F & D cycles independent of chloride concentration. Mean imacro-cell was also somewhat insensitive to chloride concentration under ambient exposure condition. Water recharging did not increase imacro-cell under the H & H and ambient cycles. Figure 153 summarizes overall mean imacro-cell data as a function of chloride concentration. It can be seen again that recognizable corrosion accompanied by imacro-cell over 0.010 µA/cm2 began at 0.4 percent chloride.

Figure 154 shows the compiled imacro-cell changes as a function of time and temperature. Actual temperature recording data were overlapped in the figure to show that imacro-cell increased during the H & H cycles and decreased during the F & D cycles. The specimens containing more than 0.4 percent chloride concentration exhibited much higher imacro-cell than those containing lesser chloride. However, the differences gradually decreased with time. As discussed before, the specimen containing 2.0 percent chloride exhibited less imacro-cell than ones with 0.8 and 1.0 percent chloride due to the corroding macro-cathode. Figure 155 shows an enlarged section of the imacro-cell plot in figure 154, which shows the imacro-cell data before and after charging 5.1 fl oz of distilled water in the voids. Even though the 0.8 percent chloride specimen responded with increased imacro-cell upon water entry, the effect of water recharging was not considered significant compared to the data shown in figure 56. Some possible reasons for not being able to observe similar current surges in the present study include the following:
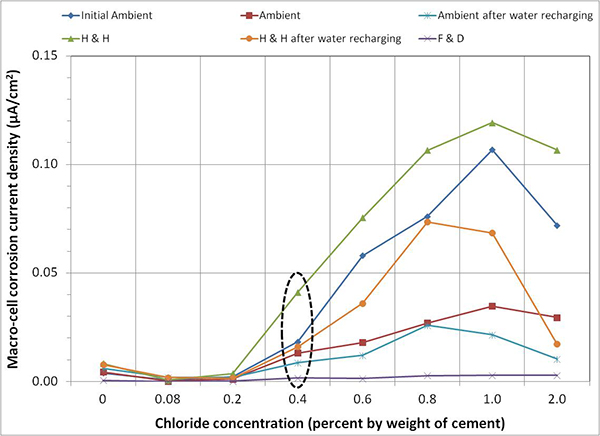
It is recommended to conduct follow-up tests by varying frequency of water recharging and type and volume of water used in the voids.

Figure 152. Graph. Mean imacro-cell data of multi-strand specimens by exposure condition. This graph shows mean macro-cell corrosion current density (imacro-cell) data of multi-strand specimens grouped by exposure condition for each chloride concentration. Macro-cell corrosion current density is on the y-axis from 0 to 0.15 micro-A/cm2, and chloride concentration is on the x-axis from 0 to 2.0 percent by weight of cement. Six lines are shown: initial ambient, hot and humid (H & H), ambient, H & H after water recharging, ambient after water recharging, and freezing and dry (F & D). imacro-cell started to increase substantially once chloride concentration exceeded 0.4 percent. The H & H cycles produced the highest mean imacro-cell at all chloride concentrations. In contrast, the lowest mean imacro-cell data were obtained during the F & D cycles independent of chloride concentration. Mean imacro-cell was somewhat insensitive to chloride concentration under ambient exposure condition. Water recharging did not increase imacro-cell under the H & H and ambient cycles.
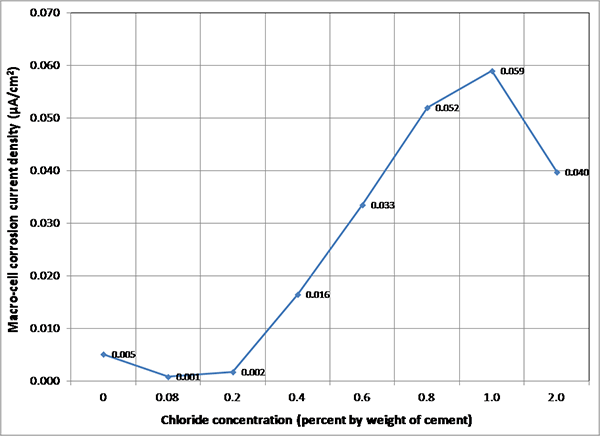
Figure 152. Graph. Mean imacro-cell data of multi-strand specimens by exposure condition.

Figure 153. Graph. Overall mean imacro-cell data of multi-strand specimens. This graph shows overall mean macro-cell corrosion current density (imacro-cell) data as a function of chloride concentration for multi-strand specimens. Macro-cell corrosion current density is on the y-axis from 0 to 0.070 micro-A/cm2, and chloride concentration is on the x-axis from 0 to 2.0 percent by weight of cement. The recognizable corrosion over 0.010 micro-A/cm2 began at 0.4 percent chloride.
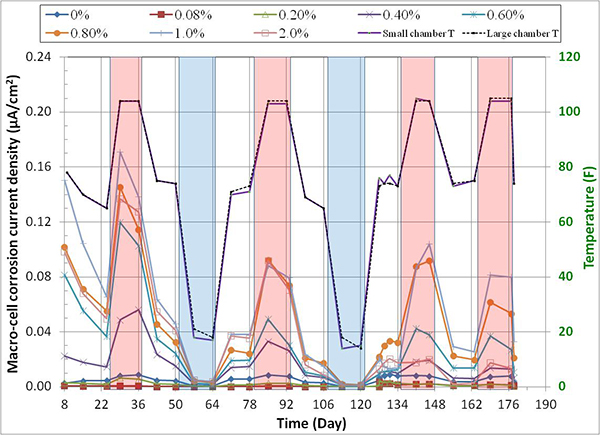
Figure 153. Graph. Overall mean imacro-cell data of multi-strand specimens.

Figure 154. Graph. imacro-cell behavior responding to temperature variation. This graph shows the compiled macro-cell corrosion current density (imacro-cell) changes as a function of time and temperature. Macro-cell corrosion current density is on the left y-axis from 0 to 0.24 micro-A/cm2, temperature is on the right y-axis from 0 to 120 °F, and time is on the x-axis from 8 to 190 days. Ten lines are shown: 0 percent chloride, 0.08 percent chloride, 0.40 percent chloride, 0.60 percent chloride, 0.80 percent chloride, 1.0 percent chloride, 2.0 percent chloride, small chamber temperature, and large chamber temperature. Individual hot and humid (H & H) and freezing and dry (F & D) cycles are highlighted with red and blue columns, respectively. White columns indicate either initial ambient or ambient cycles. Actual temperature recording data were overlapped in the figure to show that imacro-cell increased during the H & H cycles and decreased during the F & D cycles. The specimens containing more than 0.4 percent chloride concentration exhibited much higher imacro-cell than those containing lesser chloride. However, the differences gradually decreased with time.
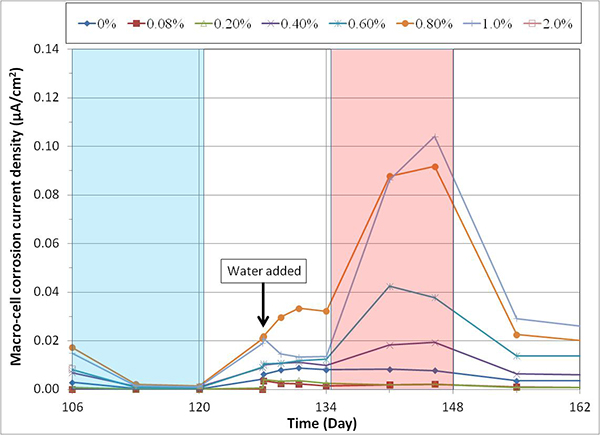
Figure 154. Graph. imacro-cell behavior responding to temperature variation.

Figure 155. Graph. imacro-cell changes after water recharging. This graph shows an enlarged section of the macro-cell corrosion current density (imacro-cell) plot shown in figure 154, which shows the imacro-cell data before and after charging 5.1 fl oz of distilled water in the voids. Macro-cell corrosion current density is on the y-axis from 0 to 0.14 micro-A/cm2, and time is on the x-axis from 106 to 162 days. Ten lines are shown: 0 percent chloride, 0.08 percent chloride, 0.40 percent chloride, 0.60 percent chloride, 0.80 percent chloride, 1.0 percent chloride, 2.0 percent chloride, small chamber temperature, and large chamber temperature. Individual hot and humid and freezing and dry cycles are highlighted with red and blue columns, respectively. White columns indicate either initial ambient or ambient cycles. Water was added around day 126. It can be seen that the 
0.8 percent chloride specimen responded the most with increased imacro-cell upon water entry.
Figure 155. Graph. imacro-cell changes after water recharging.

Figure 156 through figure 163 show stressed strands in the voids. The photographs were taken 1 week after recharging water was added to the voids. It was observed even during early days of testing that three specimens containing 0 percent chloride (see figure 156), 0.4 percent chloride (see figure 159), and 2.0 percent chloride (see figure 163) showed black deposit on the void/grout interface where stressed strands passed through. The unknown deposit material is indicated with arrows in the figures. The specimens covered with the deposit layer also appeared to hold water longer than specimens without it. This mysterious layer turned out to be important, as the autopsy revealed that some strands in contact with the deposit layer suffered from severe corrosion. Three wires of 0.4 percent chloride specimen and one wire of 2.0 percent chloride specimen were corroded in two during the 6-month accelerated corrosion testing. The 0 percent chloride specimen had severely corroded strands at the interface during the same period. The other specimens showed only minor corrosion on the stressed strands near the interface. The encountered excessive corrosion problem was never expected. Consequently, data analysis became complicated as to what to include and what to exclude among the weekly collected electrochemical data.
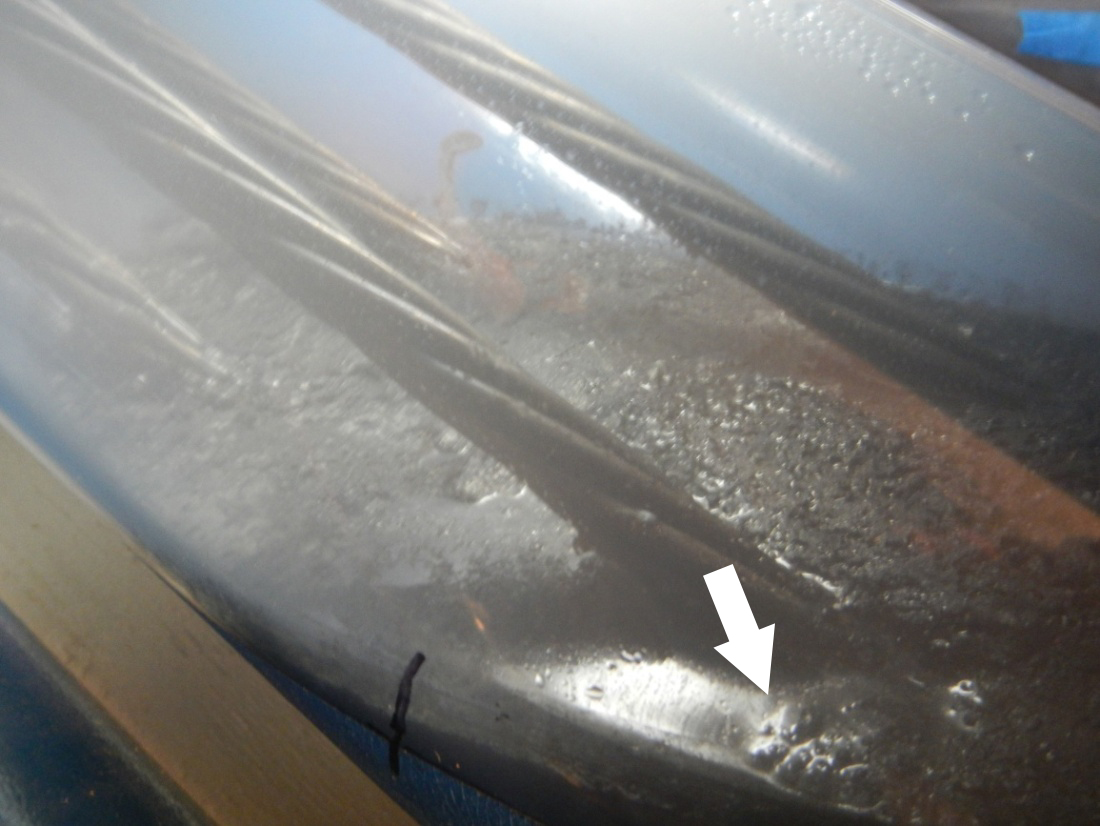
Figure 156. Photo. Void condition of 0 percent chloride specimen. This photo shows stressed strands in the void of 0 percent chloride multi-strand specimen 1 week after recharging water was added to the void. Black deposit is visible on the void/grout interface where stressed strands passed through. A white arrow points to unknown deposit material.
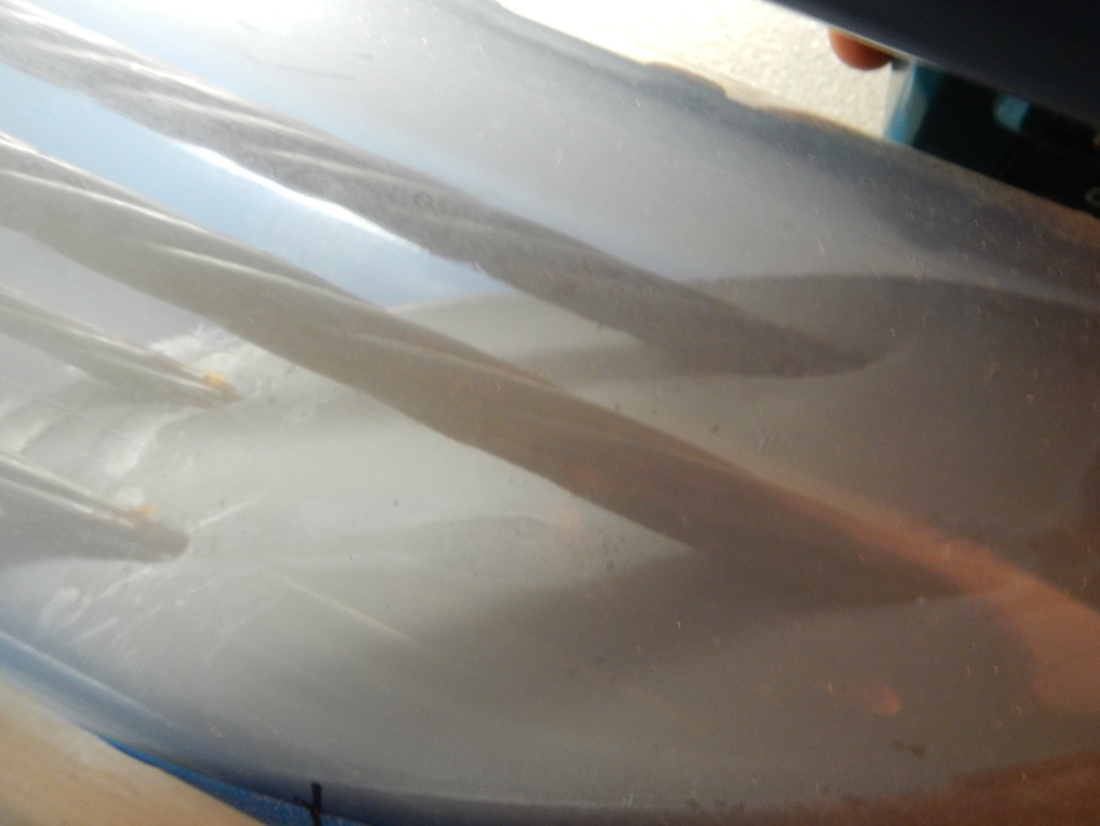
Figure 156. Photo. Void condition of 0 percent chloride specimen.

Figure 157. Photo. Void condition of 0.08 percent chloride specimen. This photo shows stressed strands in the void of 0.08 percent chloride multi-strand specimen 1 week after recharging water was added to the void.
Figure 157. Photo. Void condition of 0.08 percent chloride specimen.

Figure 158. Photo. Void condition of 0.2 percent chloride specimen. This photo shows stressed strands in the void of 0.2 percent chloride multi-strand specimen 1 week after recharging water was added to the void.
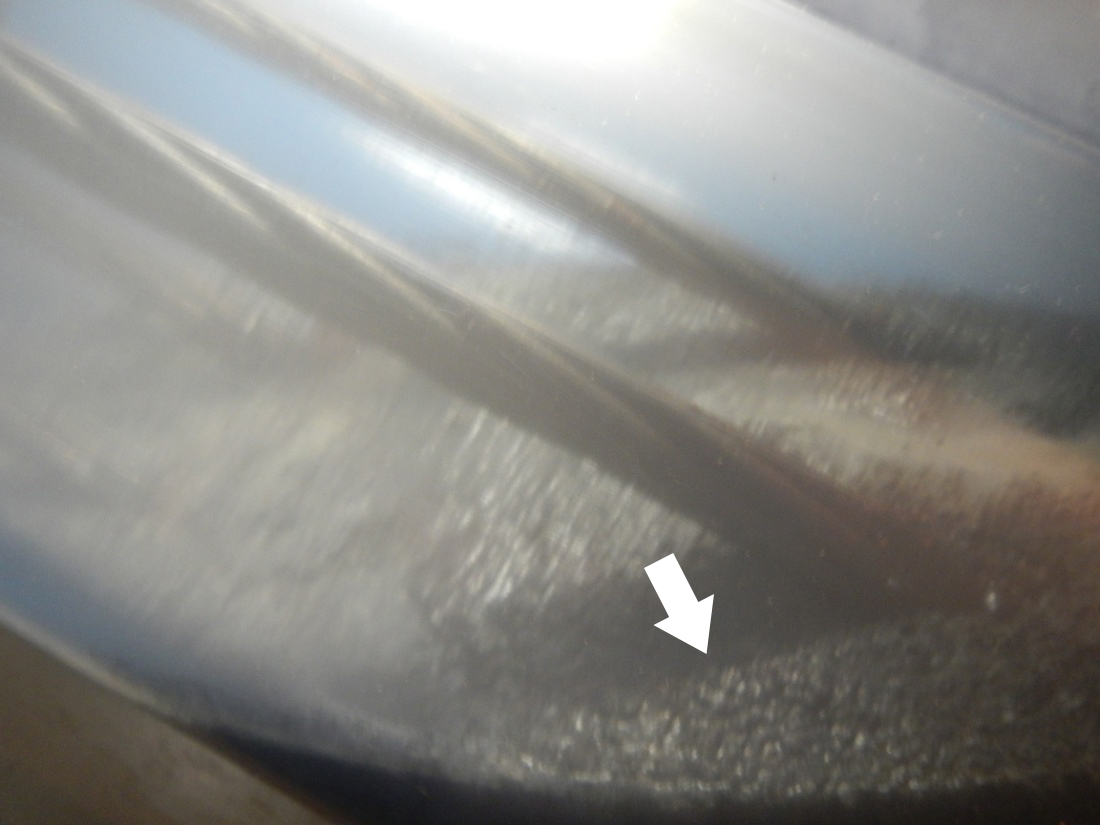
Figure 158. Photo. Void condition of 0.2 percent chloride specimen.

Figure 159. Photo. Void condition of 0.4 percent chloride specimen. This photo shows stressed strands in the void of 0.4 percent chloride multi-strand specimen 1 week after recharging water was added to the void. Black deposit is visible on the void/grout interface where stressed strands passed through. A white arrow points to unknown deposit material.
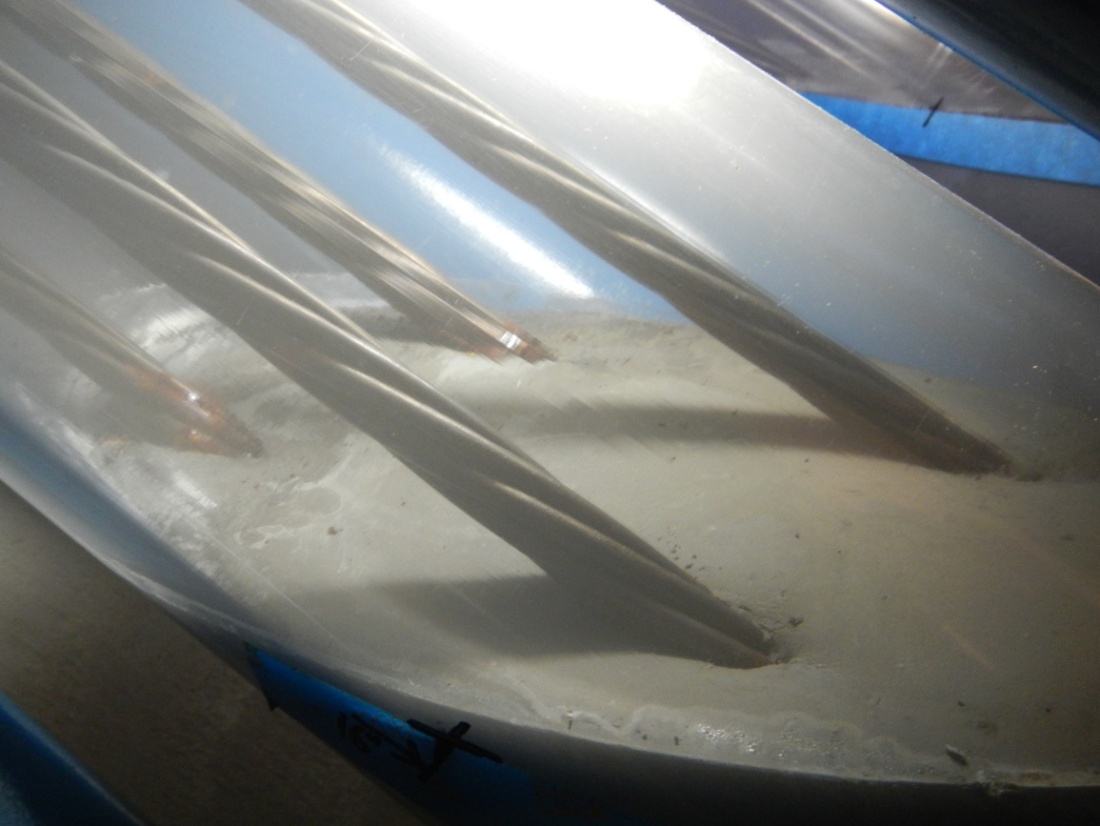
Figure 159. Photo. Void condition of 0.4 percent chloride specimen.

Figure 160. Photo. Void condition of 0.6 percent chloride specimen. This photo shows stressed strands in the void of a 0.6 percent chloride multi-strand specimen 1 week after recharging water was added to the void.
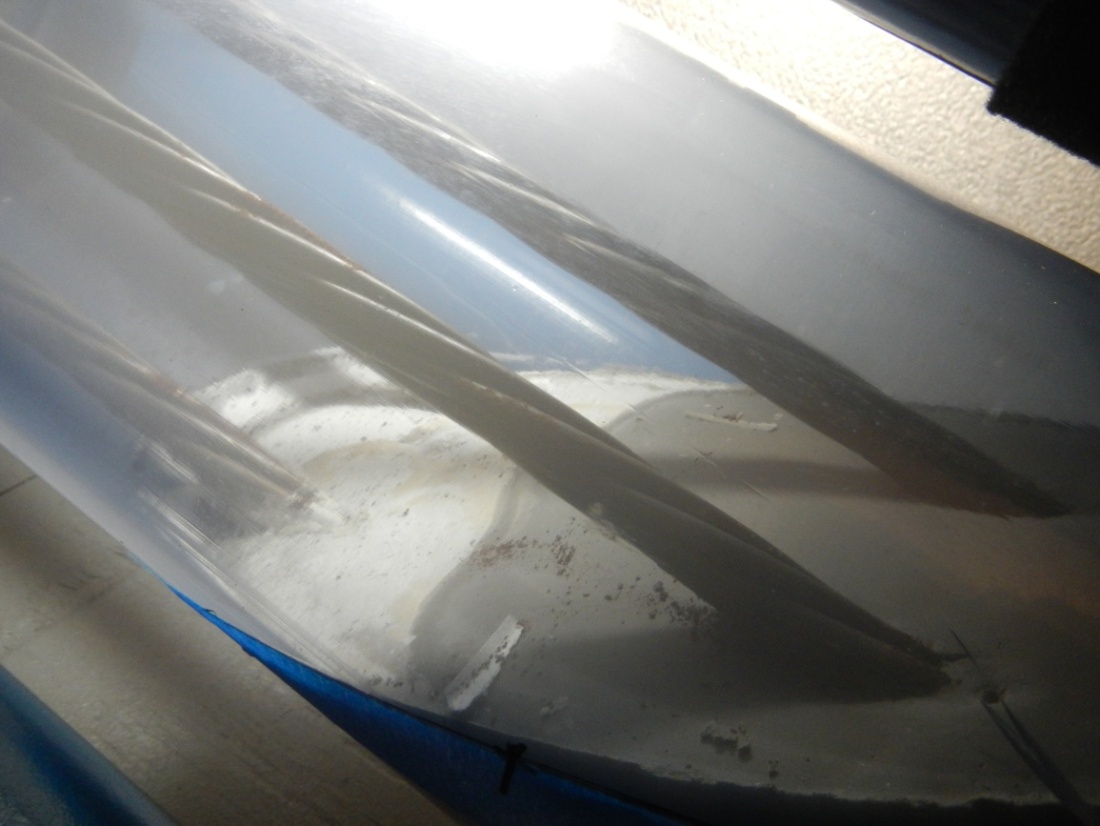
Figure 160. Photo. Void condition of 0.6 percent chloride specimen.

Figure 161. Photo. Void condition of 0.8 percent chloride specimen. This photo shows stressed strands in the void of a 0.8 percent chloride multi-strand specimen 1 week after recharging water was added to the void.
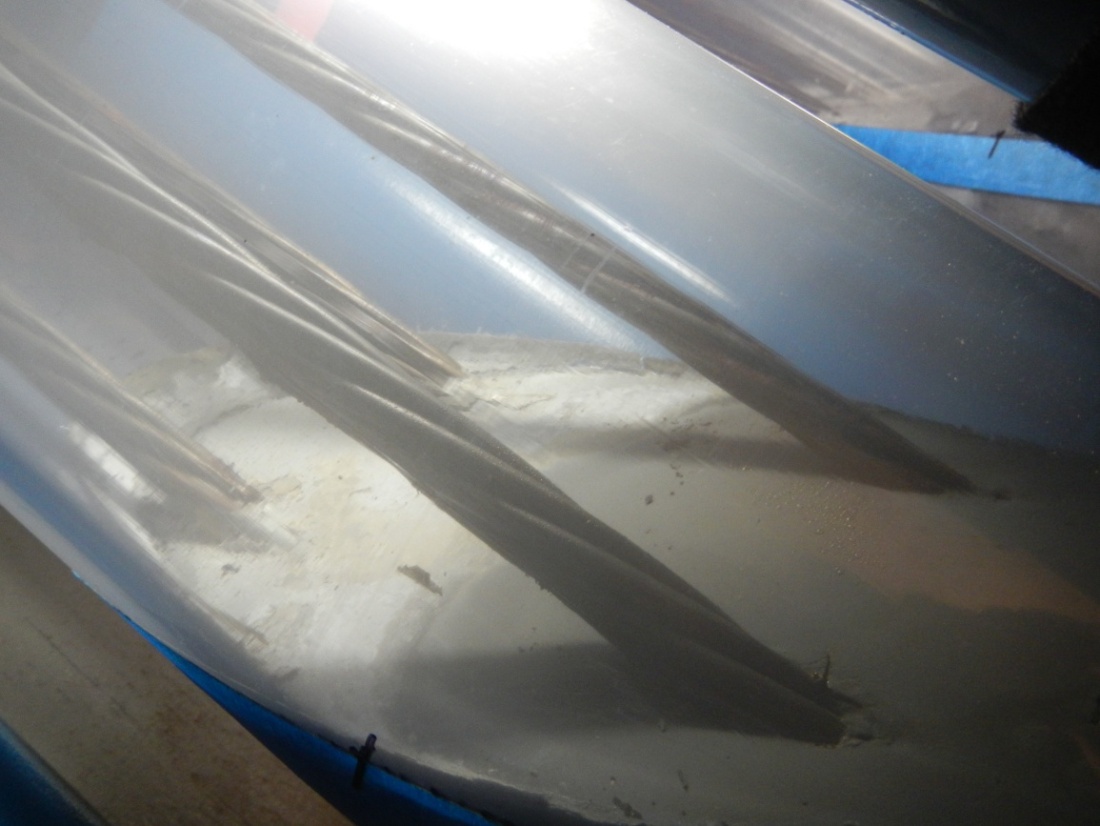
Figure 161. Photo. Void condition of 0.8 percent chloride specimen.

Figure 162. Photo. Void condition of 1.0 percent chloride specimen. This photo shows stressed strands in the void of a 1.0 percent chloride multi-strand specimen 1 week after recharging water was added to the void.
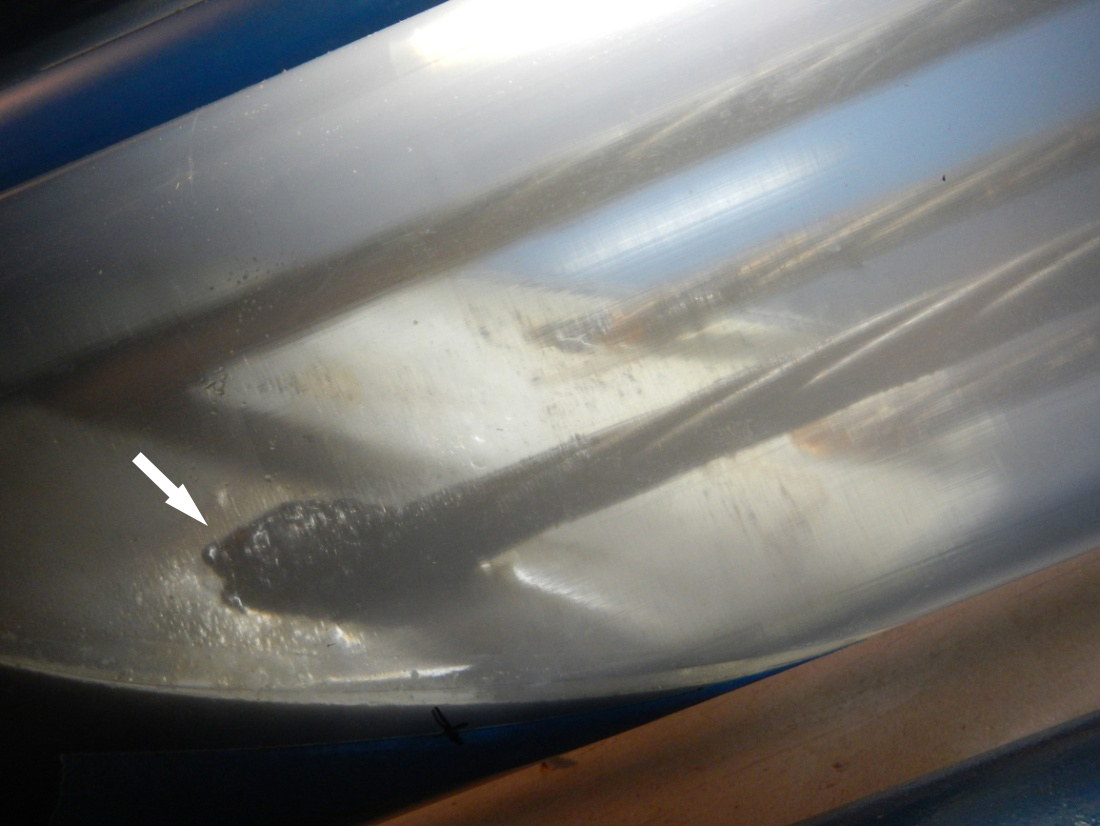
Figure 162. Photo. Void condition of 1.0 percent chloride specimen.

Figure 163. Photo. Void condition of 2.0 percent chloride specimen. This photo shows stressed strands in the void of 2.0 percent chloride multi-strand specimen 1 week after recharging water was added to the void. Black deposit is visible on the void/grout interface where stressed strands passed through. A white arrow points to unknown deposit material.
Figure 163. Photo. Void condition of 2.0 percent chloride specimen.

APPARENT GROUT RESISTIVITY AND GROUT RESISTANCE DATA

Task 2.2: Apparent Grout Resistivity of Single-Strand Specimens

Figure 164 through figure 171 present apparent grout resistivity versus time plots for single-strand specimens. Apparent grout resistivity increased when temperature decreased, and it decreased when temperature increased. Such a dependency of grout resistivity on temperature is also responsible for increased corrosion rate during the H & H cycles and suppressed corrosion rate during the F & D cycles. The control specimens maintained more or less their initial resistivity values at the ambient condition.

Figure 172 through figure 175 summarize mean apparent grout resistivity of fully grouted specimens per chloride concentration in initial ambient, ambient, H & H, and F & D conditions, respectively. Similarly, figure 176 through figure 179 summarize mean apparent grout resistivity of voided specimens per chloride concentration in initial ambient, ambient, H & H, and F & D conditions, respectively. Mean apparent grout resistivity data showed the same trend—the highest resistivity during the F & D cycles and the lowest during the H & H cycles. No definite relationship was found between apparent grout resistivity and chloride concentration. Grout void and stress did not appear to influence the apparent grout resistivity, either.
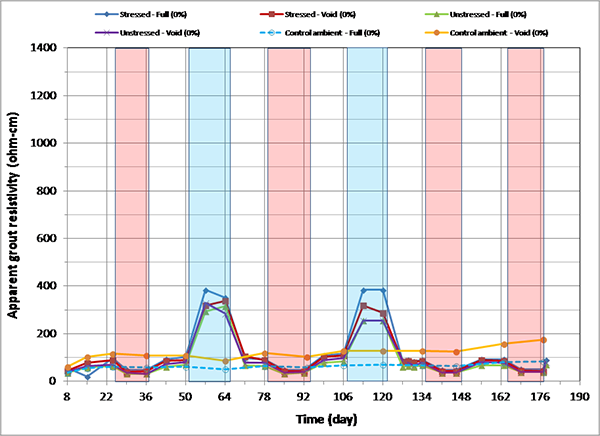
Figure 164. Graph. Apparent grout resistivity versus time for 0 percent chloride single-strand specimens. This graph shows apparent grout resistivity versus time for 0 percent chloride single-strand specimens. Apparent grout resistivity is on the y-axis from 0 to 1,400 ohm-cm, and time is on the x-axis from 8 to 190 days. Six lines are shown, all at 0 percent chloride: stressed full, unstressed void, stressed void, control ambient full, unstressed full, and control ambient void. Individual hot and humid (H & H) and freezing and dry (F & D) cycles are highlighted with red and blue columns, respectively. White columns indicate either initial ambient or ambient cycles. Apparent grout resistivity increased when temperature decreased in the F & D cycles, and it decreased when temperature increased in the H & H cycles.
Figure164. Graph. Apparent grout resistivity versus time for 0 percent chloride single-strand specimens.
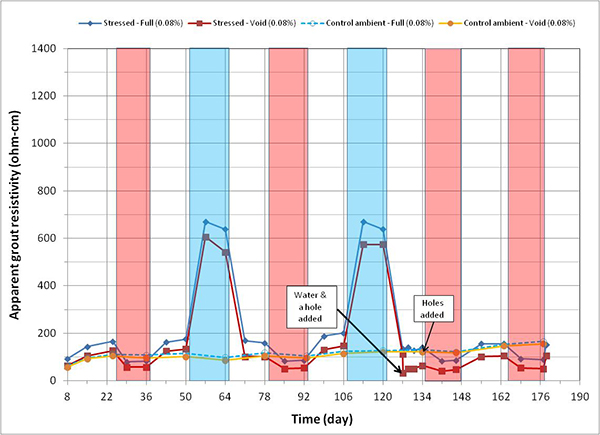
Figure 165. Graph. Apparent grout resistivity versus time for 0.08 percent chloride single-strand specimens. This graph shows apparent grout resistivity versus time for 0.08 percent chloride single-strand specimens. Apparent grout resistivity is on the y-axis from 0 to 1,400 ohm-cm, and time is on the x-axis from 8 to 190 days. Four lines are shown, all at 0.08 percent chloride: stressed full, stressed void, control ambient full, and control ambient void. Individual hot and humid (H & H) and freezing and dry (F & D) cycles are highlighted with red and blue columns, respectively. White columns indicate either initial ambient or ambient cycles. A duct hole and water were introduced into the stressed specimen’s void after 129 days of testing, and 4 duct holes were introduced in the control specimen’s void after 
134 days of testing. Apparent grout resistivity increased when temperature decreased in the F & D cycles, and it decreased when temperature increased in the H & H cycles.
Figure 165. Graph. Apparent grout resistivity versus time for 0.08 percent chloride single-strand specimens.
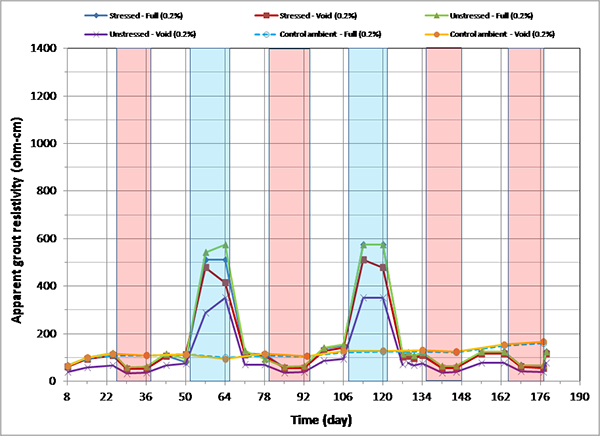
Figure 166. Graph. Apparent grout resistivity versus time for 0.2 percent chloride single-strand specimens. This graph shows apparent grout resistivity versus time for 0.2 percent chloride single-strand specimens. Apparent grout resistivity is on the y-axis from 0 to 1,400 ohm-cm, and time is on the x-axis from 8 to 190 days. Six lines are shown, all at 0.2 percent chloride: stressed full, unstressed void, stressed void, control ambient full, unstressed full, and control ambient void. Individual hot and humid (H & H) and freezing and dry (F & D) cycles are highlighted with red and blue columns, respectively. White columns indicate either initial ambient or ambient cycles. Apparent grout resistivity increased when temperature decreased in the F & D cycles, and it decreased when temperature increased in the H & H cycles.
Figure 166. Graph. Apparent grout resistivity versus time for 0.2 percent chloride single-strand specimens.
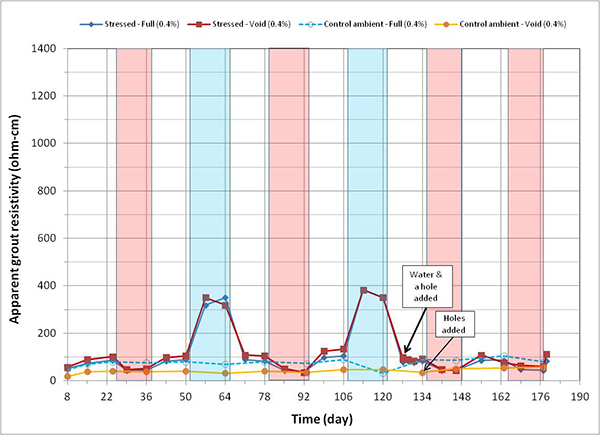
Figure 167. Graph. Apparent grout resistivity versus time for 0.4 percent chloride single-strand specimens. This graph shows apparent grout resistivity versus time for 0.4 percent chloride single-strand specimens. Apparent grout resistivity is on the y-axis from 0 to 1,400 ohm-cm, and time is on the x-axis from 8 to 190 days. Four lines are shown, all at 0.4 percent chloride: stressed full, stressed void, control ambient full, and control ambient void. Individual hot and humid (H & H) and freezing and dry (F & D) cycles are highlighted with red and blue columns, respectively. White columns indicate either initial ambient or ambient cycles. A duct hole and water were introduced into the stressed specimen’s void after 129 days of testing, and 4 duct holes were introduced in the control specimen’s void after 
134 days of testing. Apparent grout resistivity increased when temperature decreased in the F & D cycles, and it decreased when temperature increased in the H & H cycles.
Figure 167. Graph. Apparent grout resistivity versus time for 0.4 percent chloride single-strand specimens.
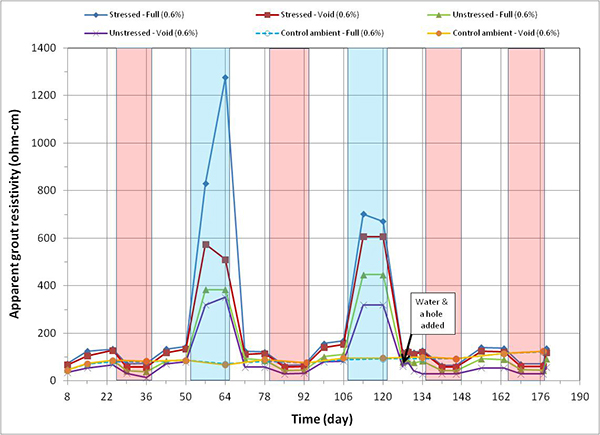
Figure 168. Graph. Apparent grout resistivity versus time for 0.6 percent chloride single-strand specimens. This graph shows apparent grout resistivity versus time for 0.6 percent chloride single-strand specimens. Apparent grout resistivity is on the y-axis from 0 to 1,400 ohm-cm, and time is on the x-axis from 8 to 190 days. Six lines are shown, all at 0.6 percent chloride: stressed full, unstressed void, stressed void, control ambient full, unstressed full, and control ambient void. Individual hot and humid (H & H) and freezing and dry (F & D) cycles are highlighted with red and blue columns, respectively. White columns indicate either initial ambient or ambient cycles. A duct hole and water were introduced into the unstressed specimen’s void after 129 days of testing. Apparent grout resistivity increased when temperature decreased in the F & D cycles, and it decreased when temperature increased in the H & H cycles.
Figure 168. Graph. Apparent grout resistivity versus time for 0.6 percent chloride single-strand specimens.
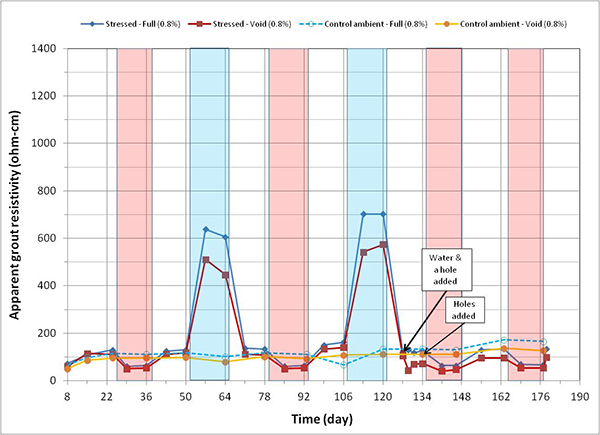
Figure 169. Graph. Apparent grout resistivity versus time for 0.8 percent chloride single-strand specimens. This graph shows apparent grout resistivity versus time for 0.8 percent chloride single-strand specimens. Apparent grout resistivity is on the y-axis from 0 to 1,400 ohm-cm, and time is on the x-axis from 8 to 190 days. Four lines are shown, all at 0.8 percent chloride: stressed full, stressed void, control ambient full, and control ambient void. Individual hot and humid (H & H) and freezing and dry (F & D) cycles are highlighted with red and blue columns, respectively. White columns indicate either initial ambient or ambient cycles. A duct hole and water were introduced into the stressed specimen’s void after 129 days of testing, and 4 duct holes were introduced in the control specimen’s void after 134 days of testing. Apparent grout resistivity increased when temperature decreased in the F & D cycles, and it decreased when temperature increased in the H & H cycles.
Figure 169. Graph. Apparent grout resistivity versus time for 0.8 percent chloride single-strand specimens.
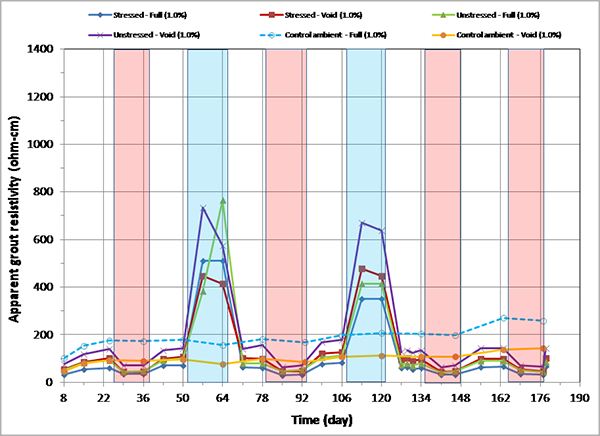
Figure 170. Graph. Apparent grout resistivity versus time for 1.0 percent chloride single-strand specimens. This graph shows apparent grout resistivity versus time for 1.0 percent chloride single-strand specimens. Apparent grout resistivity is on the y-axis from 0 to 1,400 ohm-cm, and time is on the x-axis from 8 to 190 days. Six lines are shown, all at 1.0 percent chloride: stressed full, unstressed void, stressed void, control ambient full, unstressed full, and control ambient void. Individual hot and humid (H & H) and freezing and dry (F & D) cycles are highlighted with red and blue columns, respectively. White columns indicate either initial ambient or ambient cycles. It can be seen that apparent grout resistivity increased when temperature decreased in the F & D cycles, and it decreased when temperature increased in the H & H cycles
Figure 170. Graph. Apparent grout resistivity versus time for 1.0 percent chloride single-strand specimens.
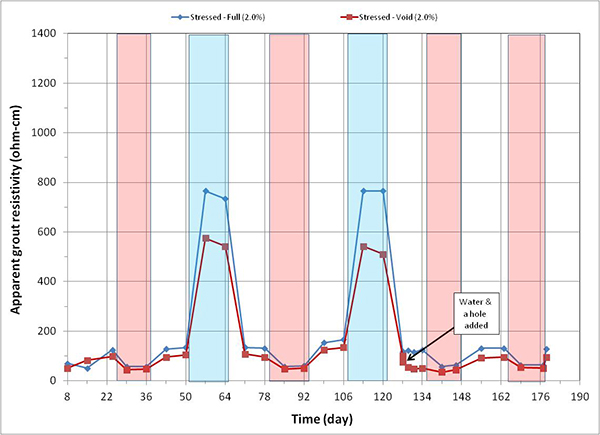
Figure 171. Graph. Apparent grout resistivity versus time for 2.0 percent chloride single-strand specimens. This graph shows apparent grout resistivity versus time for 2.0 percent chloride single-strand specimen. Apparent grout resistivity is on the y-axis from 0 to 1,400 ohm-cm, and time is on the x-axis from 8 to 190 days. Four lines are shown, all at 2.0 percent chloride: stressed full, stressed void, control ambient full, and control ambient void. Individual hot and humid (H & H) and freezing and dry (F & D) cycles are highlighted with red and blue columns, respectively. White columns indicate either initial ambient or ambient cycles. A duct hole and water were introduced into the stressed specimen’s void after 129 days of testing. Apparent grout resistivity increased when temperature decreased in the F & D cycles, and it decreased when temperature increased in the H & H cycles.
Figure 171. Graph. Apparent grout resistivity versus time for 2.0 percent chloride single-strand specimens.
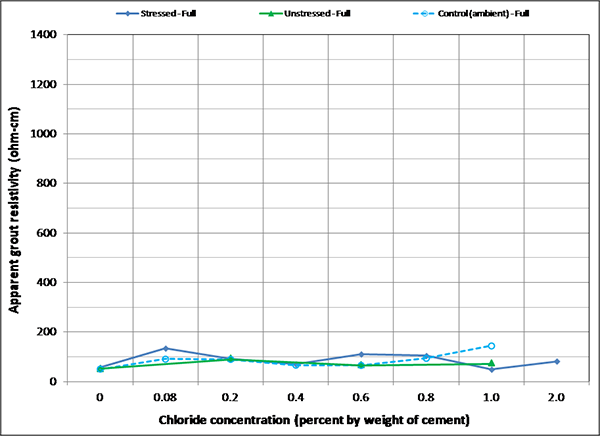
Figure 172. Graph. Mean apparent grout resistivity of fully grouted single-strand specimens in initial ambient condition. This graph shows mean apparent grout resistivity 
of fully grouted single-strand specimens per chloride concentration in initial ambient condition. Apparent grout resistivity is on the y-axis from 0 to 1,400 ohm-cm, and chloride concentration is on the x-axis from 0 to 2.0 percent by weight of cement. Three lines are shown: stressed full, unstressed full, and control (ambient) full. All three lines stay around 100 ohm-cm regardless of chloride concentration.
Figure 172 . Graph. Mean apparent grout resistivity of fully grouted single-strand specimens in initial ambient condition.
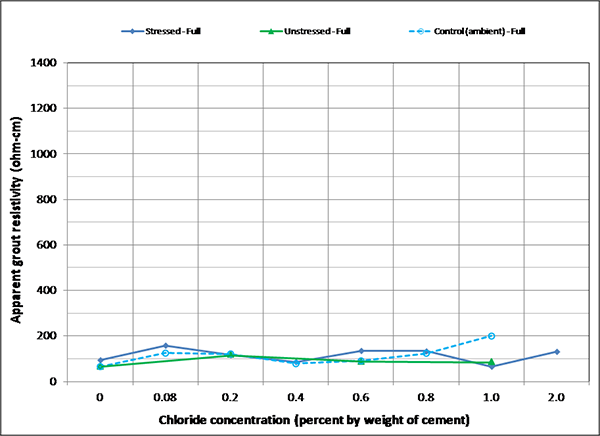
Figure 173. Graph. Mean apparent grout resistivity of fully grouted single-strand specimens in ambient condition. This graph shows mean apparent grout resistivity of fully grouted single-strand specimens per chloride concentration in ambient condition. Apparent grout resistivity is on the y-axis from 0 to 1,400 ohm-cm, and chloride concentration is on the x-axis from 0 to 2.0 percent by weight of cement. Three lines are shown: stressed full, unstressed full, and control (ambient) full. All three lines stay around 100 ohm-cm regardless of chloride concentration.
Figure 173. Graph. Mean apparent grout resistivity of fully grouted single-strand specimens in ambient condition.
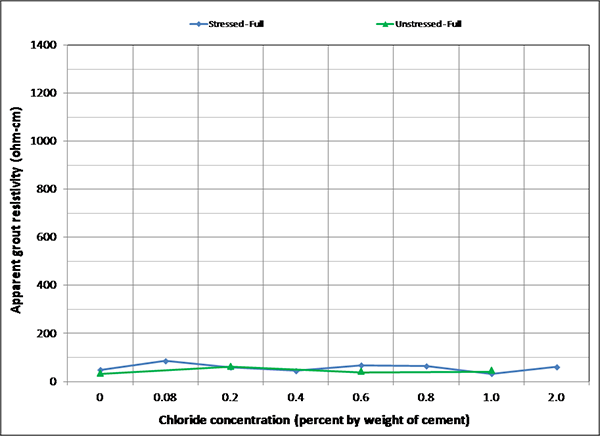
Figure 174. Graph. Mean apparent grout resistivity of fully grouted single-strand specimens in H & H condition. This graph shows mean apparent grout resistivity of fully grouted single-strand specimens per chloride concentration in the hot and humid (H & H) condition. Apparent grout resistivity is on the y-axis from 0 to 1,400 ohm-cm, and chloride concentration is on the x-axis from 0 to 2.0 percent by weight of cement. Two lines are shown: stressed full and unstressed full. Both lines stay around 50 ohm-cm regardless of chloride concentration. The decreased mean resistivities were caused by elevated temperature in the H & H cycles.
Figure 174. Graph. Mean apparent grout resistivity of fully grouted single-strand specimens in H & H condition.
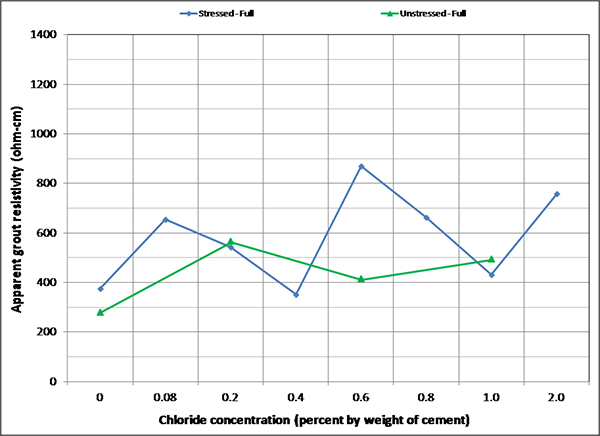
Figure 175. Graph. Mean apparent grout resistivity of fully grouted single-strand specimens in F & D condition. This graph shows mean apparent grout resistivity of fully grouted single-strand specimens per chloride concentration in the freezing and dry (F & D) condition. Apparent grout resistivity is on the y-axis from 0 to 1,400 ohm-cm, and chloride concentration is on the x-axis from 0 to 2.0 percent by weight of cement. Two lines are shown: stressed full and unstressed full. Both lines vary between 300 and 900 ohm-cm, independent of chloride concentration. The stressed specimens exhibit a larger variation than the unstressed ones. The increased mean resistivities were caused by decreased temperature in the F & D cycles.
Figure 175. Graph. Mean apparent grout resistivity of fully grouted single-strand specimens in F & D condition.
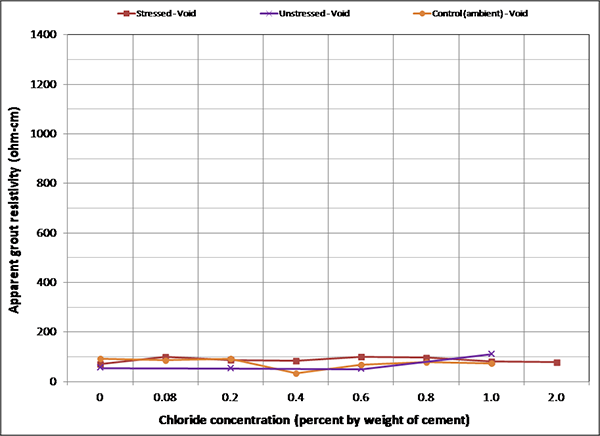
Figure 176. Graph. Mean apparent grout resistivity of voided single-strand specimens in initial ambient condition. This graph shows mean apparent grout resistivity of voided single-strand specimens per chloride concentration in the initial ambient condition. Apparent grout resistivity is on the y-axis from 0 to 1,400 ohm-cm, and chloride concentration is on the x-axis from 0 to 2.0 percent by weight of cement. Three lines are shown: stressed void, unstressed void, and control (ambient) void. The three lines stay around 100 ohm-cm regardless of chloride concentration.
Figure 176. Graph. Mean apparent grout resistivity of voided single-strand specimens in initial ambient condition.
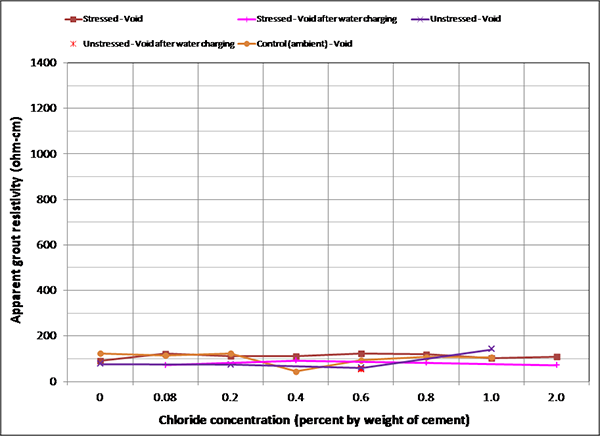
Figure 177. Graph. Mean apparent grout resistivity of voided single-strand specimens in ambient condition. This graph shows mean apparent grout resistivity of voided single-strand specimens per chloride concentration in ambient condition. Apparent grout resistivity is on the y-axis from 0 to 1,400 ohm-cm, and chloride concentration is on the x-axis from 0 to 2.0 percent by weight of cement. Five lines are shown: stressed void, stressed void after water charging, unstressed void, unstressed void after water charging, and control (ambient) void. Three of the lines representing stressed, unstressed, and control specimens stay around 100 ohm-cm regardless of chloride concentration.
Figure 177. Graph. Mean apparent grout resistivity of voided single-strand specimens in ambient condition.
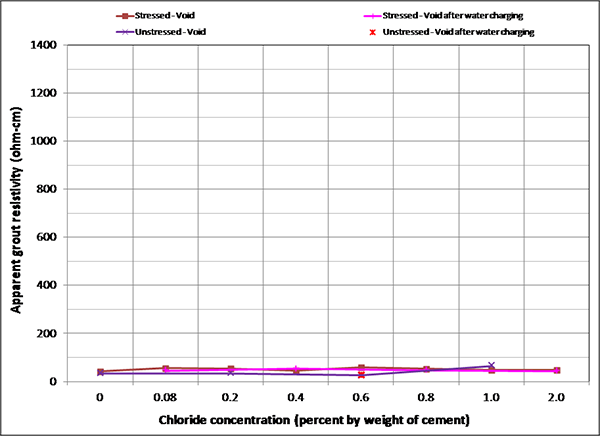
Figure 178. Graph. Mean apparent grout resistivity of voided single-strand specimens in H & H condition. This graph shows mean apparent grout resistivity of voided single-strand specimens per chloride concentration in the hot and humid (H & H) condition. Apparent grout resistivity is on the y-axis from 0 to 1,400 ohm-cm, and chloride concentration is on the x-axis from 0 to 2.0 percent by weight of cement. Four lines are shown: stressed void, stressed void after water charging, unstressed void, and unstressed void after water charging. Two of the lines representing stressed and unstressed specimens stay around 50 ohm-cm regardless of chloride concentration. The decreased mean resistivities were caused by elevated temperature in the H & H cycles.
Figure 178. Graph. Mean apparent grout resistivity of voided single-strand specimens in H & H condition.
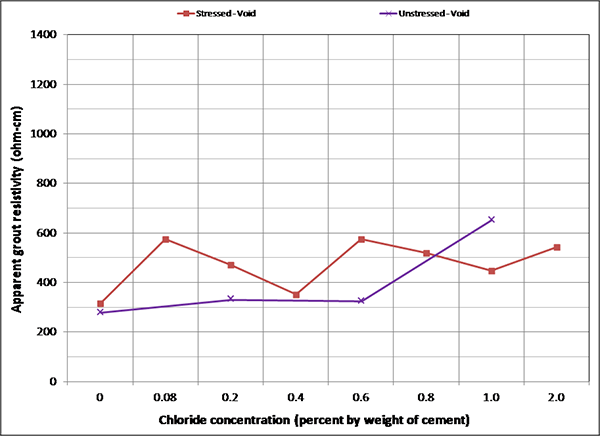
Figure 179. Graph. Mean apparent grout resistivity of voided single-strand specimens in F & D condition. This graph shows mean apparent grout resistivity of voided single-strand specimens per chloride concentration in the freezing and dry (F & D) condition. Apparent grout resistivity is on the y-axis from 0 to 1,400 ohm-cm, and chloride concentration is on the x-axis from 0 to 2.0 percent by weight of cement. Two lines are shown: stressed void and unstressed void. The lines vary between 300 and 700 ohm-cm, independent of chloride concentration. The stressed specimens exhibit a larger variation than the unstressed ones. The increased mean resistivities were caused by decreased temperature in the F & D cycles.
Figure 179. Graph. Mean apparent grout resistivity of voided single-strand specimens in F & D condition.

Task 2.3: Grout Resistance of Multi-Strand Specimens

Figure 180 and figure 181 summarize mean grout resistances of multi-strand specimens in different exposure conditions measured with upper pair (P1 and P2) and lower pair (P3 and P4) of resistance probes, respectively. Figure 182 shows overall mean grout resistances. As discussed in the apparent grout resistivity section, the F & D cycles yielded the highest grout resistance, and the H & H cycles yielded the lowest. The grout resistance’s dependency on temperature should be partially responsible for increased macro-cell corrosion current density during the H & H cycles and suppressed macro-cell corrosion current density during the F & D cycles. The lower grout section associated with the P3 and P4 probes had much lower resistance than the upper section with P1 and P2 probes.
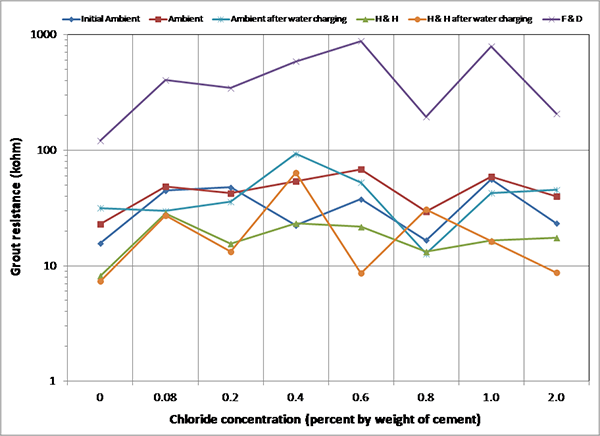
Figure 180. Graph. Mean grout resistances between P1 and P2 of multi-strand specimens. This graph shows mean grout resistances of multi-strand specimens as a function of chloride concentration in different exposure conditions measured with upper pair (P1 and P2) of resistance probes. Grout resistance is on the y-axis from 1 to 1,000 ohm, and chloride concentration is on the x-axis from 0 to 2.0 percent by weight of cement. Six lines are shown: initial ambient, ambient, ambient after water charging, hot and humid (H & H), H & H after water charging, and freezing and dry (F & D). The F & D cycle yielded the highest grout resistance, and the H & H cycles yielded the lowest.
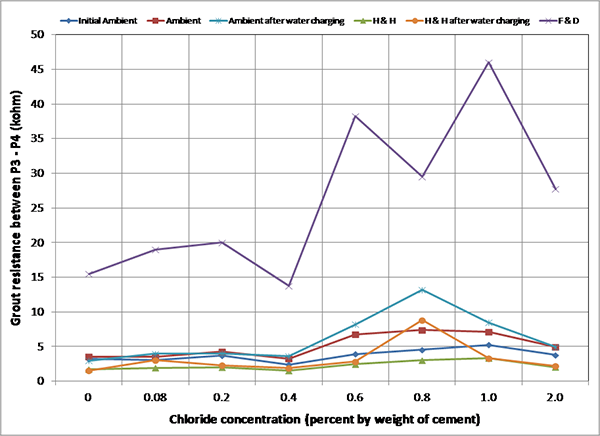
Figure 180. Graph. Mean grout resistances between P1 and P2 of multi-strand specimens.

Figure 181. Graph. Mean grout resistances between P3 and P4 of multi-strand specimens. This graph shows mean grout resistances of multi-strand specimens as a function of chloride concentration in different exposure conditions measured with lower pair (P3 and P4) of resistance probes. Grout resistance is on the y-axis from 0 to 50 ohm, and chloride concentration is on the x-axis from 0 to 2.0 percent by weight of cement. Six lines are shown: initial ambient, ambient, ambient after water charging, hot and humid (H & H), H & H after water charging, and freezing and dry (F & D). The F & D cycle yielded the highest grout resistance, and the H & H cycles yielded the lowest.
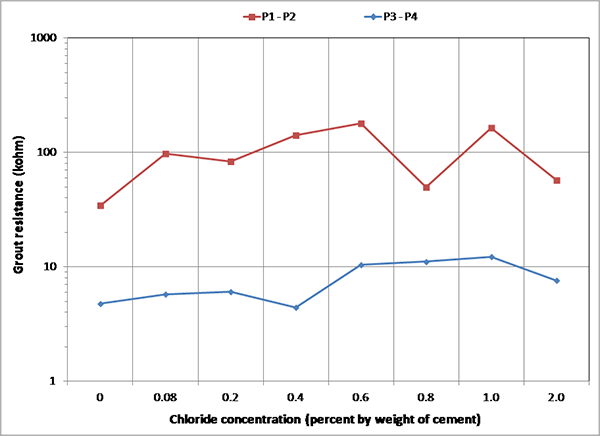
Figure 181 Graph. Mean grout resistances between P3 and P4 of multi-strand specimens.

Figure 182. Graph. Overall mean grout resistances of multi-strand specimens. This graph shows overall mean grout resistances as a function of multi-strand specimens. Grout resistance is on the y-axis from 1 to 1,000 ohm, and chloride concentration is on the x-axis from 0 to 2.0 percent by weight of cement. Two lines are shown: probe (P)1 to P2 and P3 
to P4. P3 to P4 yielded a much higher grout resistance than P1 to P2 regardless of chloride concentration
Figure 182. Graph. Overall mean grout resistances of multi-strand specimens.

CHARACTERIZATION OF CORROSION MORPHOLOGIES

Task 2.2: Single-Strand Specimens

Table 9 summarizes the number of rust spots and the number of pits counted on single-strand specimens. Physical condition of every extracted strand was documented schematically using a condition mapping sheet. Figure 183 through figure 190 show the mapped conditions of single-strand specimens. The red marks on the mapping sheets indicate where rust spots were observed. Length of the marks indicates relative surface area showing sign of corrosion. Figure 191 through figure 198 show as-extracted conditions of voided single-strand specimens. The first rust spot appeared on a stressed 0.4 percent chloride specimen with void (see figure 194). As chloride concentration increased, the number of rust spots increased. Although the 0.4 percent chloride specimen received 0.17 fl oz of distilled water in the void, the added water might not play a role to initiate corrosion. This is because other voided specimens containing a lower chloride concentration (0.08 percent) and a higher chloride concentration (0.6 percent) did not initiate corrosion even though they also received the same volume of distilled water. The fully grouted stressed specimens containing 0.8 and 2.0 percent chloride developed two and five rust spots, respectively. The voided stressed specimens containing the same chloride concentrations also developed the same number of rust spots despite having water in the voids. Measurable pits (≥ 2 mil) started to appear at 0.8 percent chloride concentration. More pits were observed on the strands exposed to higher chloride concentrations and voids. Markedly higher number of pits found in the stressed 2.0 percent chloride specimen with void suggests that a combination of a void, recharged water, and elevated chloride concentration can be detrimental.

Table 9. Summary of corrosion condition observed on single-strand specimens.

Chloride Concentration (Percent by Cement Weight) Number of Rust Spots* Number of Pits
Stressed-Full Stressed-Void Unstressed-Full Unstressed-Void Stressed-Full Stressed-Void Unstressed-Full Unstressed-Void
0.00 0 0 0 0 0 0 0 0
0.08 0 0     0 0    
0.20 0 0 0 0 0 0 0 0
0.40 0 1     0 0    
0.60 1 2 1 0 0 0 0 0
0.80 2 2     0 0    
1.00 5 4 4 5 0 34 0 26
2.00 5 5     35 102    

*Size of individual rust spots varied.
Note: Bolded text indicates voids that were recharged with 0.17 fl oz of distilled water at day 127. Blank cells indicate no data were relevant to the cell.
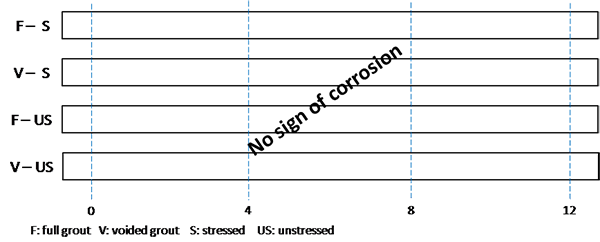
Figure 183. Illustration. Condition mapping of 0 percent chloride single-strand specimens. This illustration shows a condition mapping sheet of four 0 percent chloride single-strand specimens: stressed full grout, stressed voided grout, unstressed full grout, and unstressed voided grout. No rust spots were observed.
Figure 183. Illustration. Condition mapping of 0 percent chloride single-strand specimens.

Figure 184. Illustration. Condition mapping of 0.08 percent chloride single-strand specimens. This illustration shows a condition mapping sheet of two 0.08 percent chloride single-strand specimens: stressed full grout and stressed voided grout. No rust spots were observed.
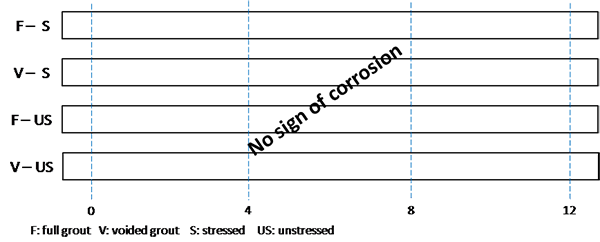
Figure 184. Illustration. Condition mapping of 0.08 percent chloride single-strand specimens.

Figure 185. Illustration. Condition mapping of 0.2 percent chloride single-strand specimens. This illustration shows a condition mapping sheet of four 0.2 percent chloride single-strand specimens: stressed full grout, stressed voided grout, unstressed full grout, and unstressed voided grout. No rust spots were observed.
Figure 185. Illustration. Condition mapping of 0.2 percent chloride single-strand specimens.

Figure 186. Illustration. Condition mapping of 0.4 percent chloride single-strand specimens. This illustration shows a condition mapping sheet of two 0.4 percent chloride single-strand specimens: stressed full grout and stressed voided grout. One rust spot was observed on the stressed voided grout strand.
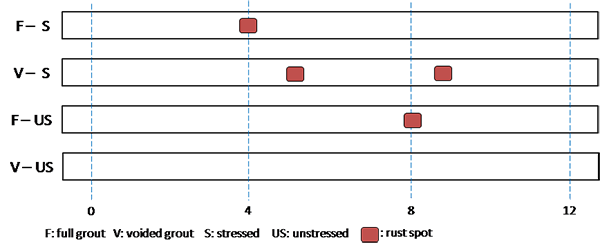
Figure 186. Illustration. Condition mapping of 0.4 percent chloride single-strand specimens.

Figure 187. Illustration. Condition mapping of 0.6 percent chloride single-strand specimens. This illustration shows a condition mapping sheet of four 0.6 percent chloride single-strand specimens: stressed full grout, stressed voided grout, unstressed full grout, and unstressed voided grout. Four rust spots were observed: one on the stressed full grout strand, two on the stressed voided grout strand, and one on the unstressed full grout strand.
Figure 187. Illustration. Condition mapping of 0.6 percent chloride single-strand specimens.

Figure 188. Illustration. Condition mapping of 0.8 percent chloride single-strand specimens. This illustration shows a condition mapping sheet of two 0.8 percent chloride single-strand specimens: stressed full grout and stressed voided grout. Four spots were observed: two on each strand.
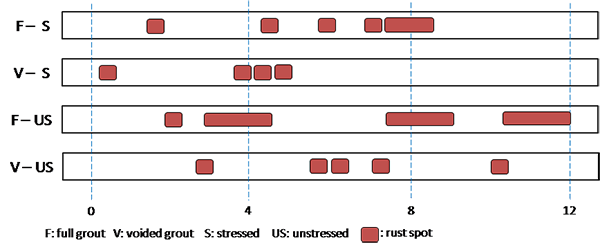
Figure 188. Illustration. Condition mapping of 0.8 percent chloride single-strand specimens.

Figure 189. Illustration. Condition mapping of 1.0 percent chloride single-strand specimens. This illustration shows a condition mapping sheet of four 1.0 percent chloride single-strand specimens: stressed full grout, stressed voided grout, unstressed full grout, and unstressed voided grout. More than 20 rust spots were observed spread throughout the four strands.
Figure 189. Illustration. Condition mapping of 1.0 percent chloride single-strand specimens.

Figure 190. Illustration. Condition mapping of 2.0 percent chloride single-strand specimens. This illustration shows a condition mapping sheet of two 2.0 percent chloride single-strand specimens: stressed full grout and stressed voided grout. Ten rust spots were observed spread throughout the two strands.
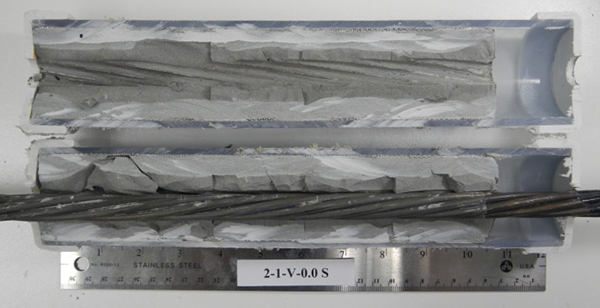
Figure 190. Illustration. Condition mapping of 2.0 percent chloride single-strand specimens.

Figure 191. Photo. Stressed single-strand specimen with void and 0 percent chloride. This photo shows the as-extracted condition of a 0 percent chloride stressed single-strand specimen with void. No corrosion is visible.
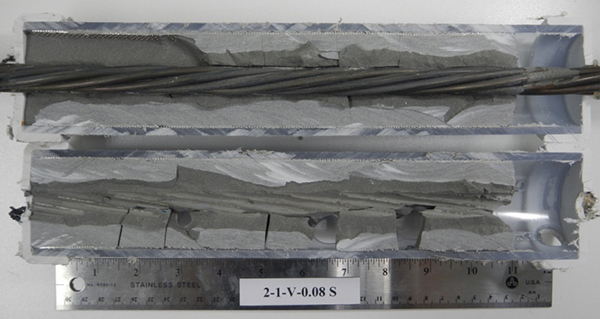
Figure 191. Photo. Stressed single-strand specimen with void and 0 percent chloride.

Figure 192. Photo. Stressed single-strand specimen with void and 0.08 percent chloride. This photo shows the as-extracted condition of a 0.08 percent chloride stressed single-strand specimen with void. No corrosion is visible.
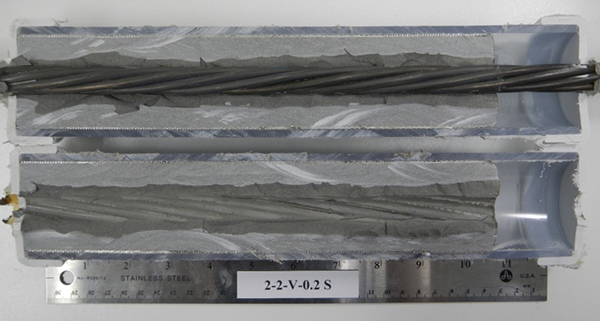
Figure 192. Photo. Stressed single-strand specimen with void and 0.08 percent chloride.

Figure 193. Photo. Stressed single-strand specimen with void and 0.2 percent chloride. This photo shows the as-extracted condition of a 0.2 percent chloride stressed single-strand specimen with void. No corrosion is visible.
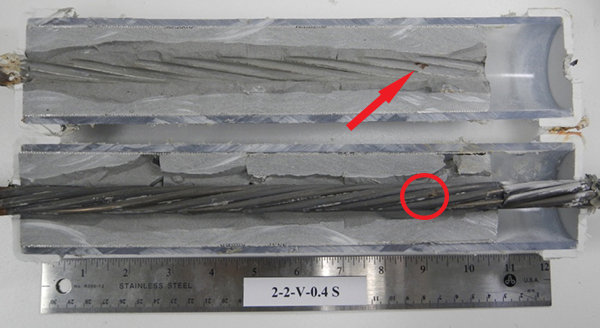
Figure 193. Photo. Stressed single-strand specimen with void and 0.2 percent chloride.

Figure 194. Photo. Stressed single-strand specimen with void and 0.4 percent chloride. This photo shows the as-extracted condition of a 0.4 percent chloride stressed single-strand specimen with void. A rust spot found on the strand is indicated by a red circle, and a matching rust stain on the grout side is indicated by a red arrow.
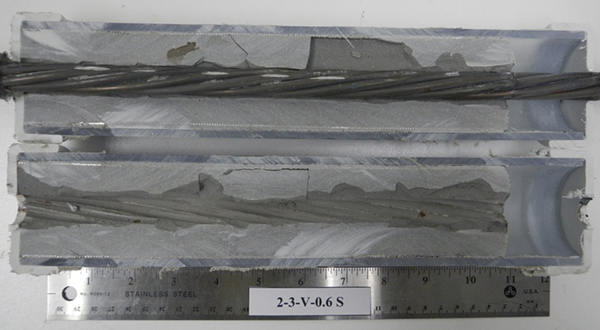
Figure 194 . Photo. Stressed single-strand specimen with void and 0.4 percent chloride.

Figure 195. Photo. Stressed single-strand specimen with void and 0.6 percent chloride. This photo shows the as-extracted condition of a 0.6 percent chloride stressed single-strand specimen with void. One corrosion spot is visible.
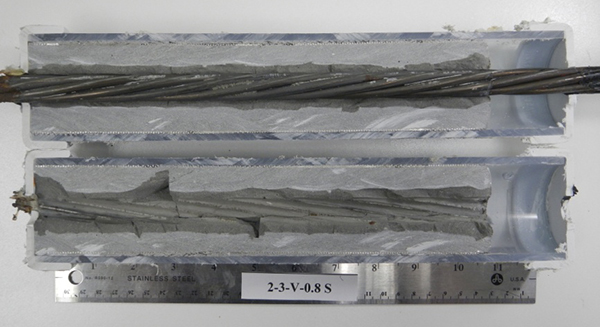
Figure 195. Photo. Stressed single-strand specimen with void and 0.6 percent chloride.

Figure 196. Photo. Stressed single-strand specimen with void and 0.8 percent chloride. This photo shows the as-extracted condition of a 0.8 percent chloride stressed single-strand specimen with void. Several small corrosion spots are visible.
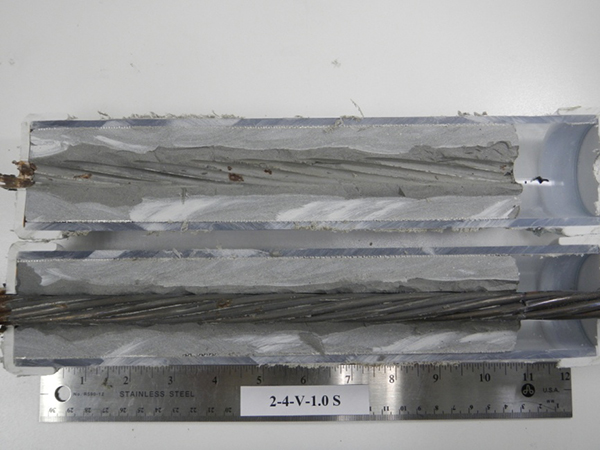
Figure 196. Photo. Stressed single-strand specimen with void and 0.8 percent chloride.

Figure 197. Photo. Stressed single-strand specimen with void and 1.0 percent chloride. This photo shows the as-extracted condition of a 1.0 percent chloride stressed single-strand specimen with void. Many small corrosion spots are visible.
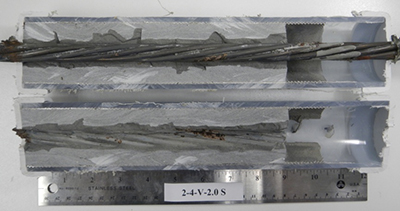
Figure 197. Photo. Stressed single-strand specimen with void and 1.0 percent chloride.

Figure 198. Photo. Stressed single-strand specimen with void and 2.0 percent chloride. This photo shows the as-extracted condition of a 2.0 percent chloride stressed single-strand specimen with void. Significant corrosion is visible.
Figure 198. Photo. Stressed single-strand specimen with void and 2.0 percent chloride.

Task 2.3: Multi-Strand Specimens

After grout caps were removed from the lower anchor plates, the anchor plates and electrical connections inside the caps were inspected for any signs of corrosion that might have affected corrosion measurements. Figure 199 and figure 200 show exterior and interior conditions of a lower anchor plate. Other than yellowish spray-on corrosion inhibitor film and residue of expansive foam that was used as filler, everything on the exterior face appeared clean without corrosion. Similarly, no corrosion was found on the interior face of the anchor plate. The other anchor plates showed similar conditions.
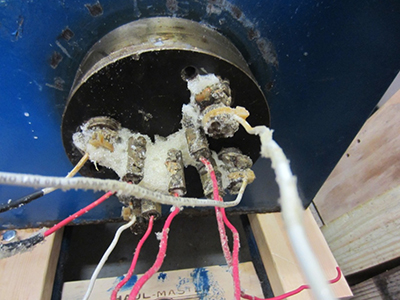
Figure 199. Photo. Exposed exterior side of lower anchor plate. This photo shows the exterior condition of a lower anchor plate. Other than yellowish spray-on corrosion inhibitor film and residue of expansive foam that was used as filler, everything on the exterior face appears clean without corrosion. Similarly, no corrosion was found on the interior face of the anchor plate.
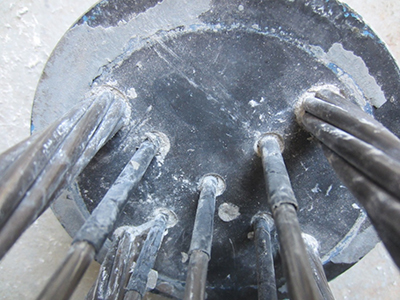
Figure 199. Photo. Exposed exterior side of lower anchor plate.

Figure 200. Photo. Exposed interior side of lower anchor plate. This photo shows the interior condition of a lower anchor plate. No corrosion was found on the interior face of the anchor plate.
Figure 200. Photo. Exposed interior side of lower anchor plate.

Figure 201 through figure 208 show condition mapping results of multi-strand specimens in a 12-inch grid system. Individual marks indicate where rust spots were observed. They do not represent the extent of corrosion. Rather, they show locations of a rust spot or a group of rust spots. On the stressed strands, rust spots started to appear at 0 percent chloride concentration and increased with chloride concentration. On the unstressed strands, rust spots first appeared at 0.4 percent chloride, and more appeared proportionally at higher chloride concentrations. In theory, the unstressed strands served as a macro-cathode; therefore, they were not supposed to corrode. One possibility is that polarized potentials of unstressed strands might place the unstressed strands outside the corrosion immune zone of a Pourbaix diagram if sufficient amount of chloride ions exists, in this case, 0.4 percent by weight of cement. The Pourbaix diagram classifies various thermodynamic states for corrosion as a function of potential and pH.
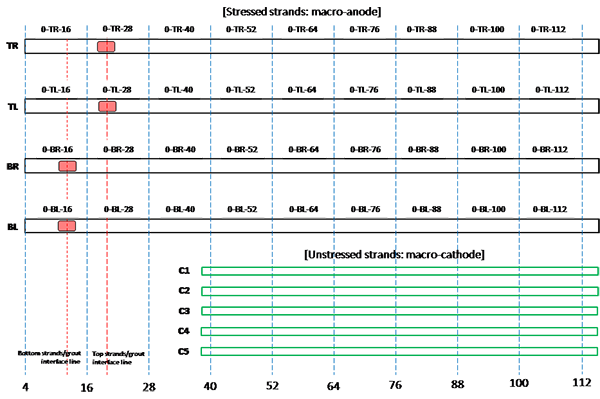
Figure 201. Illustration. Condition mapping of 0 percent chloride multi-strand specimen. This illustration shows condition mapping results of 0 percent chloride multi-strand specimens in a 12-inch grid system. Individual marks indicate where rust spots were observed on the stressed and unstressed strands. Four corrosion spots were observed on the stressed strands only. TR stands for top right strand, TL for top left strand, BR for bottom right strand, and BL for bottom left strand. C1 through C5 represent strand identifications for individual unstressed strands for macro-cathode.
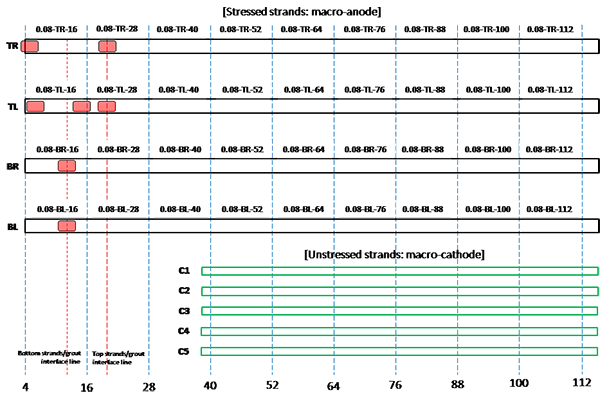
Figure 201. Illustration. Condition mapping of 0 percent chloride multi-strand specimen.

Figure 202. Illustration. Condition mapping of 0.08 percent chloride multi-strand specimen. This illustration shows condition mapping results of 0.08 percent chloride multi-strand specimens in a 12-inch grid system. Individual marks indicate where rust spots were observed on the stressed and unstressed strands. Four corrosion spots were observed on the stressed strands only. TR stands for top right strand, TL for top left strand, BR for bottom right strand, and BL for bottom left strand. C1 through C5 represent strand identifications for individual unstressed strands for macro-cathode.
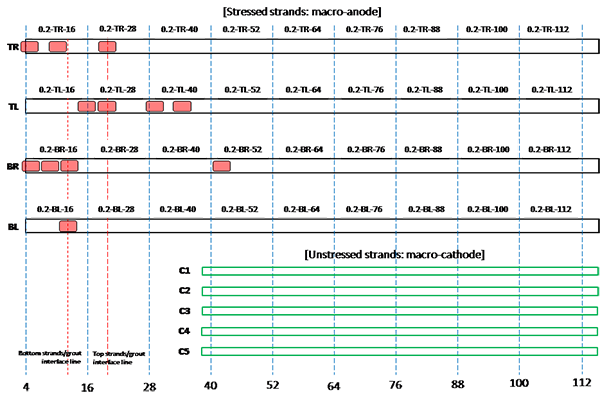
Figure 202. Illustration. Condition mapping of 0.08 percent chloride multi-strand specimen.

Figure 203. Illustration. Condition mapping of 0.2 percent chloride multi-strand specimen. This illustration shows condition mapping results of 0.2 percent chloride multi-strand specimens in a 12-inch grid system. Individual marks indicate where rust spots were observed on the stressed and unstressed strands. A total of 12 corrosion spots were observed on the stressed strands only. TR stands for top right strand, TL for top left strand, BR for bottom right strand, and BL for bottom left strand. C1 through C5 represent strand identifications for individual unstressed strands for macro-cathode.
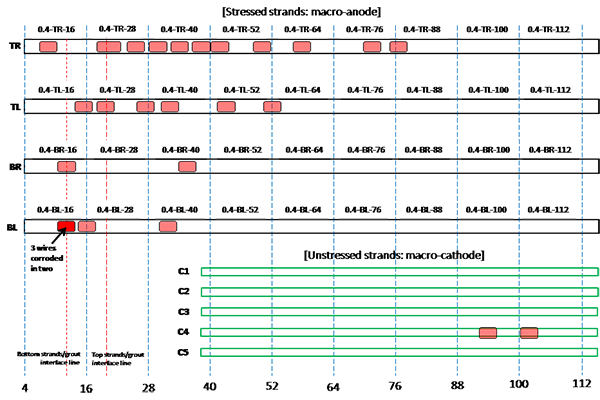
Figure 203. Illustration. Condition mapping of 0.2 percent chloride multi-strand specimen.

Figure 204. Illustration. Condition mapping of 0.4 percent chloride multi-strand specimen. This illustration shows condition mapping results of 0.4 percent chloride multi-strand specimens in a 12-inch grid system. Individual marks indicate where rust spots were observed on the stressed and unstressed strands. A total of 22 corrosion spots were observed on the stressed strands, and 2 were observed on the unstressed strands. TR stands for top right strand, TL for top left strand, BR for bottom right strand, and BL for bottom left strand. C1 through C5 represent strand identifications for individual unstressed strands for macro-cathode.
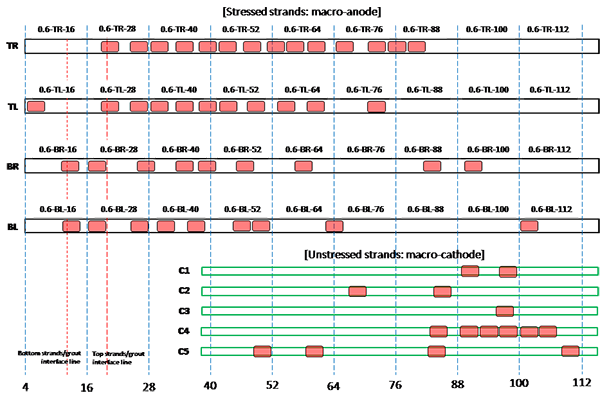
Figure 204. Illustration. Condition mapping of 0.4 percent chloride multi-strand specimen.

Figure 205. Illustration. Condition mapping of 0.6 percent chloride multi-strand specimen. This illustration shows condition mapping results of 0.6 percent chloride multi-strand specimens in a 12-inch grid system. Individual marks indicate where rust spots were observed on the stressed and unstressed strands. A total of 43 corrosion spots were observed on the stressed strands, and 15 were observed on the unstressed strands. TR stands for top right strand, TL for top left strand, BR for bottom right strand, and BL for bottom left strand. C1 through C5 represent strand identifications for individual unstressed strands for macro-cathode.
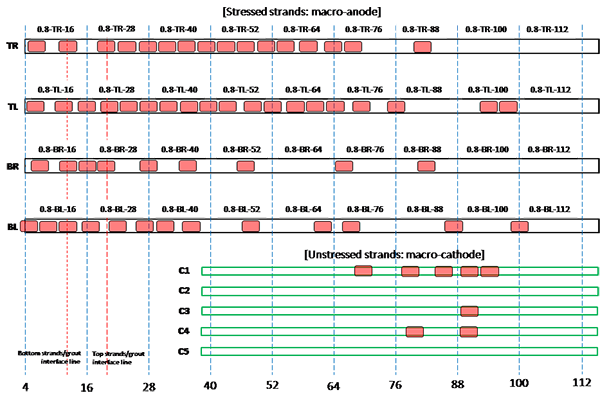
Figure 205. Illustration. Condition mapping of 0.6 percent chloride multi-strand specimen.

Figure 206. Illustration. Condition mapping of 0.8 percent chloride multi-strand specimen. This illustration shows condition mapping results of 0.8 percent chloride multi-strand specimens in a 12-inch grid system. Individual marks indicate where rust spots were observed on the stressed and unstressed strands. A total of 57 corrosion spots were observed on the stressed strands, and 8 were observed on the unstressed strands. TR stands for top right strand, TL for top left strand, BR for bottom right strand, and BL for bottom left strand. C1 through C5 represent strand identifications for individual unstressed strands for macro-cathode.
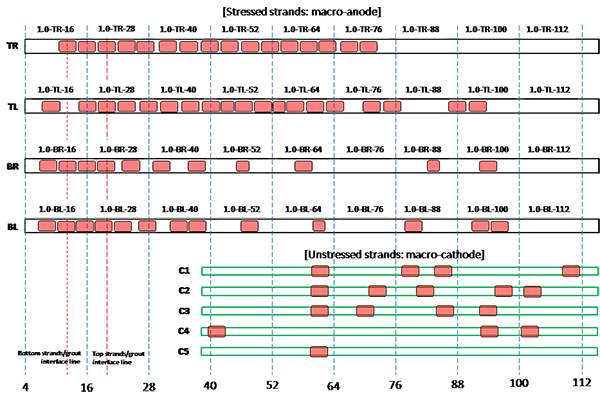
Figure 206. Illustration. Condition mapping of 0.8 percent chloride multi-strand specimen.

Figure 207. Illustration. Condition mapping of 1.0 percent chloride multi-strand specimen. This illustration shows condition mapping results of 1.0 percent chloride multi-strand specimens in a 12-inch grid system. Individual marks indicate where rust spots were observed on the stressed and unstressed strands. A total of 59 corrosion spots were observed on the stressed strands, and 17 were observed on the unstressed strands. TR stands for top right strand, TL for top left strand, BR for bottom right strand, and BL for bottom left strand. C1 through C5 represent strand identifications for individual unstressed strands for macro-cathode.
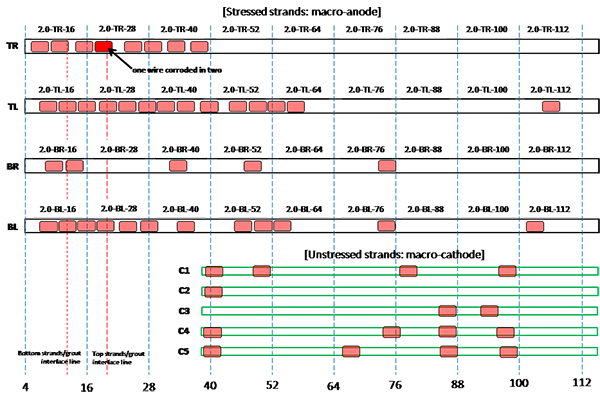
Figure 207. Illustration. Condition mapping of 1.0 percent chloride multi-strand specimen.

Figure 208. Illustration. Condition mapping of 2.0 percent chloride multi-strand specimen. This illustration shows condition mapping results of 2.0 percent chloride multi-strand specimens in a 12-inch grid system. Individual marks indicate where rust spots were observed on the stressed and unstressed strands. A total of 39 corrosion spots were observed on the stressed strands, and 15 were observed on the unstressed strands. TR stands for top right strand, TL for top left strand, BR for bottom right strand, and BL for bottom left 
strand. C1 through C5 represent strand identifications for individual unstressed strands for macro-cathode.
Figure 208. Illustration. Condition mapping of 2.0 percent chloride multi-strand specimen.

Figure 209 shows an intact strand near the void/grout interface of 0.08 percent chloride specimen, and figure 210 shows the as-extracted condition of four interface segments of the same specimen.
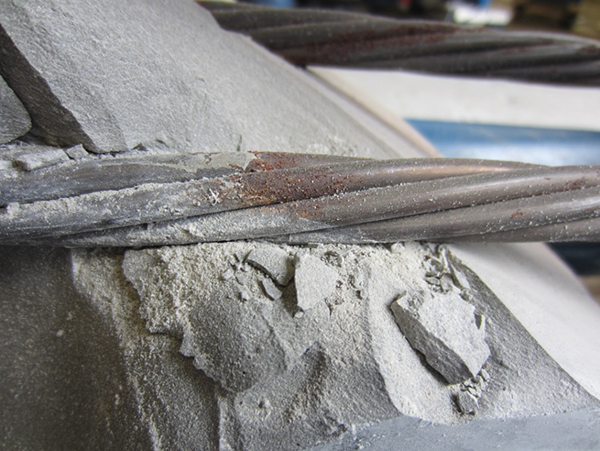
Figure 209. Photo. Exposed strand at the void/grout interface of 0.08 percent chloride multi-strand specimen. This photo shows an intact stressed strand (no corrosion) near the void/grout interface of 0.08 percent chloride multi-strand specimen.
Figure 209 . Photo. Exposed strand at the void/grout interface of 0.08 percent chloride multi-strand specimen.
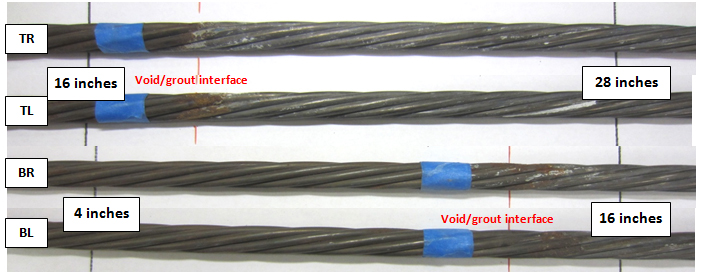
Figure 210. Photo. As-extracted condition of four stressed strands near the void/grout interface of 0.08 percent chloride multi-strand specimen. This photo shows as-extracted condition of four interface segments of the same specimen shown in figure 209. No recognizable corrosion damage was found.
Figure 210. Photo. As-extracted condition of four stressed strands near the void/grout interface of 0.08 percent chloride multi-strand specimen.

Since the void/grout interface was sloped at a 25-degree angle, the 4-to-16-inch segments of the BL and BR strands and 16-to-28-inch segments of the TL and TR strands were exposed at the interface (see figure 37). The labels included in figure 210 provide relative position of each segment with respect to the distance from the upper anchor plate and the interface. Only minor corrosion can be seen on the interface segments. Figure 211 shows a stressed strand of 0.8 percent chloride specimen showing moderate corrosion at the interface. Figure 212 shows the interface segments of the same specimen, with BL and BR exhibiting minor corrosion and TL and TR exhibiting moderate corrosion.
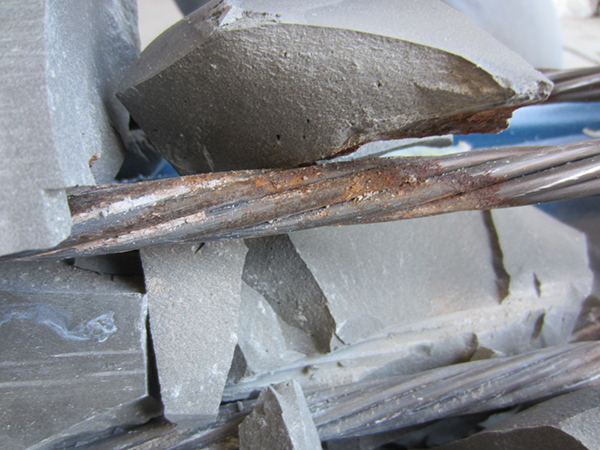
Figure 211. Photo. Exposed strand at the interface of 0.8 percent chloride multi-strand specimen. This photo shows a stressed strand of 0.8 percent chloride multi-strand specimen showing moderate corrosion at the interface
Figure 211 . Photo. Exposed strand at the interface of 0.8 percent chloride multi-strand specimen.
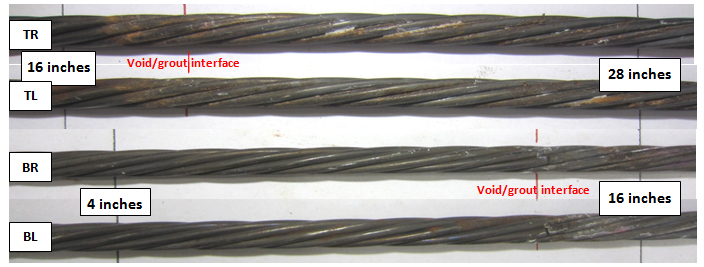
Figure 212. Photo. As-extracted condition of four stressed strands at the void/grout interface of 0.8 percent chloride multi-strand specimen. This photo shows four interface segments of the same specimen as shown in figure 211. Segments BL and BR exhibited minor corrosion, and segments TL and TR exhibited moderate corrosion.
Figure 212. Photo. As-extracted condition of four stressed strands at the void/grout interface of 0.8 percent chloride multi-strand specimen.

The specimens containing 0.08, 0.8, and 1.0 percent chloride showed overall good condition at the interface even after 5.1 fl oz of distilled water was added. Their interface conditions observed during the accelerated corrosion testing are shown in figure 157, figure 161, and figure 162, respectively. The specimens containing 0.2 and 0.6 percent chloride also showed good condition with minor corrosion at the interface. Their interface photographs are shown in figure 158 and figure 160, respectively.

Severe corrosion was observed at the interfaces of three other specimens containing 0, 0.4, and 2.0 percent chloride. Figure 213 shows the void/grout interface of 0 percent chloride specimen upon removal of the PVC duct. The interface was covered with a thick black deposit. Figure 214 and figure 215 show a top section of the interface and its cross section, respectively. The black deposit layer appeared to be porous and contained numerous small black particles. Figure 216 shows two pairs of the stressed strand segments that passed through the void/grout interface.

Figure 217 and figure 218 show close-up views of two interface segments shown in figure 216. Severe corrosion took place despite a chloride-free condition.

Figure 213. Photo. Strands at the void/grout interface of 0 percent chloride multi-strand specimen. This photo shows the void/grout interface of 0 percent chloride multi-strand specimen upon removal of the polyvinyl chloride duct. The interface was covered with a thick black deposit.
Figure 213. Photo. Strands at the void/grout interface of 0 percent chloride multi-strand specimen.
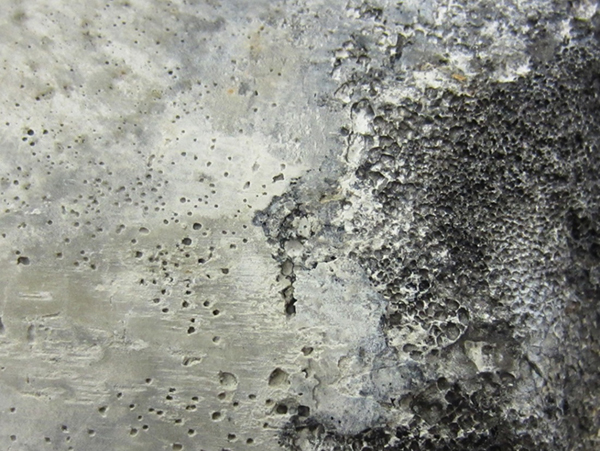
Figure 214. Photo. Close-up plan view of the void/grout interface (top section). This photo shows a top section plan view of the void/grout interface of 0 percent chloride multi-strand specimen. The black deposit layer appeared to be porous and contains numerous small black particles.
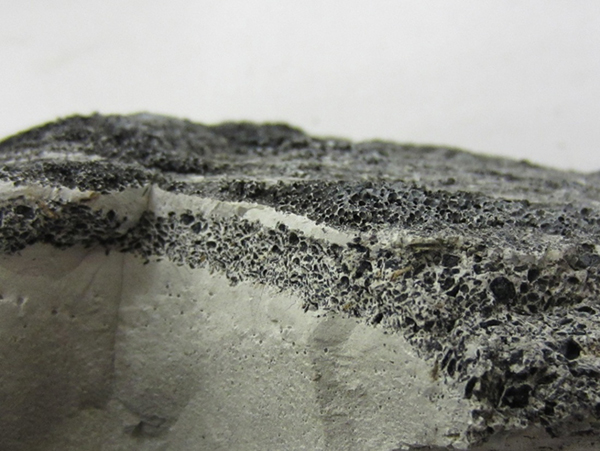
Figure 214. Photo. Close-up plan view of the void/grout interface (top section).

Figure 215. Photo. Cross section of the void/grout interface (top section). This photo shows a top cross-sectional view of the void/grout interface of 0 percent chloride multi-strand specimen. A black deposit layer is present and appears to be porous and contains numerous small black particles.
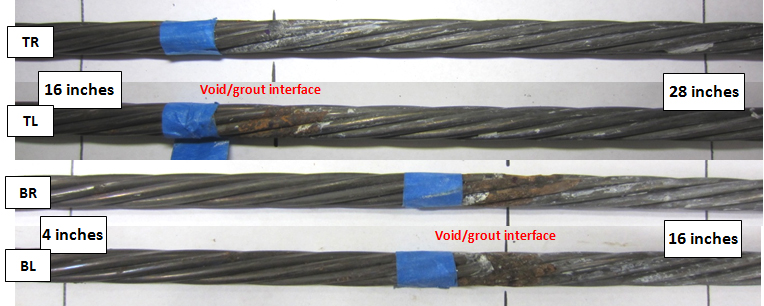
Figure 215. Photo. Cross section of the void/grout interface (top section).

Figure 216. Photo. As-extracted condition of the stressed strands at the void/grout interface of 0 percent chloride multi-strand specimen. This photo shows two pairs of the stressed strand segments that passed through the void/grout interface of 0 percent chloride multi-strand specimen. Severe corrosion is present despite a chloride-free condition.
Figure 216. Photo. As-extracted condition of the stressed strands at the void/grout interface of 0 percent chloride multi-strand specimen.
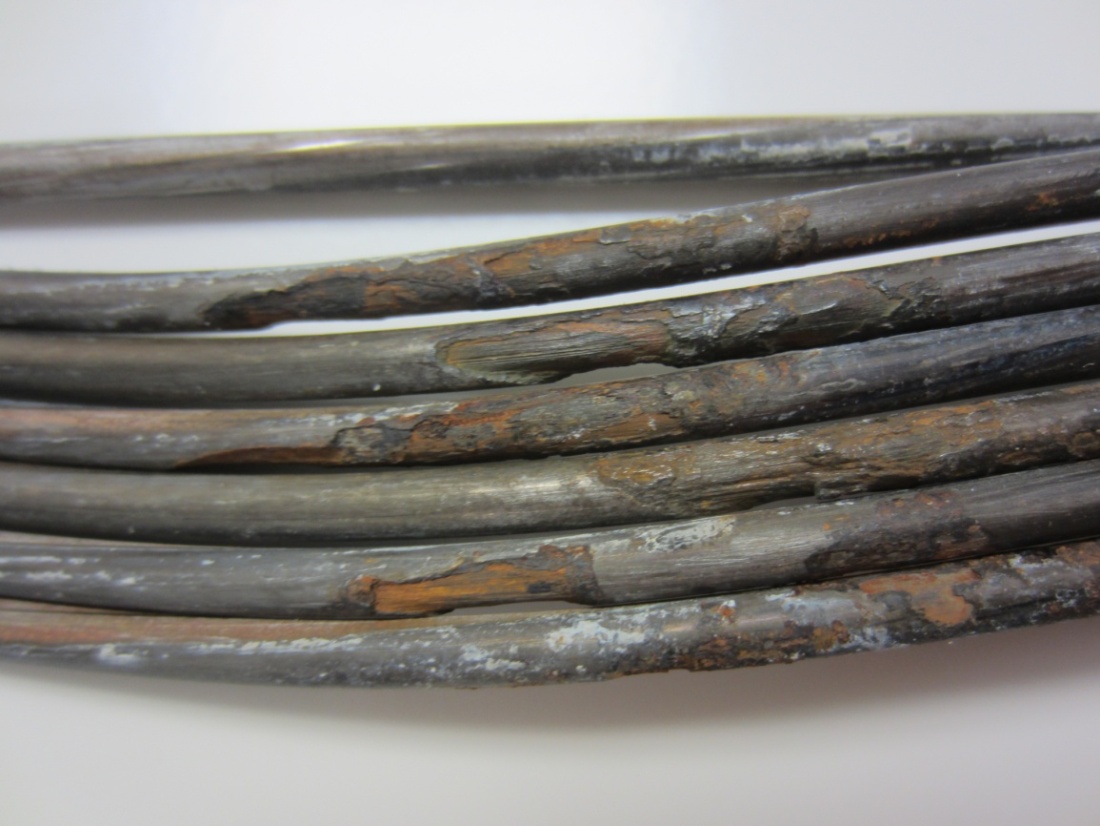
Figure 217. Photo. As-extracted condition of a stressed segment passed through the contaminated void/grout interface of 0 percent chloride multi-strand specimen. This photo shows a close-up view of an interface segment shown in figure 216. Severe corrosion is visible despite a chloride-free condition.
Figure 217. Photo. As-extracted condition of a stressed segment passed through the contaminated void/grout interface of 0 percent chloride multi-strand specimen.
Figure 218. Photo. As-extracted condition of another stressed segment passed through the contaminated void/grout interface of 0 percent chloride multi-strand specimen. This photo shows a close-up view of another interface segment shown in figure 216. Severe corrosion is visible despite a chloride-free condition.
Figure 218. Photo. As-extracted condition of another stressed segment passed through the contaminated void/grout interface of 0 percent chloride multi-strand specimen.

Figure 219 shows the condition of stressed strands just behind the void/grout interface of the 0.4 percent chloride specimen. It was suspected in the middle of the detensioning process that some wires must have fractured under the tension. Upon grout removal, it was discovered that three wires of a stressed strand were indeed severed. The corroded strand is indicated by the red arrow in figure 219. Figure 220 and figure 221 show details of the broken wires. It was obvious that they failed during the detensioning process caused by excessive stress concentrated in the corroded areas with significant section loss. This specimen also had black deposit on the interface as indicated by the gray arrows in figure 219. Figure 222 shows a grout piece taken from the 12 o’clock orientation near the interface of the 0.4 percent chloride specimen. A bleed channel and poor grout condition can be seen. Figure 223 shows a cross section of the same piece, and a porous layer and black particles can be seen. They looked identical to the grout fragment of 0 percent chloride specimen shown in figure 215.
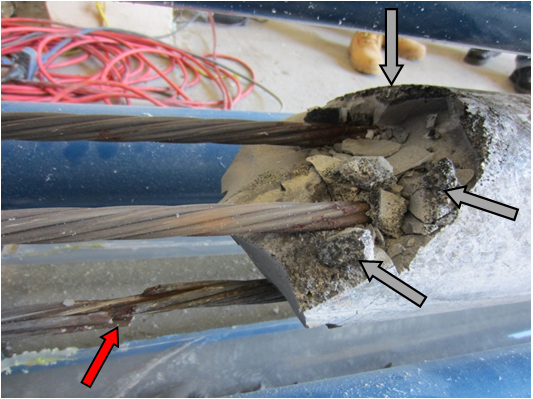
Figure 219. Photo. Severely corroded strand with three broken wires at the void/grout interface of 0.4 percent chloride multi-strand specimen. This photo shows severely corroded condition of stressed strands just behind the void/grout interface of 0.4 percent chloride multi-strand specimen. Three wires broken by corrosion are indicated by a red arrow. Black deposit on the interface is indicated by gray arrows.
Figure 219. Photo. Severely corroded strand with three broken wires at the void/grout interface of 0.4 percent chloride multi-strand specimen.
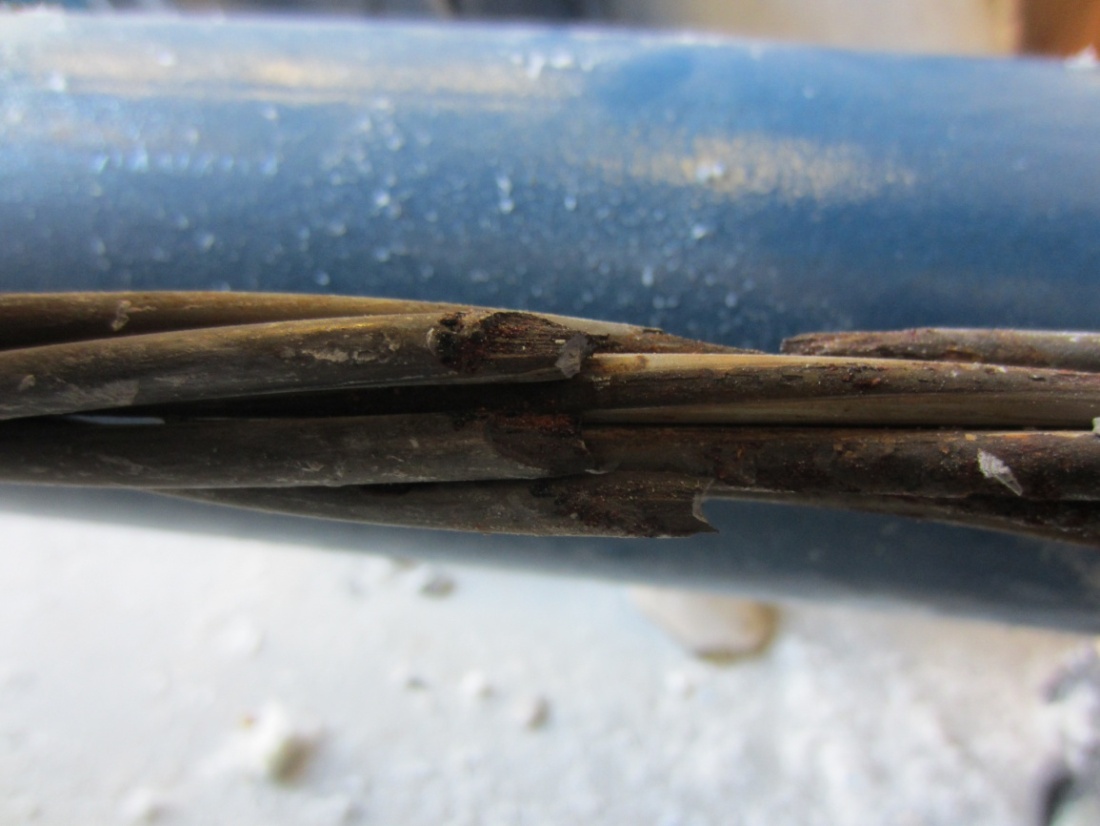
Figure 220. Photo. Close-up view of the severely corroded strand shown in figure 219. This photo shows a close-up view of the broken wires in figure 219. The wires failed during the de-tensioning process due to excessive stress concentrated in the corroded areas with significant section loss.
Figure 220 . Photo. Close-up view of the severely corroded strand shown in figure 219 .
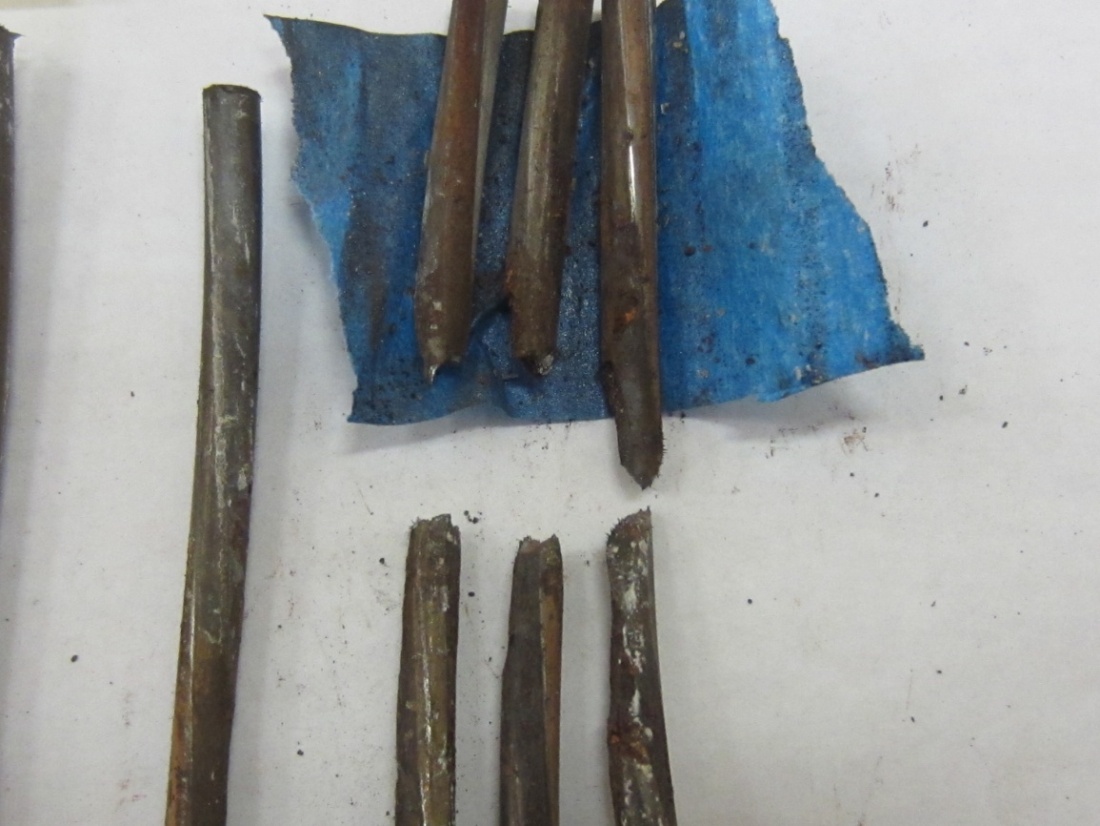
Figure 221. Photo. Close-up view of the broken wires shown in figure 220. This photo also shows a close-up view of broken wires shown in figure 220 after they were dismantled.
Figure 221. Photo. Close-up view of the broken wires shown in figure 220 .
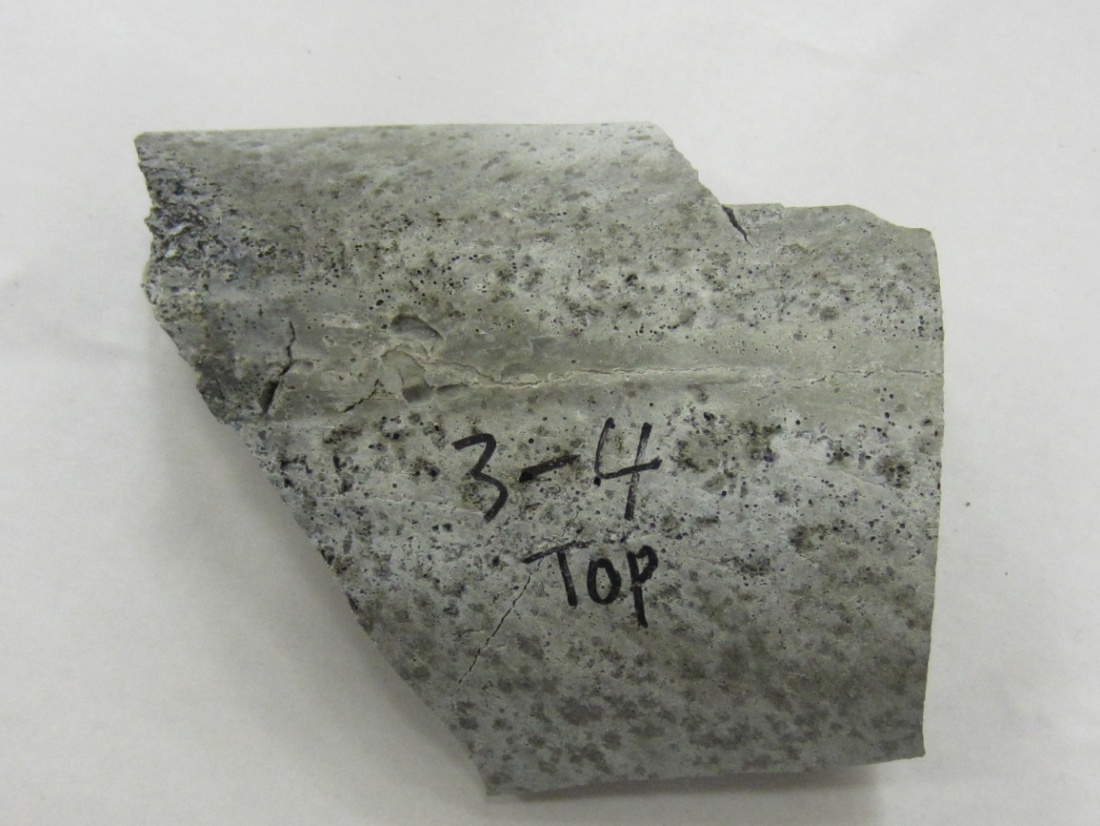
Figure 222. Photo. Top side grout piece exhibiting bleed channel and porous grout   removed from 0.4 percent chloride specimen. This photo shows a grout piece taken from near the interface of 0.4 percent chloride multi-strand specimen. A bleed channel and poor grout condition are visible.
Figure 222. Photo. Top side grout piece exhibiting bleed channel and porous grout removed from 0.4 percent chloride specimen.
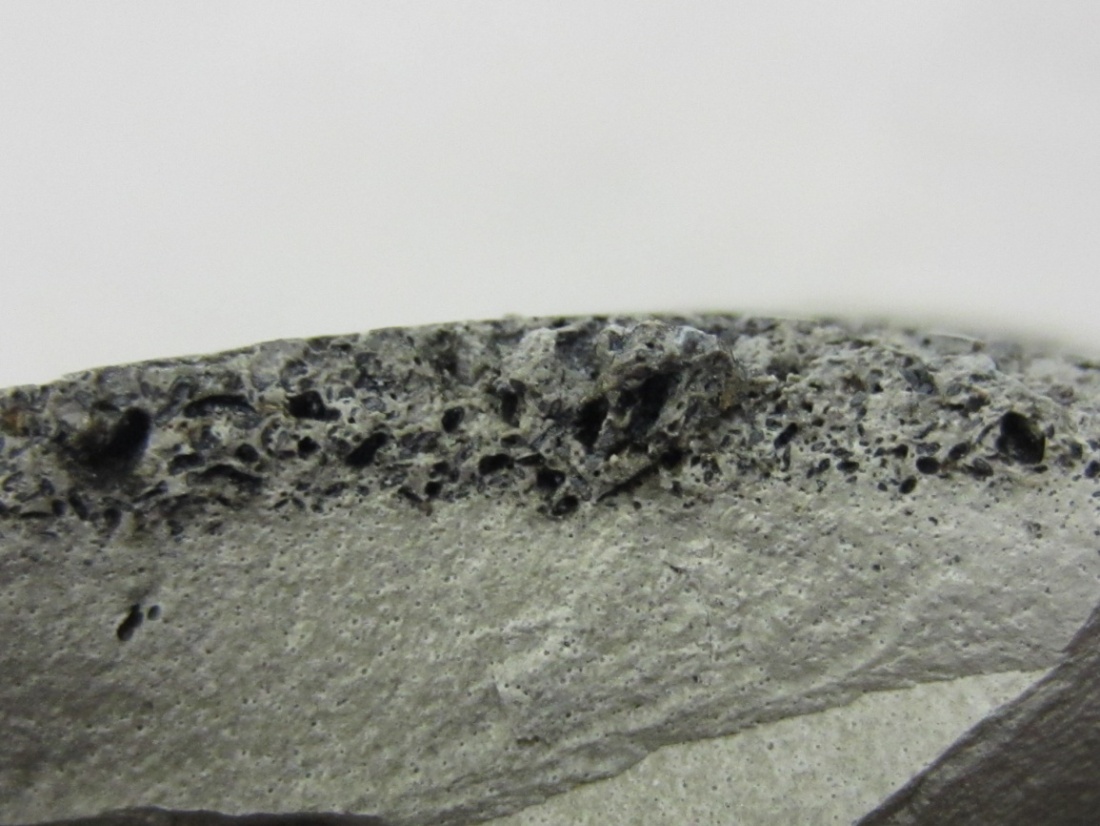
Figure 223. Photo. Cross section of the grout piece shown in figure 222. This photo shows a cross-sectional view of the same piece of grout shown in figure 222. A porous layer and black particles are visible.
Figure 223. Photo. Cross section of the grout piece shown in figure 222.

The porous grout defect is not new. In fact, FDOT, the Texas Department of Transportation, and VDOT reported the same “grout segregation” phenomenon pertaining to a particular grout product. Figure 224 and figure 225, taken by the author of this report, show VDOT’s field trial result of two grout products. As observed in the present study, the same grout product used in VDOT’s trial also exhibited the segregated grout along the bleed channel on the 12 o’clock orientation (see figure 224), while the other product yielded a good quality, hardened grout (see figure 225).
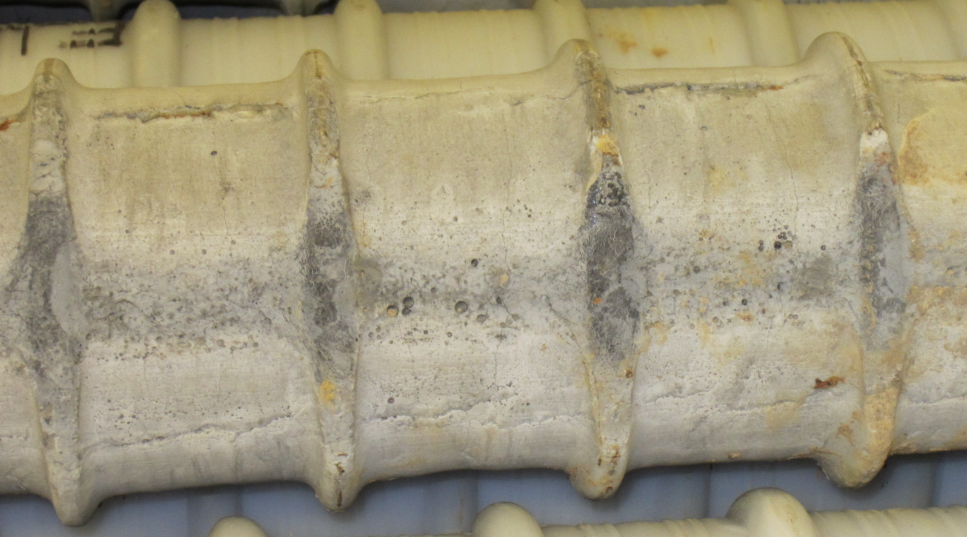
Figure 224. Photo. Defective grout along a bleed channel. This photo shows segregated grout along the bleed channel.
Figure 224 . Photo. Defective grout along a bleed channel.

Figure 225. Photo. Normal grout. This photo shows a good quality, hardened grout.
Figure 225. Photo. Normal grout.

Figure 226 shows another stressed strand of the same 0.4 percent chloride specimen that experienced similar significant section loss and black deposit, as indicated by the arrows.
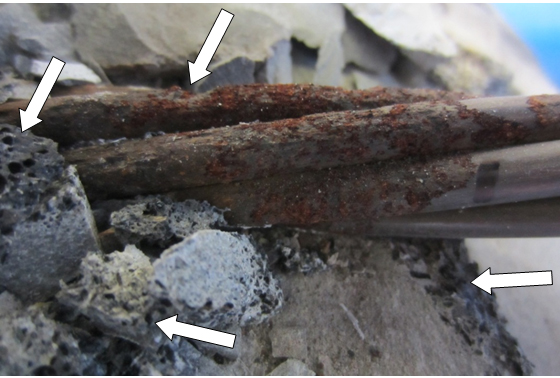
Figure 226. Photo. Another exposed strand at the void/grout interface of 0.4 percent chloride multi-strand specimen. This photo shows stressed strand of 0.4 percent chloride multi-strand specimen that experienced significant section loss. Black deposit is indicated by white arrows.
Figure 226. Photo. Another exposed strand at the void/grout interface of 0.4 percent chloride multi-strand specimen.

Discovery of severe corrosion in the absence of chloride triggered a small lab investigation using an ion chromatography instrument to analyze water-soluble (free) sulfate ions in the black particles removed from the 0 percent chloride specimen and grout fragments retrieved from the void/grout interfaces of the 0, 0.2, and 0.4 percent chloride specimens. Some bulk grout powder samples collected earlier for chloride analysis and original grout powder samples were also analyzed as controls. Table 10 summarizes the analysis results. It was determined that the grout powder contained 0.9 percent of water-soluble sulfate ions by weight of cement, whereas the black particles contained 2.8 percent water-soluble sulfate ions by weight of cement. The high sulfate concentration was also found in the black deposit sample scrapped off the interface of the 0 percent chloride specimen. The elevated level of free sulfate ions is thought to be responsible for the extraordinary corrosion damage observed in the chloride-free grout. The other interface samples (0.08 and 0.2 percent chloride) and grout powder samples did not reveal high levels of free sulfate ions because they did not contain the black particles. Although grout fragments of the 0.4 percent chloride specimen was also suspected to suffer the sulfate induced corrosion, they did not contain sufficient black deposit material to perform ion chromatography analysis, and it could not be confirmed that high concentration of free sulfate ions on its interface was also responsible for corrosion failure of three wires.

Table 10. Sulfate ion concentrations in the samples.

Sample ID Sample Weight (oz) Percent by Grout Weight Percent by Cement Weight
Black particles collected from void/grout interface of 0 percent chloride specimen 0.07 1.5 2.8
Top layer scraped from void/grout interface of 0 percent chloride specimen 0.175 1.5 2.7
Top layer scraped from void/grout interface of 0.2 percent chloride specimen 0.175 0.4 0.7
Top layer scraped from void/grout interface of 0.4 percent chloride specimen 0.175 0.1 0.1
Grout powder sample from 0 percent chloride specimen 0.07 0.0 0.1
Grout powder sample from 0.08 percent chloride specimen 0.07 0.1 0.1
Grout powder sample from 0.4 percent chloride specimen 0.07 0.0 0.0
Original grout powder 0.175 0.5 0.9

If proper hydration of grout takes place, the sulfate ions in the dry grout should be chemically bound evenly in the cement paste, and little can be leached out in deionized water. This binding effect can be confirmed with 0 to 0.1 percent free sulfate concentrations by weight of cement in the hardened grout. It is speculated that when grout segregation occurs, free sulfate ions and black particles, presumably some sort of carbon black component of silica fume, can float to the top along the 12 o’clock bleed channel and form the corrosive deposit layer containing an excessive amount of free sulfate ions on top of the segregated and porous void/grout interface. The porous layer also appeared to hold water longer, as indicated by arrows in figure 156 and figure 159. It is unknown at this time how and why the segregated grout problem occurred only in some specimens even though the grouting work for every specimen was done in a consistent way.

Figure 227 and figure 228 show the condition of the exposed stressed strands in 2.0 percent chloride specimen after grout was removed near the void/grout interface. A severely corroded strand having a broken wire at the interface is shown. The broken wire must have been corroded for an extended period of time judging by the thick corrosion products formed on the failed section. The failed strand had been covered with black corrosion product formed at the interface, as shown in figure 163. It is not known whether the corrosion product contained a high level of free sulfate ions that could be also responsible for the intensive wire corrosion.
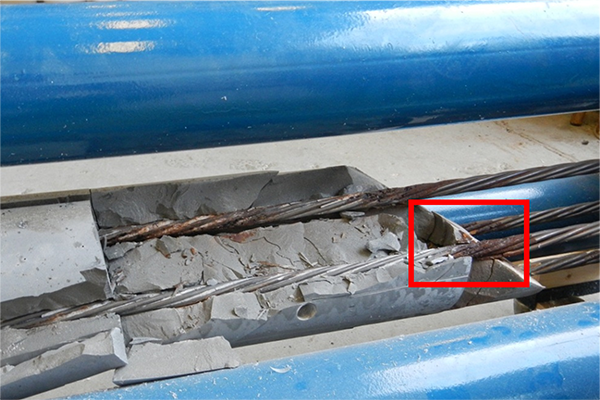
Figure 227. Photo. Severely corroded strand with one broken wire revealed at the void/grout interface of 2.0 percent chloride multi-strand specimen. This photo shows the condition of the exposed stressed strands in 2.0 percent chloride multi-strand specimen after grout was removed near the void/grout interface. A severely corroded strand with a broken wire at the interface is visible.
Figure 227. Photo. Severely corroded strand with one broken wire revealed at the void/grout interface of 2.0 percent chloride multi-strand specimen.
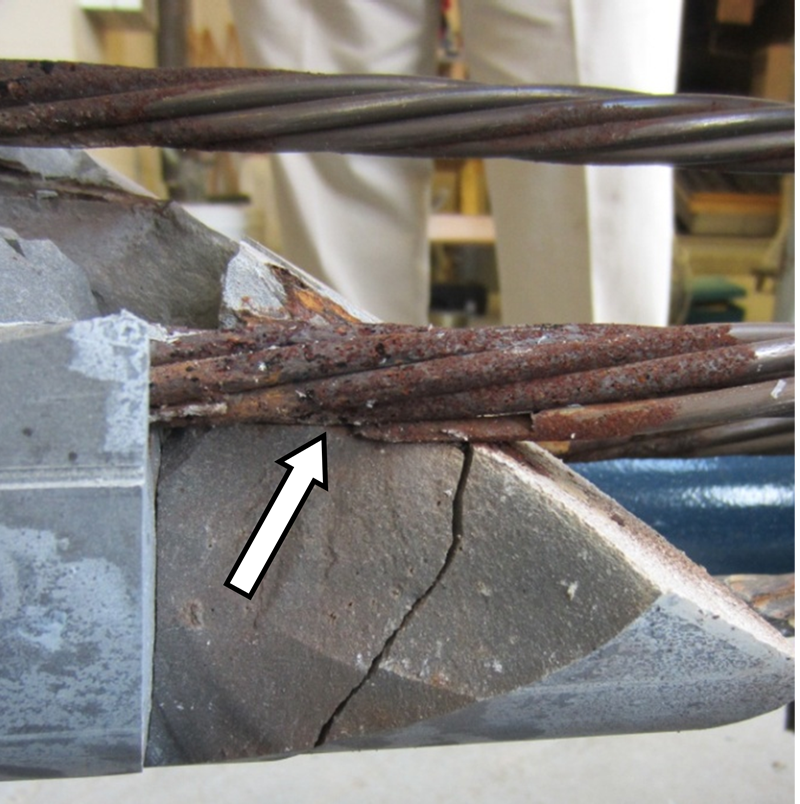
Figure 228. Photo. Close-up view of severely corroded strand with one broken wire revealed at the void/grout interface of 2.0 percent chloride multi-strand specimen. This photo shows a close-up view of a severely corroded strand with one broken wire at the void/grout interface of a 2.0 percent chloride multi-strand specimen.
Figure 228. Photo. Close-up view of severely corroded strand with one broken wire revealed at the void/grout interface of 2.0 percent chloride multi-strand specimen.

Figure 229 also shows corrosion of a stressed strand developed in grout containing the highest chloride concentration. The 1.0 percent or less chloride concentration specimens did not exhibit such an active corrosion in the grout-covered section.

Figure 230 shows three corroding unstressed strands along with two stressed strands in 2.0 percent chloride specimen. As will be discussed later, all of the rust spots formed on the unstressed strands were superficial even in the highest chloride concentration.
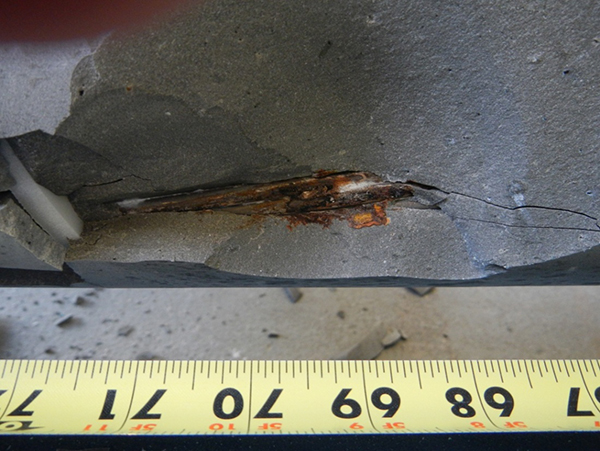
Figure 229. Photo. Active corrosion of a stressed strand inside the 2.0 chloride grout 70 inches from the lower anchorage. This photo shows active corrosion of a stressed strand inside the 2.0 percent chloride grout located 70 inches from the lower anchorage.
Figure 229. Photo. Active corrosion of a stressed strand inside the 2.0 percent chloride grout 70 inches from the lower anchorage.
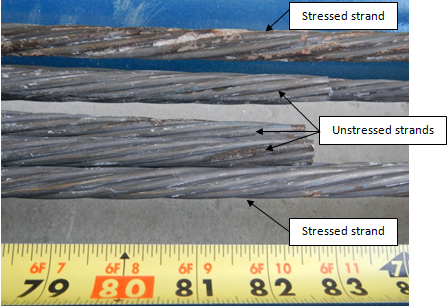
Figure 230. Photo. Corrosion of unstressed strands in 2.0 percent chloride multi-strand specimen. This photo shows three corroding unstressed strands along with two stressed strands in a 2.0 percent chloride multi-strand specimen.
Figure 230. Photo. Corrosion of unstressed strands in 2.0 percent chloride multi-strand specimen.

Table 11 and table 12 summarize physical conditions of the 12-inch strand segments extracted from the void/grout interface (4 to 16 inches and 16 to 28 inches) and those embedded in the grout, respectively.

Table 11. Condition summary of interface segments of multi-strand specimens.

Chloride Concentration (Percent by Cement Weight) Number of Segments Showing Superficial Rust (Percent) Number of Segment Wires Showing Heavy Rust Requiring Acid Cleaning (Percent)
Stressed: Total 8 Segments per Specimen Unstressed Stressed: 56 Wires per Specimen (Total 8 Segments × 7 Wires/ Specimen) Unstressed
0.00 4 (50.0 percent) None 17 (30.4 percent) None
0.08 6 (75.0 percent) 1 (1.8 percent)
0.20 6 (75.0 percent) 0 (0 percent)
0.40 7 (87.5 percent) 20 (35.7 percent)
0.60 7 (87.5 percent) 2 (3.6 percent)
0.80 8 (100 percent) 13 (23.2 percent)
1.00 8 (100 percent) 23 (41.1 percent)
2.00 8 (100 percent) 36 (64.3 percent)

Table 12. Condition summary of in-grout strand segments of multi-strand specimens.

Chloride Concentration (Percent by Cement Weight) Number of Segments Showing Superficial Rust (Percent) Number of Segment Wires Showing Heavy Rust Requiring Acid Cleaning (Percent)
Stressed: Total 28 Segments per Specimen Unstressed: Total 30 Segments per Specimen Stressed: 196 Wires per Specimen (Total 28 Segments × 7 Wires/ Specimen) Unstressed: 210 Wires per Specimen (Total 30 Wires × 7 Wires/Segment
0.00 0 (0 percent) 0 (0 percent) 0 (0 percent) 0 (0 percent)
0.08 0 (0 percent) 0 (0 percent) 0 (0 percent) 0 (0 percent)
0.20 2 (7.1 percent) 0 (0 percent) 0 (0 percent) 0 (0 percent)
0.40 10 (35.7 percent) 2 (6.7 percent) 2 (1.0 percent) 0 (0 percent)
0.60 19 (67.9 percent) 11 (36.7 percent) 0 (0 percent) 0 (0 percent)
0.80 22 (78.6 percent) 6 (20.0 percent) 30 (15.3 percent) 0 (0 percent)
1.00 20 (71.4 percent) 16 (53.3 percent) 44 (22.4 percent) 0 (0 percent)
2.00 12 (42.9 percent) 14 (46.7 percent) 34 (17.3 percent) 0 (0 percent)

Because the majority of the interface segments developed rust in every chloride concentration, only the in-grout strand conditions presented in table 12 are discussed here. Even though rust first appeared on two stressed segments (or 7.1 percent) of 0.2 percent chloride specimen, 0.4 percent chloride is considered the lowest concentration with appreciable number of segments exhibiting corrosion: 10 stressed segments (or 35.7 percent) and two unstressed segments (or 6.7 percent). Figure 231 and figure 232 show random carbonation test results of 0.6 and 0.8 percent chloride specimens. Based on the dark pink color, the pH of the grout was confirmed to be above 10.0. Therefore, it was concluded that carbonation did not occur during the accelerated corrosion testing.
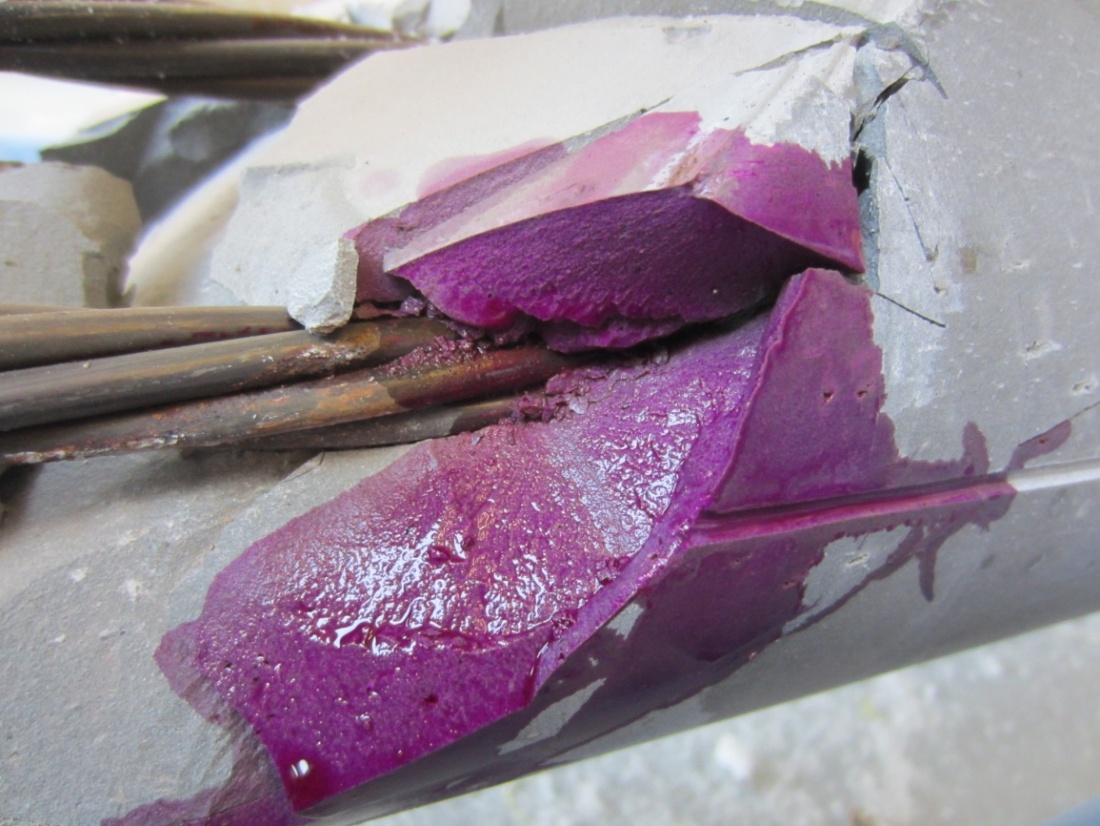
Figure 231. Photo. Carbonation testing results of 0.6 percent chloride multi-strand specimens. This photo shows random carbonation test results of 0.6 percent chloride multi-strand specimens. The specimens are a dark pink color, and the pH of the grout was confirmed to be above 10. As a result, no carbonation had occurred.
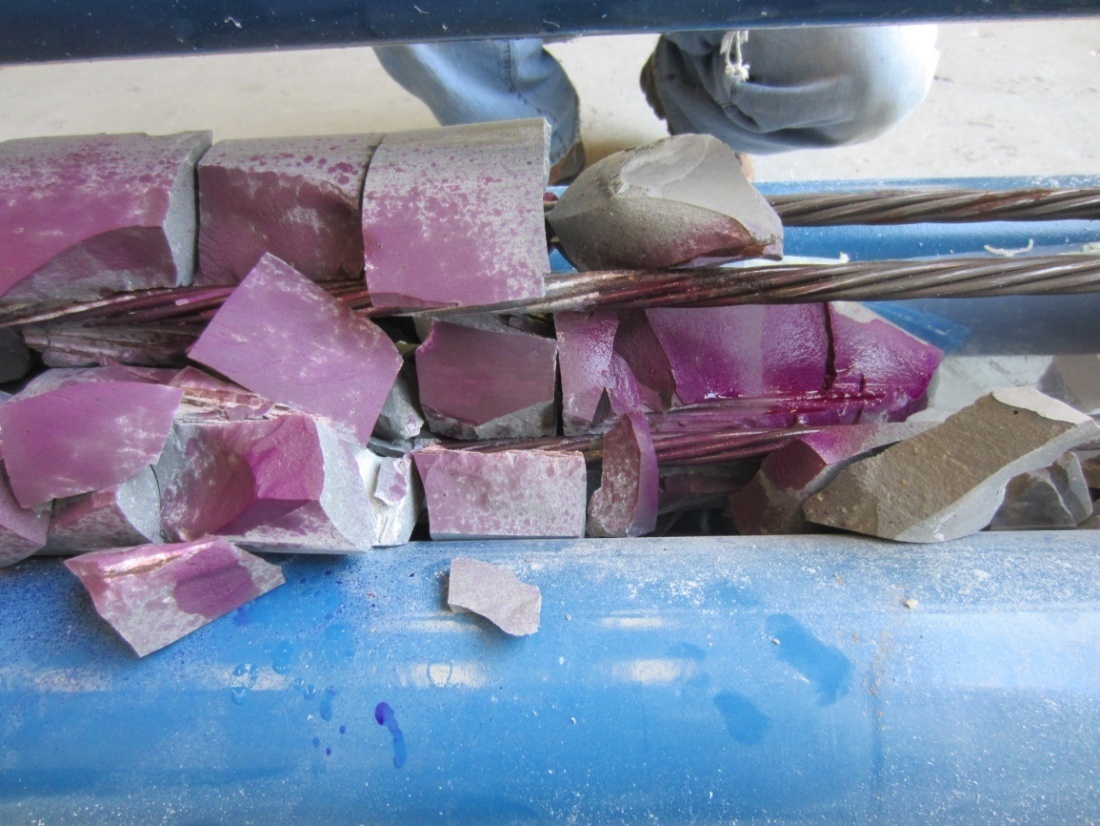
Figure 231. Photo. Carbonation testing results of 0.6 percent chloride multi-strand specimens.

Figure 232. Photo. Carbonation testing results of 0.8 percent chloride multi-strand specimens. This photo shows random carbonation test results of 0.8 percent chloride multi-strand specimens. The specimens are a dark pink color, and the pH of the grout was confirmed to be above 10. As a result, no carbonation had occurred.
Figure 232. Photo. Carbonation testing results of 0.8 percent chloride multi-strand specimens.

During the grout demolition, localized wet and soft grout was uncovered in 0.8 and 1.0 percent chloride specimens. As-discovered conditions are shown in figure 233 and figure 234, respectively. Despite the abnormal (wet and soft) grout condition, no corrosion was found in these areas. FDOT observed severe corrosion beneath the same type of defective grout. It is unknown at this time how the wet grout was formed and why corrosion did not occur.
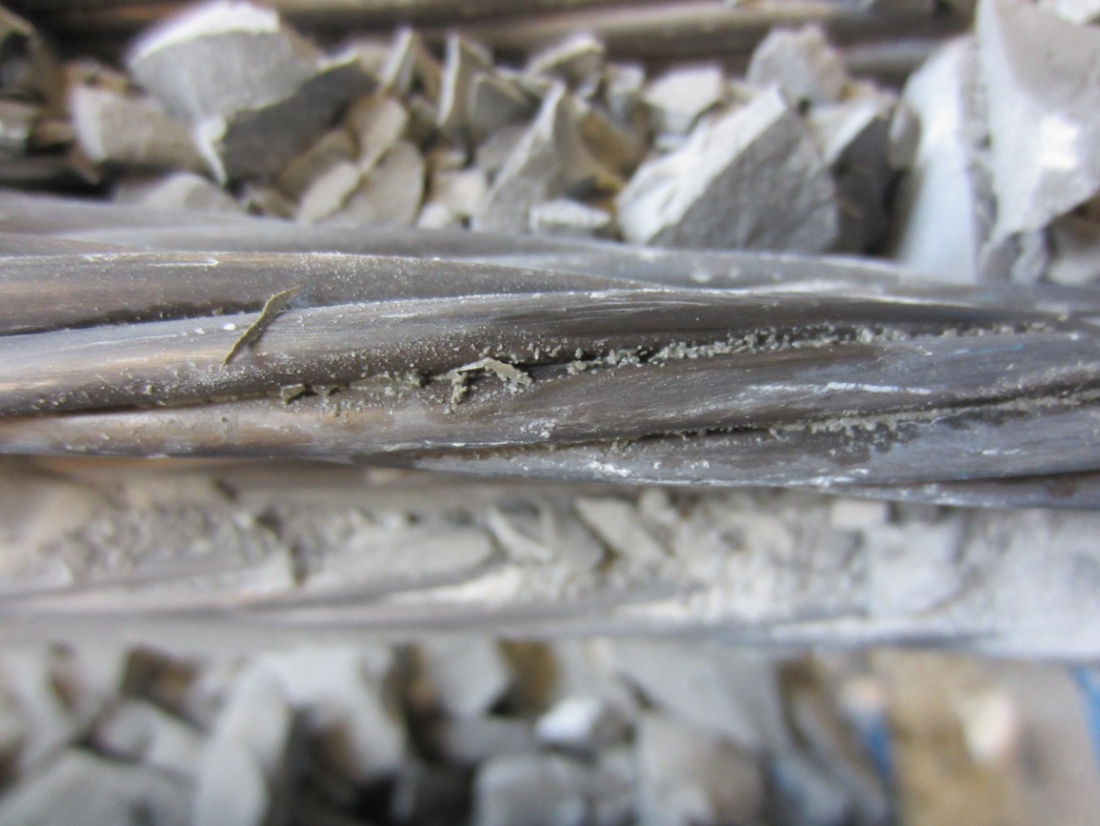
Figure 233. Photo. Wet and soft grout found in 0.8 percent chloride multi-strand specimen. This photo shows localized wet and soft grout uncovered in a 0.8 percent chloride multi-strand specimen.
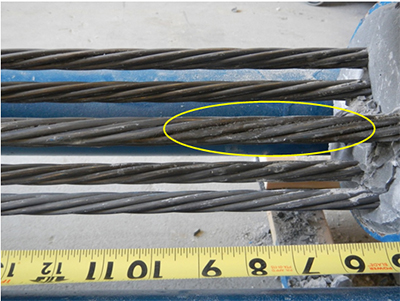
Figure 233. Photo. Wet and soft grout found in 0.8 percent chloride multi-strand specimen.

Figure 234. Photo. Wet and soft grout found in 1.0 percent chloride multi-strand specimen. This photo shows localized wet and soft grout uncovered in a 1.0 percent chloride multi-strand specimen.
Figure 234. Photo. Wet and soft grout found in 1.0 percent chloride multi-strand specimen.

When the PT strands were dismantled, it was observed that hardened grout filled some interstices formed by the outer six wires and the center wire. Figure 235 shows a hardened grout layer stuck in an interstice when an outer wire was removed. Moderately corroded wires can be seen. Figure 236 shows a rust-stained small grout piece fell from the strand shown in figure 235. It has been known that water can get into the wire interstices and induce crevice corrosion. These photographs document that chloride-contaminated fresh grout can also smear into the interstices to induce the same type of corrosion there.
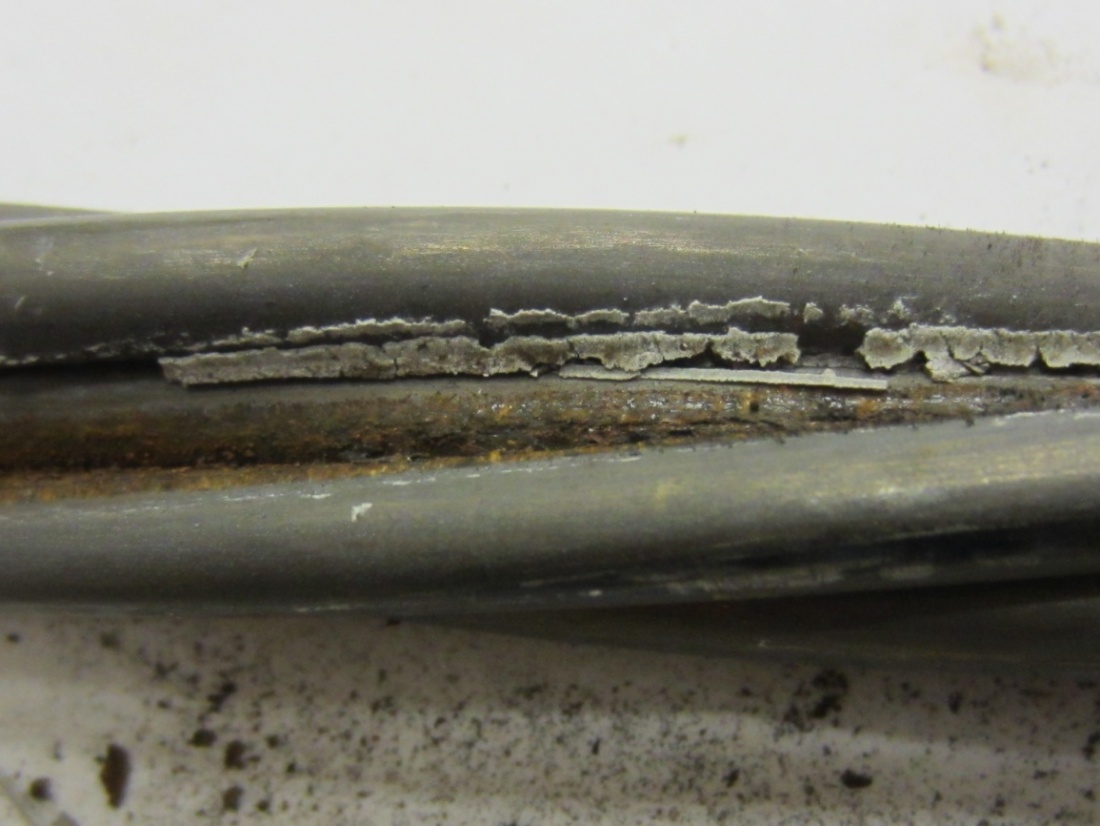
Figure 235. Photo. Grout fragment found inside an interstice surrounded by corroding wires. This photo shows a hardened grout layer stuck in an interstice when an outer wire was removed. Moderately corroded wires are visible.
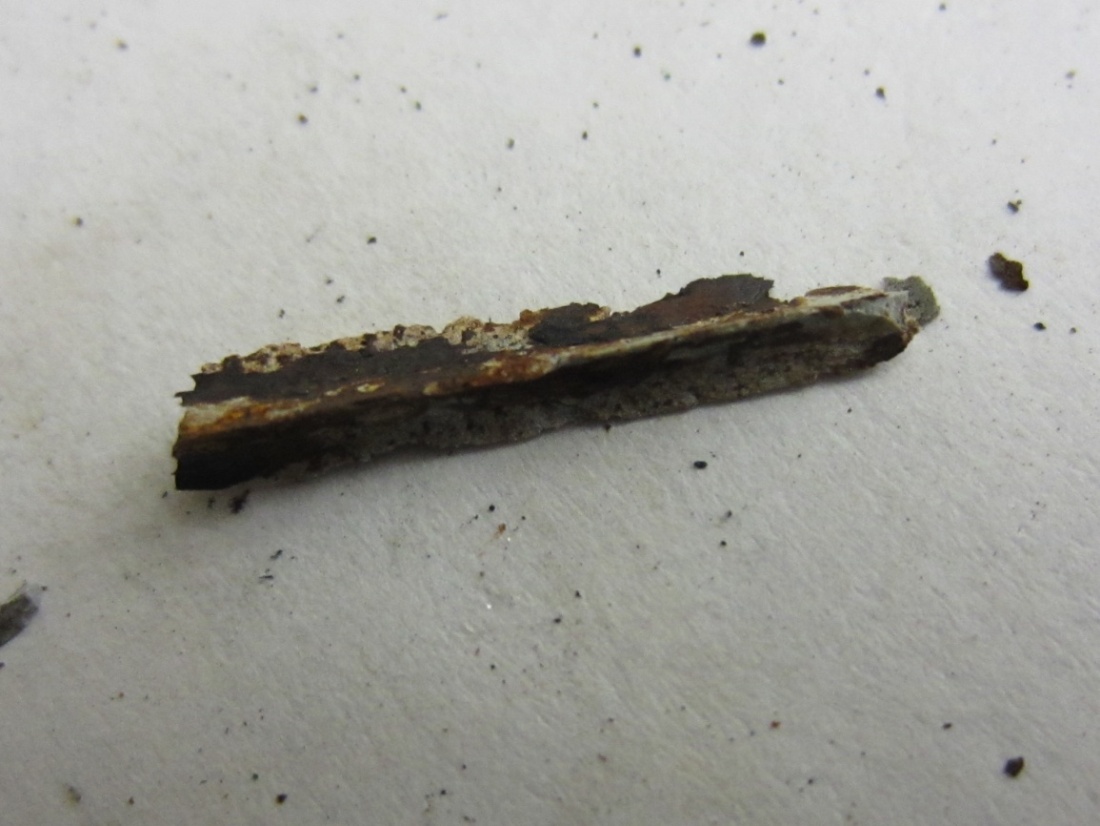
Figure 235. Photo. Grout fragment found inside an interstice surrounded by corroding wires.

Figure 236. Photo. Heavily rust-stained grout fragment that fell from the strand shown in figure 235. This photo shows a rust-stained small piece of grout that fell from the strand shown in figure 235.
Figure 236 . Photo. Heavily rust-stained grout fragment that fell from the strand shown in figure 235.

CORROSION DAMAGE MEASUREMENT DATA

The acid-cleaned wires were visually examined, and those that appeared to have pits deeper than 2 mil were set aside for pit depth measurement. Figure 237 through figure 246 show representative pitting corrosion morphologies exhibiting different levels of damage. Also, figure 247 and figure 248 show crevice corrosion damage found on a 0.4 percent and 0.8 percent chloride multi-strand specimen, respectively. The deepest pit found in this study was 60 mil, which is 30 percent of the wire diameter.
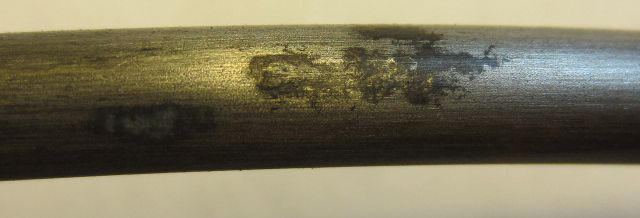
Figure 237. Photo. Stressed and voided 0.4 percent chloride single-strand specimen (pit depth < 2 mil). This photo shows minor pitting corrosion (pit depth was less than 2 mil) observed on a stressed 0.4 percent chloride single-strand specimen with void.
Figure 237. Photo. Stressed and voided 0.4 percent chloride single-strand specimen (pit depth < 2 mil).
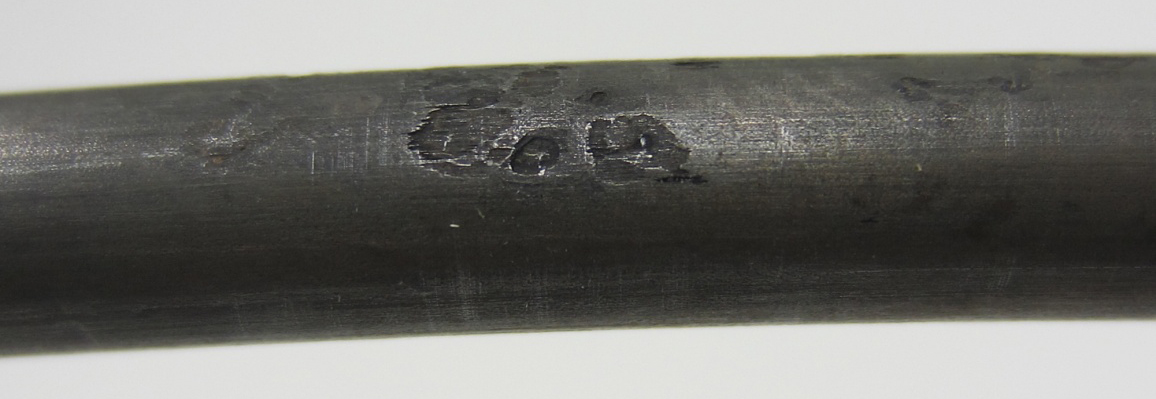
Figure 238. Photo. Stressed and fully grout 0.8 percent chloride single-strand specimen (pit depth ~2 mil). This photo shows minor pitting corrosion (pit depth was roughly 2 mil) observed on a stressed and fully grouted 0.8 percent chloride single-strand specimen.
Figure 238. Photo. Stressed and fully grouted 0.8 percent chloride single-strand specimen (pit depth ~2 mil).
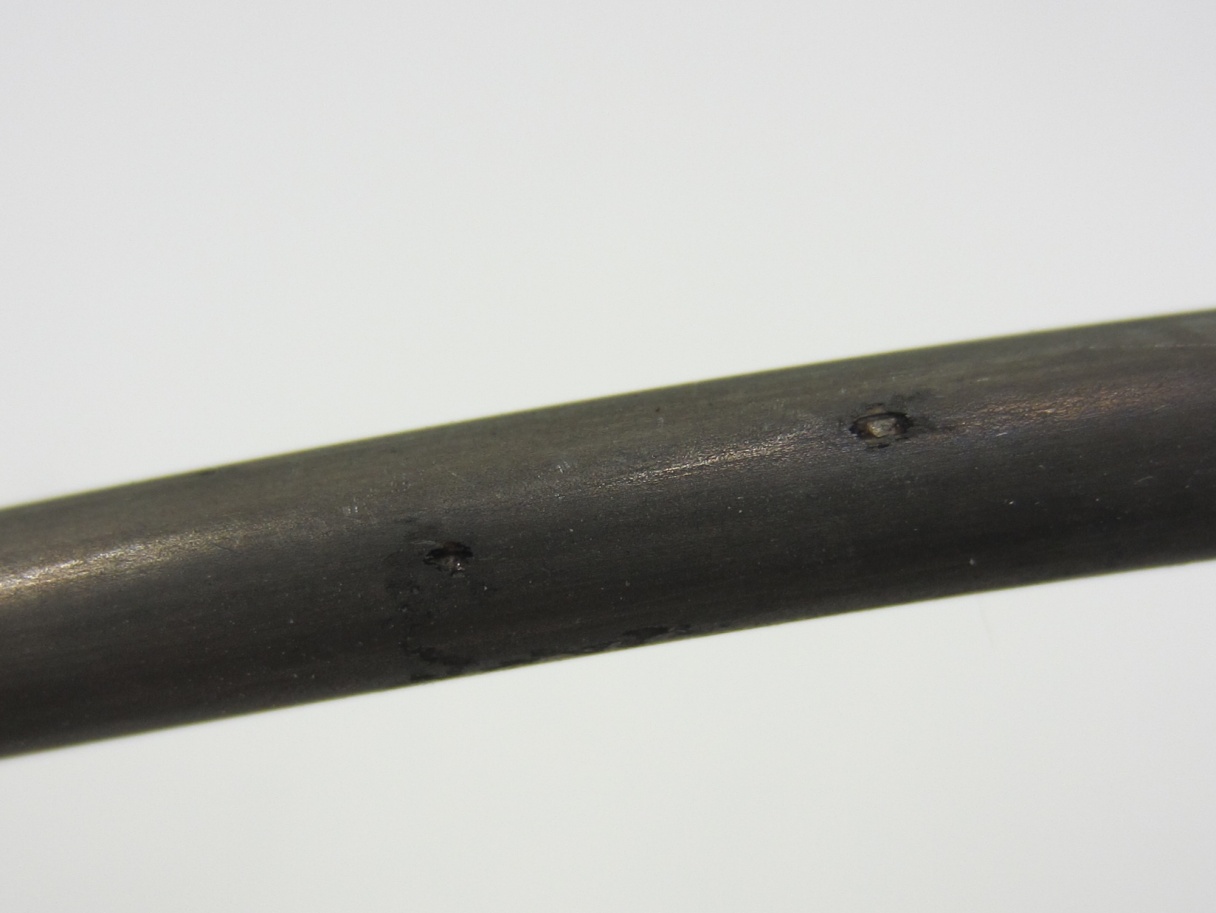
Figure 239. Photo. Stressed and fully grouted 0.8 percent chloride single-strand specimen (pit depth = 4.7 mil). This photo shows moderate pitting corrosion (pit depth was 4.7 mil) observed on a stressed and fully grouted 0.8 percent chloride single-strand specimen.
Figure 239. Photo. Stressed and fully grouted 0.8 percent chloride single-strand specimen (pit depth = 4.7 mil).
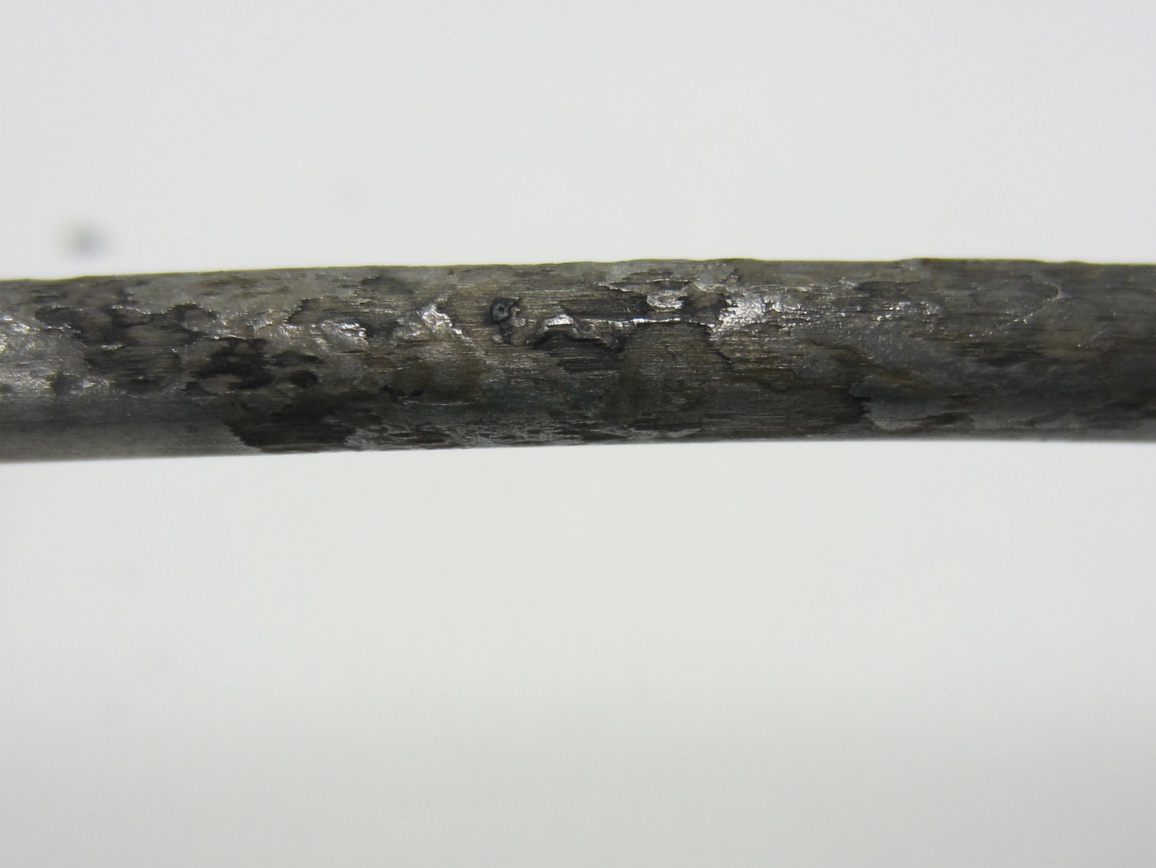
Figure 240. Photo. 0 percent chloride multi-strand specimen at the void/grout interface (pit depth = 2–4 mil). This photo shows moderate pitting corrosion (pit depth ranged between 2 and 4 mil) observed on an interface strand of 0 percent chloride multi-strand specimen.
Figure 240. Photo. 0 percent chloride multi-strand specimen at the void/grout interface (pit depth = 2–4 mil).
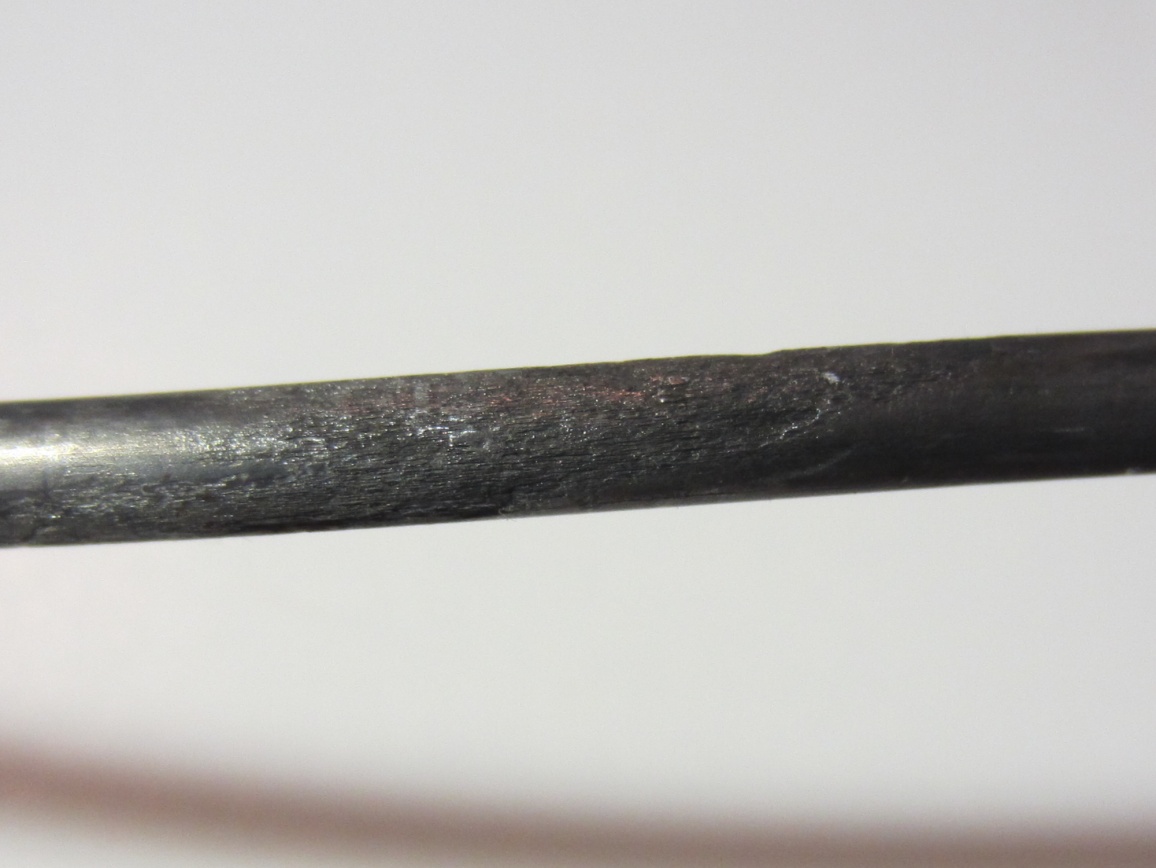
Figure 241. Photo. 0.08 percent chloride multi-strand specimen near the interface (pit depth = 2–10 mil). This photo shows moderate pitting corrosion (pit depth ranged between 
2 and 10 mil) observed on an interface strand of 0.08 percent chloride multi-strand specimen.
Figure 241. Photo. 0.08 percent chloride multi-strand specimen near the interface (pit depth = 2–10 mil).
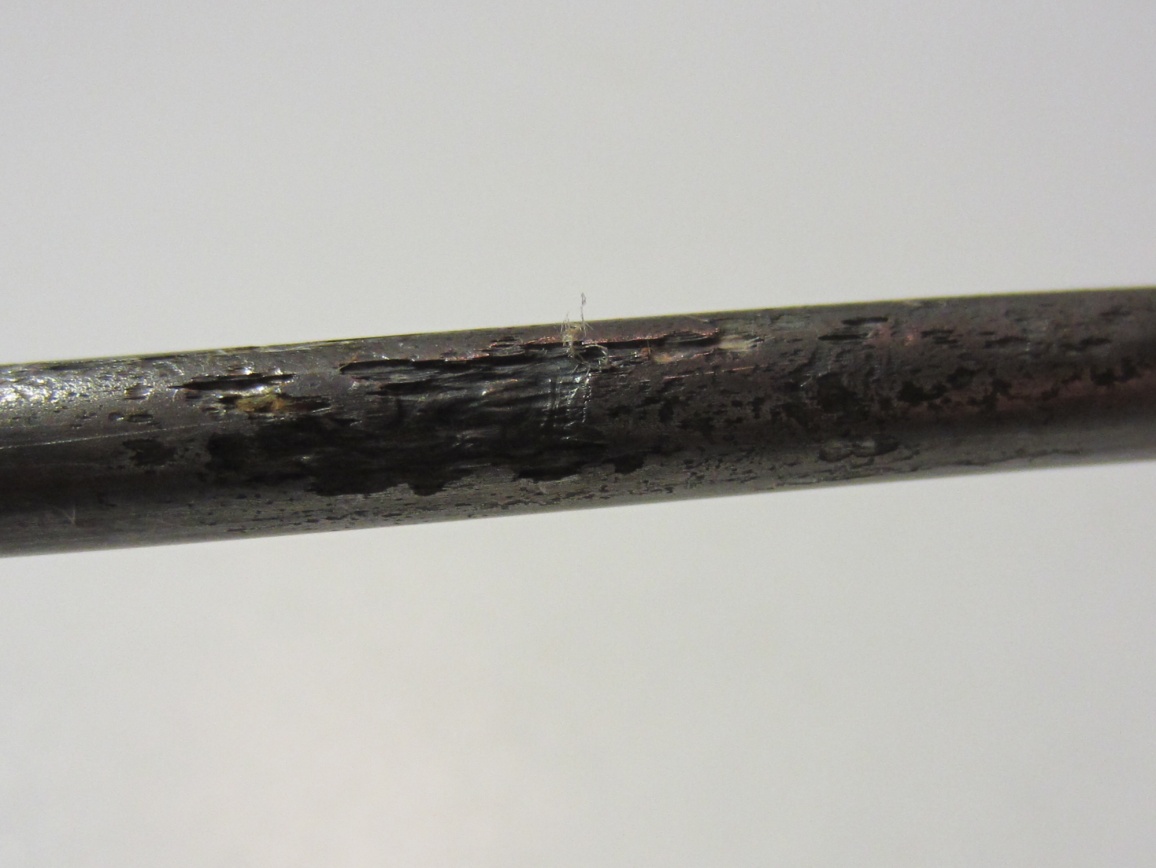
Figure 242. Photo. 0.6 percent chloride multi-strand specimen in the grout (pit depth = 2–14 mil). This photo shows moderate pitting corrosion (pit depth ranged between 2 and 
14 mil) observed on a strand fully embedded in 0.6 percent chloride multi-strand specimen.
Figure 242. Photo. 0.6 percent chloride multi-strand specimen in the grout (pit depth = 2–14 mil).
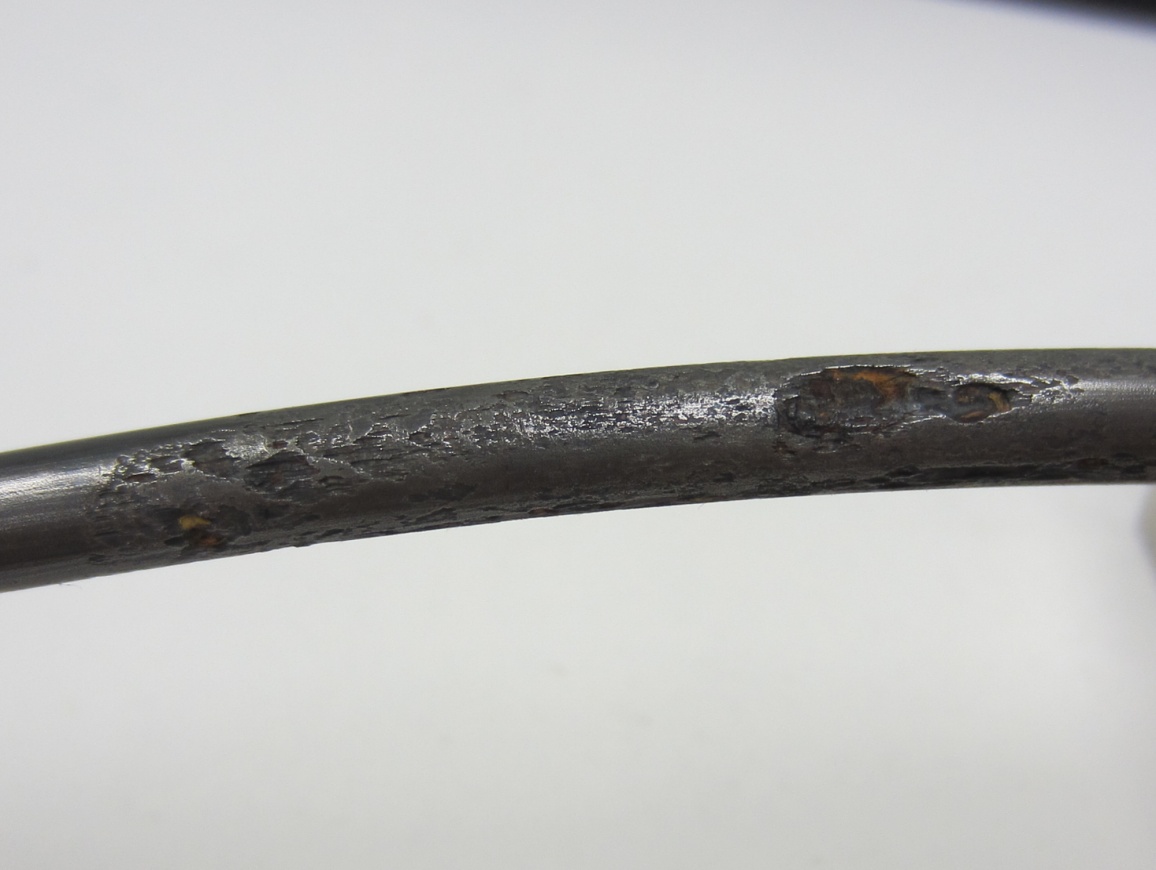
Figure 243. Photo. Stressed and voided 1.0 percent chloride single-strand specimen (pit depth = 2–18 mil). This photo shows severe pitting corrosion (pit depth ranged between 
2 and 18 mil) observed on a stressed 1.0 percent chloride single-strand specimen with void.
Figure 243. Photo. Stressed and voided 1.0 percent chloride single-strand specimen (pit depth = 2–18 mil).
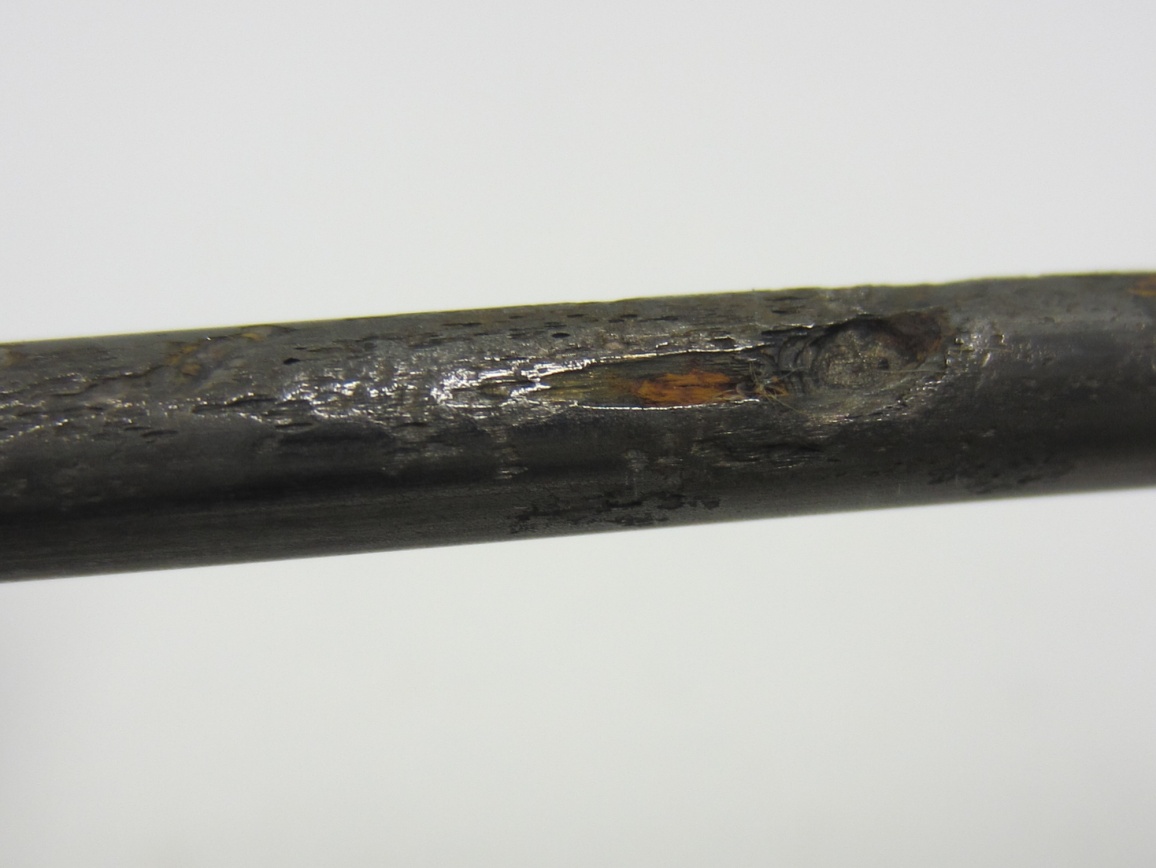
Figure 244. Photo. 1.0 percent chloride multi-strand specimen in the grout (pit depth = 2–23 mil). This photo shows severe pitting corrosion (pit depth ranged between 2 and 23 mil) observed on a strand fully embedded in 1.0 percent chloride multi-strand specimen.
Figure 244. Photo. 1.0 percent chloride multi-strand specimen in the grout (pit depth = 2–23 mil).
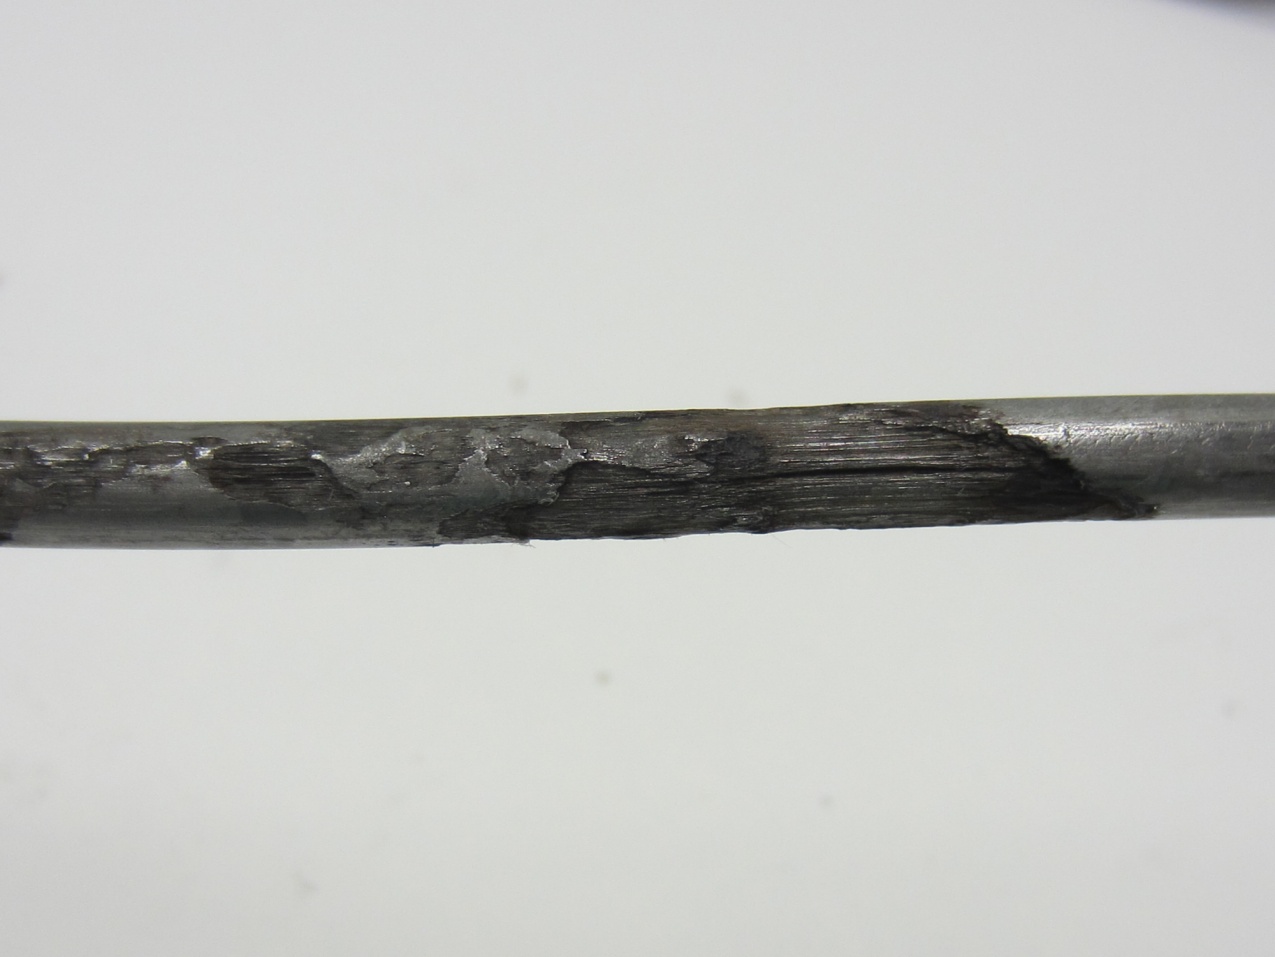
Figure 245. Photo. 0 percent chloride multi-strand specimen at the interface (pit depth = 2–36 mil). This photo shows severe pitting corrosion (pit depth ranged between 2 and 36 mil) observed on an interface strand of 0 percent chloride multi-strand specimen.
Figure 245. Photo. 0 percent chloride multi-strand specimen at the interface (pit depth = 2–36 mil).
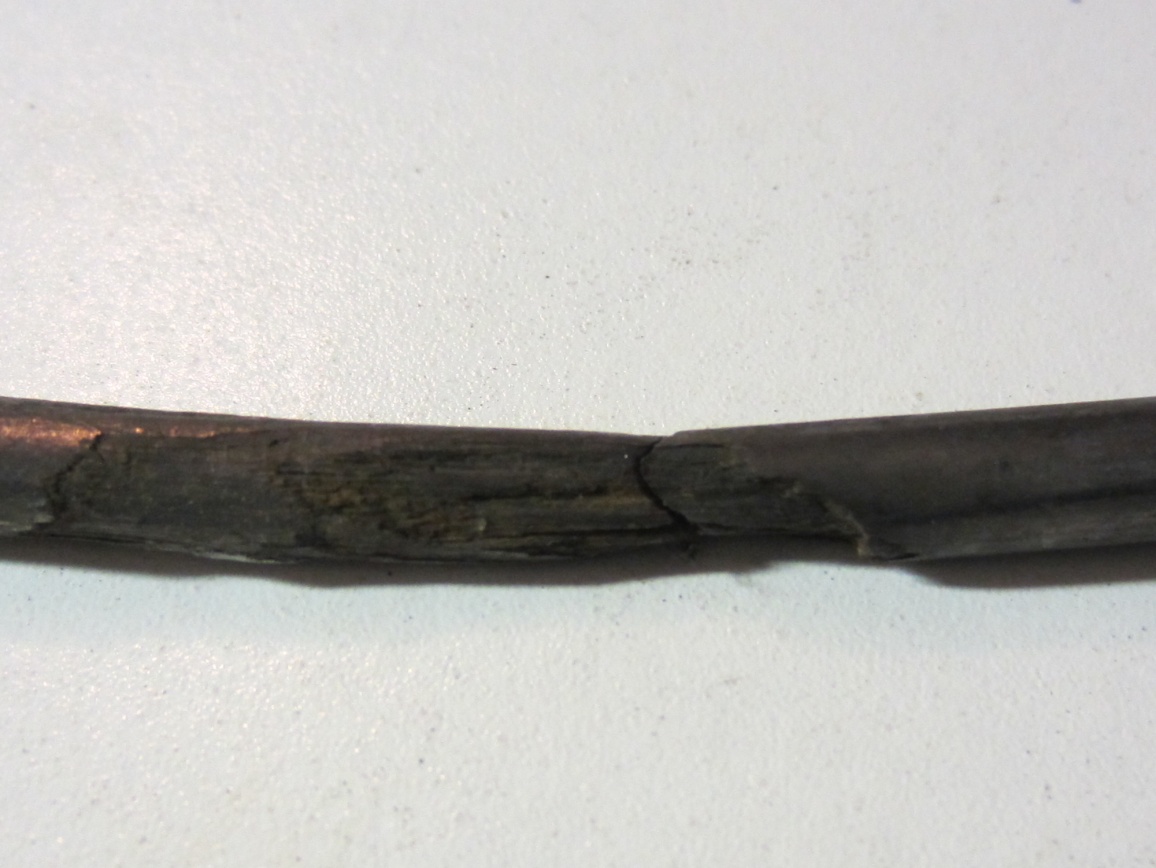
Figure 246. Photo. 0.4 percent chloride multi-strand specimen near the void (pit depth = 2–50 mil). This photo shows severe pitting corrosion (pit depth ranged between 2 and 50 mil) observed on an interface strand of 0.4 percent chloride multi-strand specimen.
Figure 246. Photo. 0.4 percent chloride multi-strand specimen near the void (pit depth = 2–50 mil).
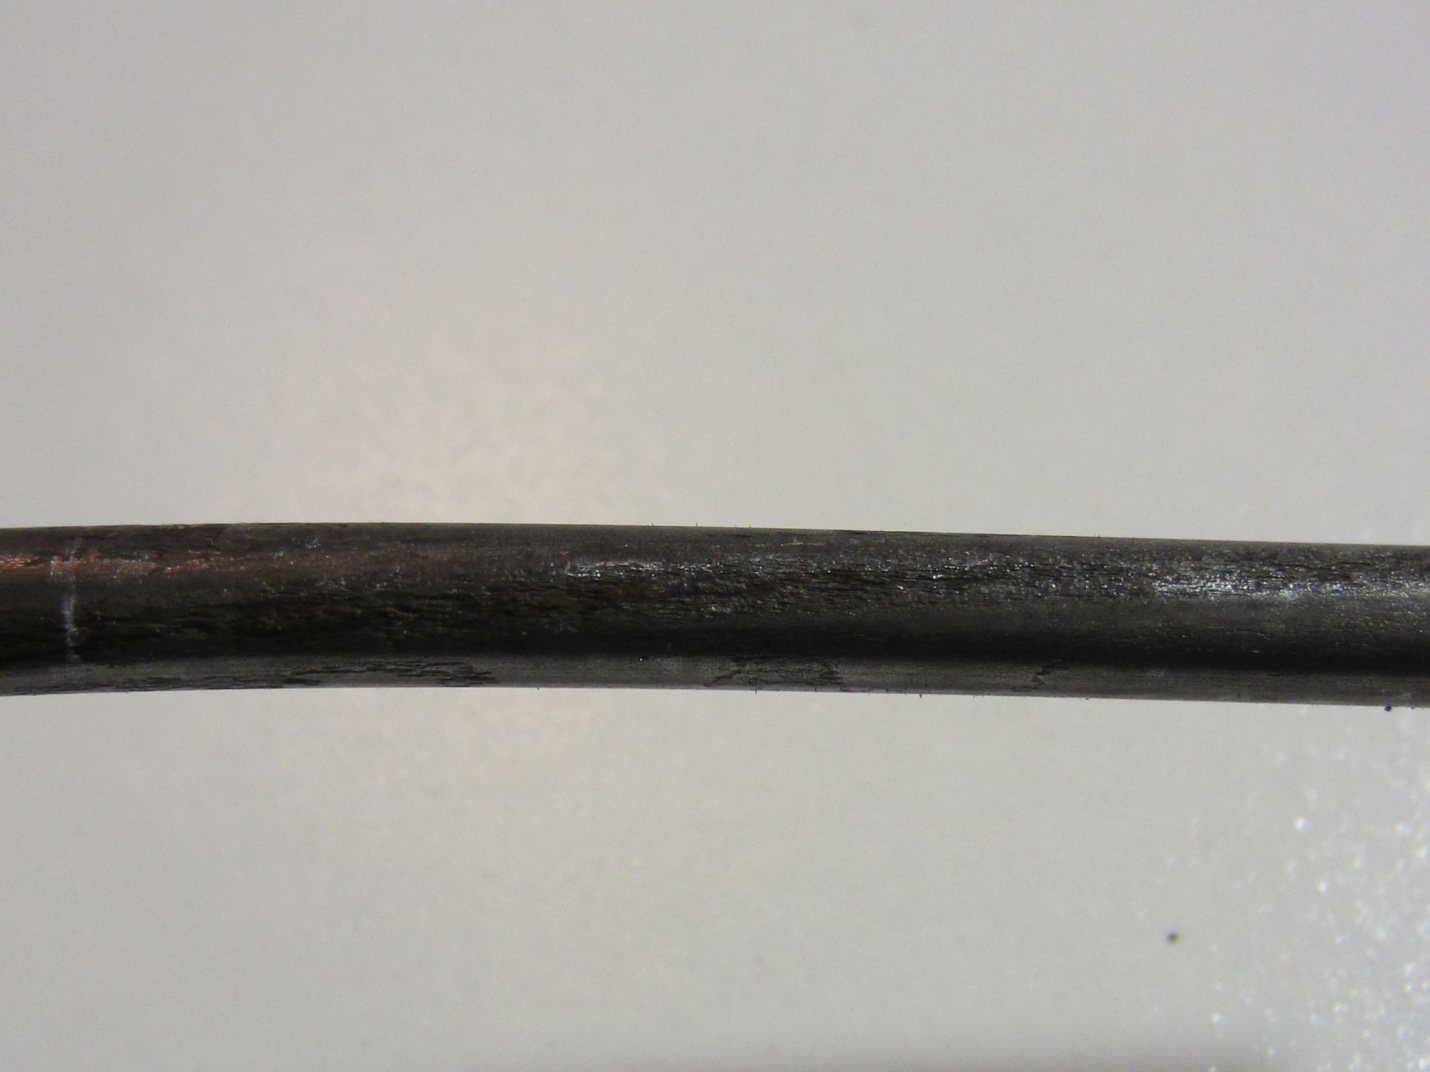
Figure 247. Photo. Crevice corrosion between two stressed wires on 0.4 percent chloride concentration multi-strand specimen (mean pit depth = 4.5 mil and maximum pit depth = 8.0 mil). This photo shows moderate crevice corrosion observed between two stressed wires in 0.4 percent chloride multi-strand specimen. Mean pit depth was 4.5 mil, and maximum pit depth was 8.0 mil.
Figure 247. Photo. Crevice corrosion between two stressed wires on 0.4 percent chloride concentration multi-strand specimen (mean pit depth = 4.5 mil and maximum pit depth = 8.0 mil).
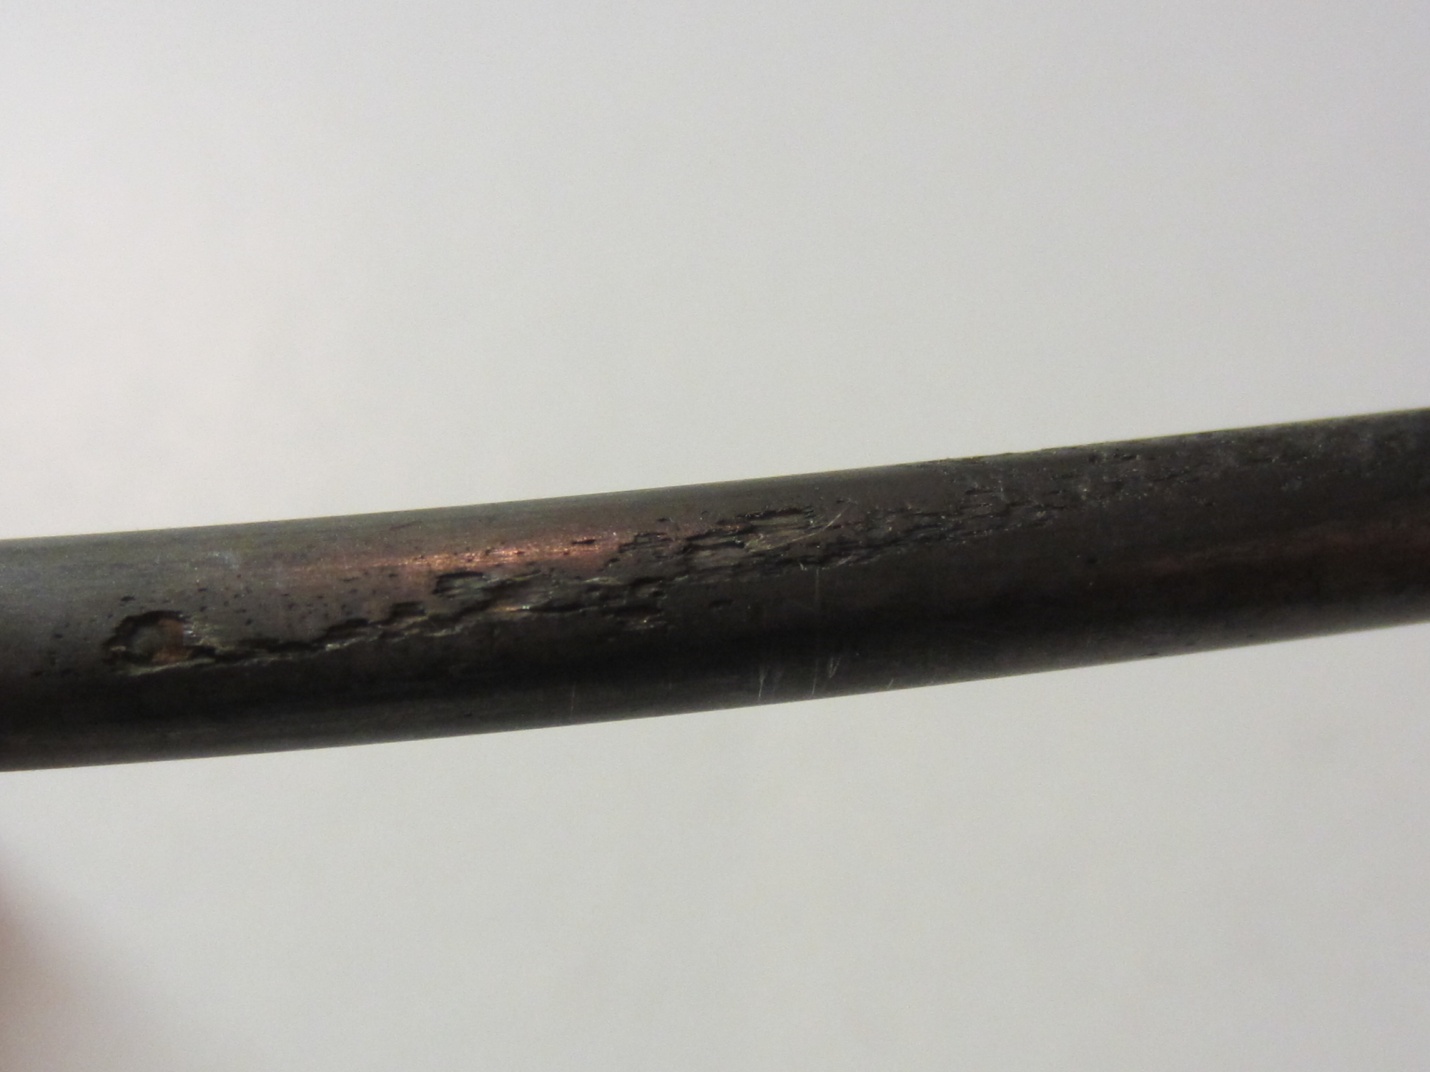
Figure 248. Photo. Crevice corrosion between two stressed wires on 0.8 percent chloride concentration multi-strand specimen (mean pit depth = 4.5 mil and maximum pit depth = 6.0 mil). This photo shows moderate crevice corrosion observed between two stressed wires in 0.8 percent chloride multi-strand specimen. Mean pit depth was 4.5 mil, and maximum pit depth was 6.0 mil.
Figure 248. Photo. Crevice corrosion between two stressed wires on 0.8 percent chloride concentration multi-strand specimen (mean pit depth = 4.5 mil and maximum pit depth = 6.0 mil).

For single-strand specimens, a total of 202 pit depth measurements were made on 13 wires removed from 5 12-inch segments. As summarized in table 9, measurable pits started to appear at a chloride concentration of 0.8 percent by weight of cement. For multi-strand specimens, a total of 3,426 pit depth measurements were made on 222 wires removed from 59 12-inch segments. Table 11 and table 12 provide detailed physical conditions of interface segments and in-grout segments of multi-strand specimens, respectively. The data in both tables were divided in two groups: number (percentage) of stressed and number (percentage) of unstressed segments showing superficial rust and heavy rust requiring acid cleaning. All of the unstressed segments exhibited superficial corrosion, and the acid-cleaned wires were entirely from the stressed ones.

Task 2.2: Voided Single-Strand Specimens

Figure 249 presents mean and maximum pit depth data of voided single-strand specimens. Each figure in parenthesis is the number of pits associated with a particular mean pit depth. No measureable pits were found in less than 0.8 percent chloride concentration. At higher chloride concentrations (1.0 to 2.0 percent), mean pit depth ranged between 3.6 and 6.2 mil, and maximum pit depths were between 7 and 18 mil.
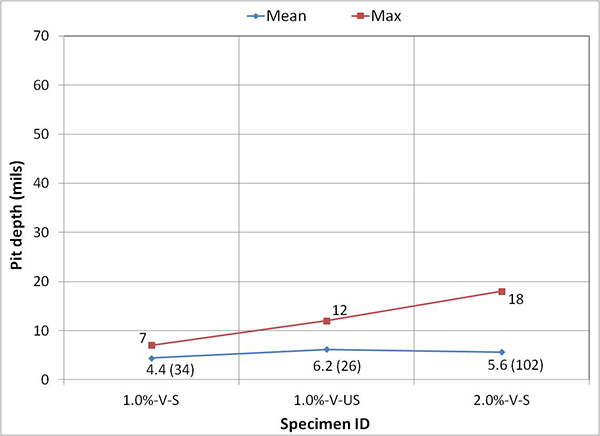
Figure 249. Graph. Mean and maximum pit depths on the voided single-strand specimens. This graph presents mean and maximum pit depth data of voided single-strand specimens. Pit depth is on the y-axis from 0 to 70 mil, and specimen ID is on the x-axis for 1.0 percent chloride stressed full grout (34 pits), 1.0 percent chloride unstressed voided grout (26 pits), and 2.0 percent chloride stressed voided grout (102 pits). Mean pit depth ranged between 3.6 and 6.2 mil, and maximum pit depths ranged between 7 and 18 mil.
Figure 249. Graph. Mean and maximum pit depths on the voided single-strand specimens.

Task 2.3: Void/Grout Interface of Multi-Strand Specimens

Figure 250 shows fractions of stressed interface segments exhibiting superficial rust and fractions of individual wires (after untwisting strand segments) requiring acid cleaning due to heavy rust as a function of chloride concentration. Actual numbers are also listed in table 11. The data can be used to estimate severity of the strand corrosion. Reference photographs describing typical superficial rust and heavy rust are shown in figure 62 and figure 63, respectively. Corrosion appeared on some or the entire interface segments, regardless of chloride concentration, even at 0 percent chloride. As discussed previously, interface segments of 0, 0.4, and 2.0 percent chloride specimens suffered from unexpected abnormal corrosion damage due to excessive sulfate ions. If rust data of these specimens are excluded, 0.8 percent chloride is the lowest concentration to exhibit heavy corrosion products requiring acid cleaning.
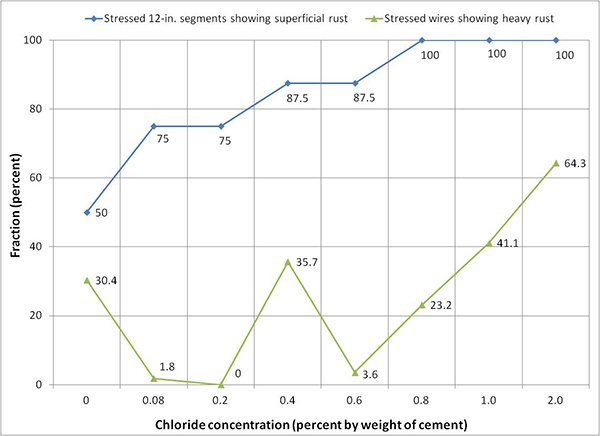
Figure 250. Graph. Condition of stressed segments at the void/grout interface of multi-strand specimens. This graph shows fractions of stressed interface segments exhibiting superficial rust and fractions of individual wires (after untwisting strand segments) requiring acid cleaning due to heavy rust as a function of chloride concentration. Fraction is on the y-axis from 0 to 100 percent, and chloride concentration is on the x-axis from 0 to 2.0 percent by weight of cement. Two lines are shown: stressed 12-inch segments showing superficial rust and stressed wires showing heavy rust. Corrosion appeared on some or the entire interface segments, regardless of chloride concentration, even at 0 percent chloride.
Figure 250. Graph. Condition of stressed segments at the void/grout interface of multi-strand specimens.

Figure 251 shows the number of pits measured on the interface segments. If pit data of 0 and 0.4 percent chloride specimens are ignored and the number of pits measured on 0.08 and 0.6 percent chloride specimens are considered insignificant, 0.8 percent chloride is the lowest concentration to have a meaningful number of pits. In other words, severe corrosion can be anticipated if stressed strands are exposed at the void/grout interface containing 0.8 percent chloride. Pitting corrosion tended to concentrate more on the 16- to 28-inch segments (TL and TR) compared to the 4- to 16-inch segments (BL and BR).
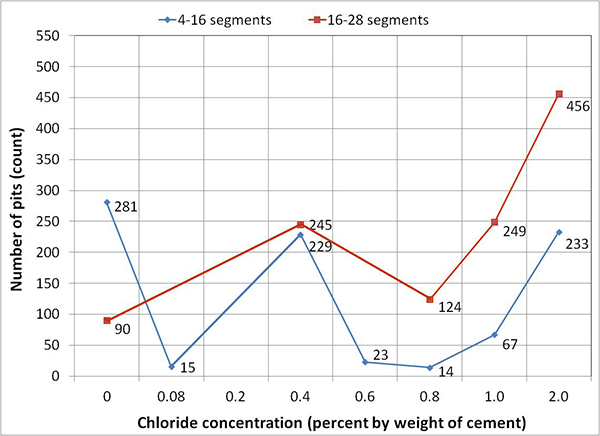
Figure 251. Graph. Number of pits on the interface segments of multi-strand specimens measured from the upper anchor plate. This graph shows the number of pits measured on the interface segments. The number of pits is on the y-axis from 0 to 550, and chloride concentration is on the x-axis from 0 to 2.0 percent by weight of cement. The eight chloride concentrations are 0, 0.08, 0.2, 0.4, 0.6, 0.8, 1.0, and 2.0 percent. Two lines are shown: 4 to 16 segments and 16 to 28 segments. For the 4- to 16-segment line, the number of pits for seven of the concentrations (excluding 0.2 percent) are 281, 15, 229, 23, 14, 67, and 233, respectively. For the 16- to 28-segment line, the number of pits for five of the concentrations (excluding 0.08, 0.2, and 0.6 percent) are 90, 245, 124, 249, and 456, respectively.
Figure 251 . Graph. Number of pits on the interface segments of multi-strand specimens measured from the upper anchor plate.

Figure 252 shows mean pit depth data for the interface segments. If pit data affected by sulfate contamination are omitted, overall mean pit depth was approximately 6 mil. The largest mean pit depth was 11 mil at 2.0 percent chloride concentration.
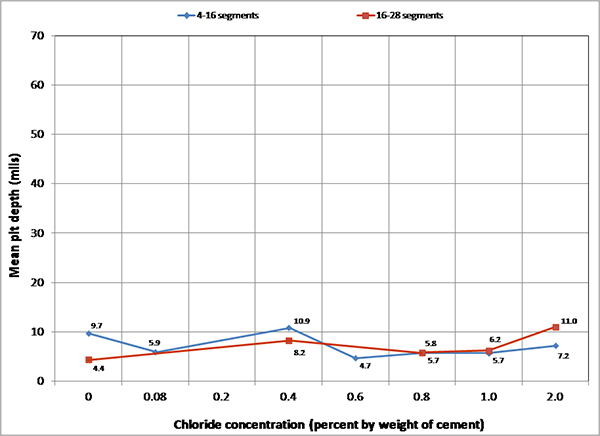
Figure 252. Graph. Mean pit depths on the interface segments of multi-strand specimens measured from the upper anchor plate. This graph shows mean pit depth data of the interface segments. Mean pit depth is on the y-axis from 0 to 70 mil, and chloride concentration is on the x-axis from 0 to 2.0 percent by weight of cement. Two lines are shown: 4 to 16 segments and 16 to 28 segments. For the 4- to 16-segment line, the mean pit depth for seven of the concentrations (excluding 0.2 percent) are 9.7, 5.9, 10.9, 4.7, 5.7, 5.7, and 7.2 mil, respectively. For the 16- to 28-segment line, the mean pit depth for five of the concentrations (excluding 0.08, 0.2, and 0.6 percent) are 4.4, 8.2, 5.8, 6.2, and 
11.0 mil, respectively.
Figure 252. Graph. Mean pit depths on the interface segments of multi-strand specimens measured from the upper anchor plate.

The intensity of pitting corrosion was estimated by maximum pit depths. The results are plotted in figure 253. If excessive sulfate ions had not induced severe corrosion at the interfaces, it is reasonable to assume that maximum pit depth of 0 and 0.4 percent chloride concentrations might have been approximately 10 mil because neighboring concentrations of 0.08 and 0.6 percent chloride yielded the same number. At 0.8 and 1.0 percent chloride concentrations, maximum pit depths increased to 18 and 25 mil, respectively. The measured largest pit depth was 60 mil at 2.0 percent chloride concentration.
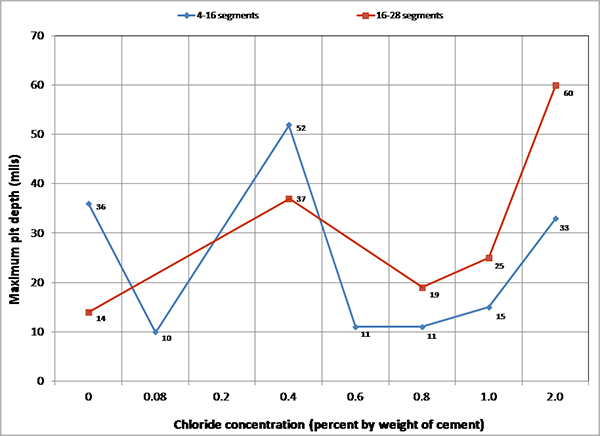
Figure 253. Graph. Maximum pit depths on the interface segments of multi-strand specimens measured from the upper anchor plate. This graph shows the intensity of pitting corrosion expressed by maximum pit depths. Mean pit depth is on the y-axis from 0 to 70 mil, and chloride concentration is on the x-axis from 0 to 2.0 percent by weight of cement. Two lines are shown: 4 to 16 segments and 16 to 28 segments. For the 4- to 16-segment line, the mean pit depth for seven of the concentrations (excluding 0.2 percent) are 36, 10, 52, 
11, 11, 15, and 33 mil, respectively. For the 16- to 28-segment line, the mean pit depth for five of the concentrations (excluding 0.08, 0.2, and 0.6 percent) are 14, 37, 19, 25, and 60 mil, respectively.
Figure 253. Graph. Maximum pit depths on the interface segments of multi-strand specimens measured from the upper anchor plate.

Task 2.2: Fully Grouted Single-Strand Specimens

Figure 254 plots mean and maximum pit depth data of fully grouted single-strand specimens. Measureable pits began to show at 0.8 percent chloride. Mean pit depth varied between 3.6 and 4.4 mil, and maximum pit depths were between 5 and 12 mil. These values are somewhat lower than those measured on the voided single-strand specimens.
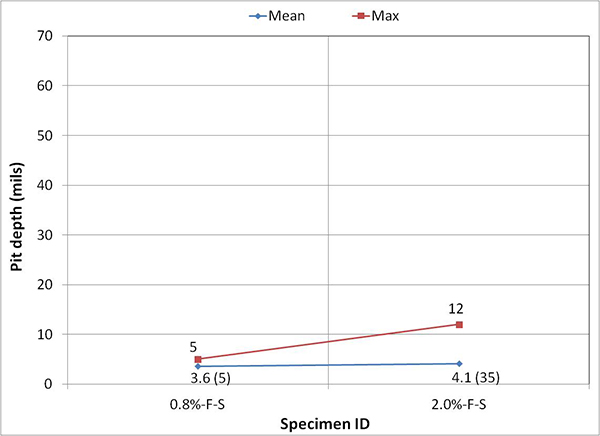
Figure 254. Graph. Mean and maximum pit depths on the fully grouted single-strand   specimens. This graph presents mean and maximum pit depth data of fully grouted single-strand specimens. Pit depth is on the y-axis from 0 to 70 mil, and specimen ID is on the x-axis for 0.8 percent chloride stressed full grout (5 pits) and 2.0 percent chloride stressed full grout (35 pits). Two lines are shown: mean and max. Mean pit depth varied between 3.6 and 4.4 mil, and maximum pit depth was between 5 and 12 mil.
Figure 254 . Graph. Mean and maximum pit depths on the fully grouted single-strand specimens.

Task 2.3: Fully Grouted Sections of Multi-Strand Specimens

Figure 255 shows fractions of stressed in-grout segments exhibiting superficial rust and fractions of individual wires (after untwisting strand segments) requiring acid cleaning due to heavy rust. Superficial rust and heavy rust started to appear when chloride concentration was 0.4 and 0.8 percent, respectively. Interface segments also exhibited heavy rust from 0.8 percent chloride concentration. With higher chloride concentrations up to 1.0 percent, more rust was observed in both rust types. Low macro-cell corrosion current density of 2.0 percent chloride specimen was responsible for its reduced number of rust spots. The stressed in-grout strands developed far less corrosion at any chloride concentration compared to the stressed interface segments. This suggests that grout might have provided some corrosion protection to the strands. Figure 256 shows the number of pits measured on the stressed segments versus their distance from the upper anchor plate. More pits were found on the segments closer to the interface and also as chloride concentration increased.
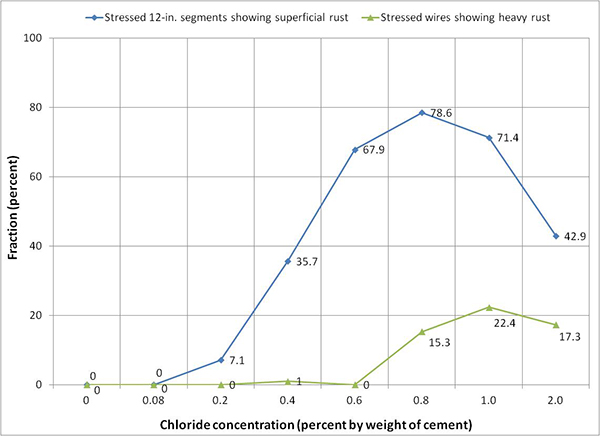
Figure 255. Graph. Physical condition of stressed in-grout segments in multi-strand   specimens. This graph shows fractions of stressed in-grout segments exhibiting superficial rust and fractions of individual wires (after untwisting strand segments) requiring acid cleaning due to heavy rust. Fraction is on the y-axis from 0 to 100 percent, and chloride concentration is on the x-axis from 0 to 2.0 percent by weight of cement. Two lines are shown: stressed 12-inch segments showing superficial rust and stressed wires showing heavy rust. Superficial and heavy rust started to appear when chloride concentration was 0.4 and 0.8 percent, respectively. Interface segments also exhibited heavy rust from 0.8 percent chloride concentration. With higher chloride concentrations up to 1.0 percent, more rust was observed in both rust types.
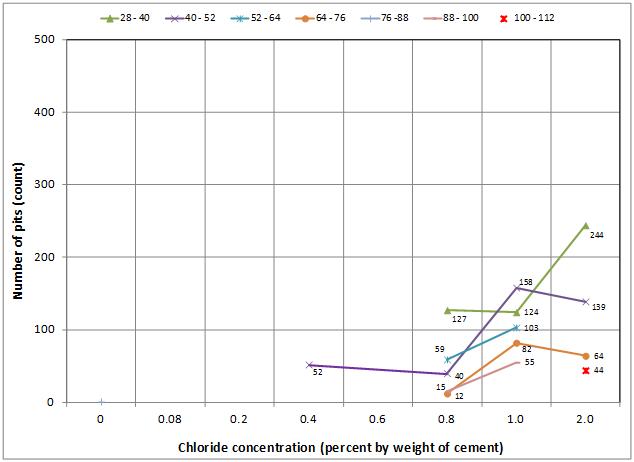
Figure 255. Graph. Physical condition of stressed in-grout segments in multi-strand specimens.

Figure 256. Graph. Number of pits observed on the stressed strands in multi-strand specimens measured from the upper anchor plate. This graph shows the number of pits measured on the stressed segments versus their distance from the upper anchor plate. Number of pits is on the y-axis from 0 to 500, and chloride concentration is on the x-axis from 0 to 2.0 percent by weight of cement. Seven lines are shown: 28–40 segments, 40–52 segments, 52–64 segments, 64–76 segments, 76–88 segments, 88–100 segments, and 100–112 segments. More pits were found on the segments closer to the interface and also as chloride concentration increased.
Figure 256. Graph. Number of pits observed on the stressed strands in multi-strand specimens measured from the upper anchor plate.

Figure 257 shows mean pit depth data of stressed strand segments embedded in grout by distance. Their mean pit depths varied between 3.4 and 7.4 mil when chloride concentration was 1.0 percent or less. At 2.0 percent chloride concentration, mean pit depth increased to 13 mil. Mean pit depth was not affected by distance from the upper anchor plate at any chloride concentration.
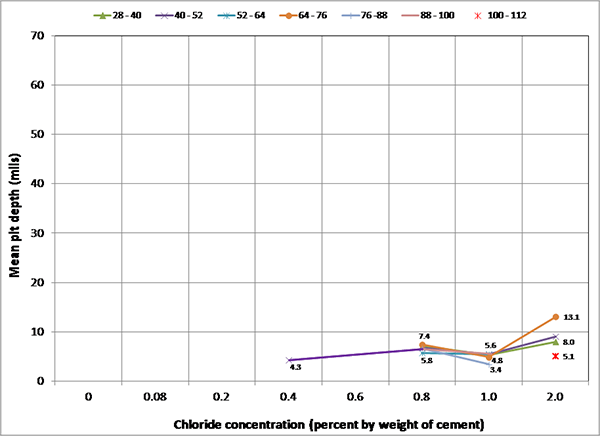
Figure 257. Graph. Mean pit depths measured on stressed strands in multi-strand specimens measured from the upper anchor plate. This graph shows mean pit depth data of stressed strand segments embedded in grout by distance. Mean pit depth is on the y-axis from 0 to 70 mil, and chloride concentration is on the x-axis from 0 to 2.0 percent by weight of cement. Seven lines are shown: 28–40 segments, 40–52 segments, 52–64 segments, 64–76 segments, 76–88 segments, 88–100 segments, and 100–112 segments. Mean pit depth varied between 3.4 and 7.4 mil when chloride concentration was 1.0 percent or less. At 
2.0 percent chloride concentration, mean pit depth increased to 13 mil. Mean pit depth was not affected by distance from the upper anchor plate at any chloride concentration.
Figure 257. Graph. Mean pit depth measured on stressed strands in multi-strand specimens measured from the upper anchor plate.

Figure 258 compares the total number of pits versus chloride concentration data determined over the same in-grout length of stressed and unstressed strands. A small number of pits appeared at 0.4 percent (stressed strands) and 0.6 percent (unstressed strands), but pitting corrosion damage deeper than 2 mil (sign of corrosion propagation) was observed only on the stressed strands exposed to 0.8 percent chloride and higher concentrations. Heavy rust also developed on the stressed strands exposed to the same chloride concentration (see figure 250 and figure 255). Figure 259 shows overall mean pit depth versus chloride concentration data over the same in-grout length of stressed and unstressed strands. None of the unstressed in-grout strands exceeded the 2-mil pit depth threshold regardless of chloride concentration. Overall mean pit depth measured on the stressed in-grout strands increased from 4.3 to 9.4 mil as the chloride concentration increased from 0.4 to 2.0 percent.
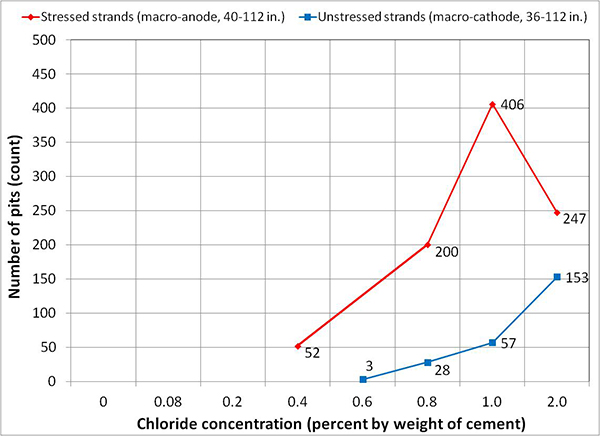
Figure 258. Graph. Number of pits observed on the in-grout strands in multi-strand specimens. This graph compares total number of pits versus chloride concentration data determined over the same in-grout length of stressed and unstressed strands. Number of pits is on the y-axis from 0 to 500, and chloride concentration is on the x-axis from 0 to 2.0 percent by weight of cement. Two lines are shown: stressed strands (macro-anode, 40–112 inches) and unstressed strands (macro-cathode, 36–112 inches). A small number of pits appeared at 0.4 percent (stressed strands) and 0.6 percent (unstressed strands), but pitting corrosion damage deeper than 2 mil (sign of corrosion propagation) was observed only on the stressed strands exposed to 0.8 percent chloride and higher concentrations.
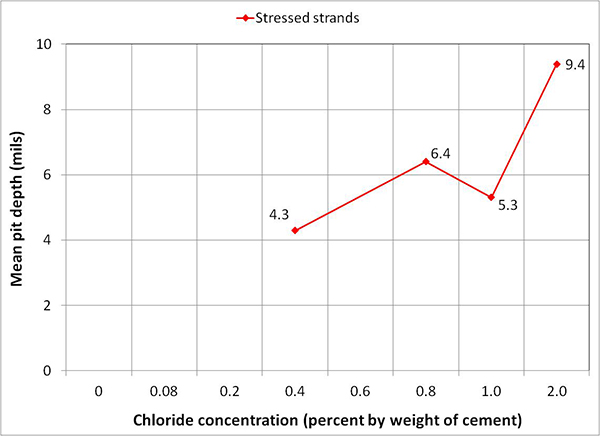
Figure 258. Graph. Number of pits observed on the in-grout strands in multi-strand specimens.

Figure 259. Graph. Mean pit depths of the in-grout stressed strands in multi-strand specimens. This graph shows overall mean pit depth versus chloride concentration data over the same in-grout length of stressed and unstressed strands. Mean pit depth is on the y-axis from 0 to 10 mil, and chloride concentration is on the x-axis from 0 to 2.0 percent by weight of cement. One line is shown for stressed strands. Overall mean pit depth increased from 4.3 to 9.4 mil as chloride concentration increased from 0.4 to 2.0 percent.
Figure 259. Graph. Mean pit depths of the in-grout stressed strands in multi-strand specimens.

As shown in figure 260, maximum pit depth tended to increase as chloride concentration increased. The measured largest pit depth was 36 mil at 2.0 percent chloride concentration. There was no strong relationship observed between distance from the upper anchor plate and maximum pit depth.
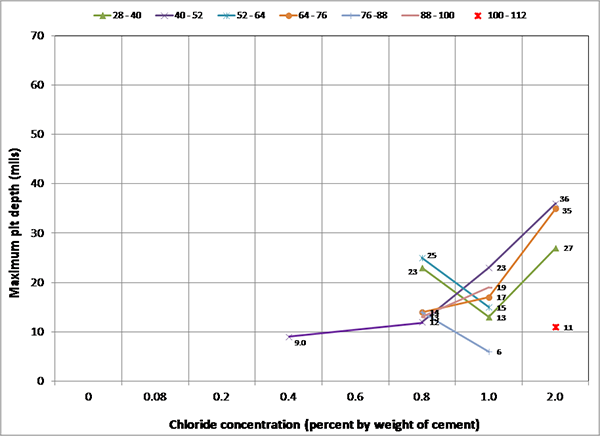
Figure 260. Graph. Maximum pit depths measured on the stressed strands in multi-strand specimens measured from the upper anchor plate. This graph shows maximum pit depths measured on stressed strands in multi-strand specimens measured from the upper anchor plate. Maximum pit depth is on the y-axis from 0 to 70 mil, and chloride concentration is on the x-axis from 0 to 2.0 percent by weight of cement. Seven lines are shown: 28–40 segments, 40–52 segments, 52–64 segments, 64–76 segments, 76–88 segments, 88–100 segments, and 100–112 segments. Maximum pit depth tended to increase as chloride concentration increased. The measured largest pit depth was 36 mil at 2.0 percent chloride concentration. There was no strong relationship observed between distance from the upper anchor plate and maximum pit depth.
Figure 260 . Graph. Maximum pit depths measured on the stressed strands in multi-strand specimens measured from the upper anchor plate.

Role of Void/Grout Interface

It is believed that premature failure of some field PT tendons was caused by a macro-cell corrosion mechanism of intensive localized corrosion in a relatively small anodic area of a PT tendon in relation to the rest of the tendon. In the present study, employment of the multi-strand specimen was intended to reproduce the worst corrosion damage by a simulated macro-cell corrosion setup in a relatively short period of time in the laboratory. The intended macro-cell corrosion was created between four stressed strands as macro-anode, especially near the void/grout interface, and five unstressed strands completely embedded in grout as macro-cathode. The majority of the electrochemical data and autopsy results of multi-strand specimens indicate that the macro-cell corrosion setup effectively facilitated accelerated corrosion of PT strands.

Figure 261 shows how macro-cell corrosion damage was influenced by distance with respect to the void/grout interface in normal grout. The stressed strands in the figure were divided into three sections: two interface segments (4–16 and 16–28 inches), a transition segment (28–40 inches), and the remaining segments (40–112 inches). Corrosion damage data of 0, 0.4, and 2.0 percent chloride concentration specimens are not included in the plot due to their excessive corrosion damage by sulfate ions.

A general trend is that more pits were found on the segments closer to the interface when chloride concentration was 0.8 and 1.0 percent. When chloride concentration was between 0.08 and 0.6 percent, no measurable pits were observed. This finding indicates that stressed strands near the interface were subjected to the most intensive corrosion if chloride concentration was 0.8 percent chloride. At this chloride concentration level, small surface area at the interface became the most anodic, probably in the presence of more oxygen and moisture in the void. The number of pits tended to decrease as a segment was getting away from the interface. It is thought that this phenomenon was caused by weakened macro-cell corrosion current at the segments in the deeper grout upon presence of higher grout resistance from the interface.
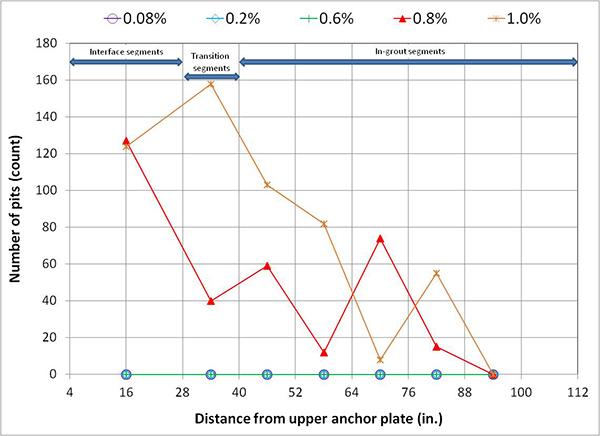
Figure 261. Graph. Number of pits measured on the stressed strands in some of the multi-strand specimens. This graph shows the number of pits measured on the stressed strands in some of the multi-strand specimens. Number of pits is on the y-axis from 0 to 180, and distance from the upper anchor plate is on the x-axis from 4 to 112 inches. Five lines are shown: 0.08, 0.2, 0.6, 0.8, and 1.0 percent chloride concentration. The stressed strands are divided into three sections: an interface segment (4–16 inches and 16–28 inches), a transition segment (28–40 inches), and the in-grout segment (40–112 inches). More pits were found on the segments closer to the interface when chloride concentration was 0.8 and 1.0 percent. When chloride concentration was between 0.08 and 0.6 percent, no measurable pits were observed.
Figure 261. Graph. Number of pits measured on the stressed strands in some of the multi-strand specimens.

Figure 262 suggests that mean pit depth data did not follow the same trend. Pit depth was fairly uniform around approximately 6 mil along most of the strand length including the interface section.
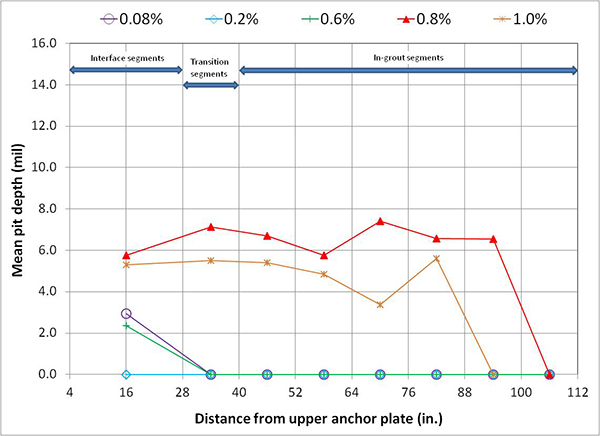
Figure 262. Graph. Mean pit depths measured on the stressed strands in some of the multi-strand specimens. This graph shows mean pit depths measured on the stressed strands in some of the multi-strand specimens. Mean pit depth is on the y-axis from 0 to 16 mil, and distance from the upper anchor plate is on the x-axis from 4 to 112 inches. The stressed strands are divided into three sections: an interface segment (4–28 inches), a transition segment (28–40 inches), and the in-grout segment (40–112 inches). Mean pit depth data was fairly uniform around 6 mil along the most of the strand length including the interface section.
Figure 262. Graph. Mean pit depth measured on the stressed strands in some of the multi-strand specimens.

SUMMARY OF MAJOR FINDINGS

The electrochemical testing of center wires conducted under task 2.1 revealed that the corrosion rate of center wires in pH 13.6 solutions was less than 0.05 mil/year at chloride concentrations up to 0.6 percent and increased at higher chloride concentrations. For the specimens tested in pH 9.0 solutions containing 0.04 percent and higher chloride concentrations, typical active corrosion behavior was observed: corrosion potentials became more negative and corrosion rates increased. The electrochemical testing results suggest that the PT strand can tolerate chloride contamination without significant corrosion up to 0.6 percent by weight of cement in carbonation-free (high pH) grout, whereas as low as 0.04 percent chloride by weight of cement can initiate active corrosion in the carbonated (low pH) grout. This is below the AASHTO specified chloride limit of 0.08 percent by weight of cement. Once corrosion starts in the low pH environment, level of corrosion damage will depend on chloride concentration.

The apparent grout resistivity of single-strand specimens and grout resistance of multi-strand specimens were sensitive to temperature. High grout resistivity/resistance was measured during the F & D cycles, and low resistivity/resistance was measured during the H & H cycles. Chloride concentration did not affect the apparent grout resistivity/resistance values.

For single-strand specimens (task 2.2), chloride concentration of 0.4 percent by weight of cement was the lowest concentration to make the strands more prone to corrosion in most conditions. Mean corrosion potential became gradually negative starting from 0.4 percent chloride in initial ambient, ambient, and hot and H & H conditions. Mean corrosion rate became progressively higher starting from 0.4 percent chloride, and a dependence of corrosion rate on temperature was observed—corrosion rate increased during the H & H cycles, and intermediate corrosion rate was observed in the ambient condition. In F & D cycles, corrosion of all specimens decreased to a negligible state regardless of chloride concentration. But, absolute values of the measured corrosion rates were very low due to small corroding areas compared to conventional corrosion rate criteria for ordinary reinforcing steel. There were no definite trends observed in single-strand specimens regarding stress level and presence of void, although limited data suggest that the stressed strands exposed to water in the grout void may be more susceptible to corrosion than the unstressed ones if acid-soluble chloride concentration is higher than 0.08 percent by weight of cement and the risk of corrosion is elevated with increased chloride concentration. All control specimens experienced steadily decreasing corrosion rates as their corrosion potential data also indicated the passive behavior.

An autopsy of single-strand specimens revealed that rust began to appear when chloride concentration was 0.4 percent. However, measurable pits were observed if chloride concentration was 0.8 percent. As chloride concentration increased, the severity of the corrosion got worse, particularly for the stressed specimens with void. However, the same observation was not indicated by their corrosion rate data. Mean pit depths ranged between 3.6 and 6.2 mil. A combination of a void, recharged water, and elevated chloride concentration can be detrimental, evidenced by markedly higher number of pits found on the 2.0 percent chloride stressed specimen with void.

For multi-strand specimens (task 2.3), chloride concentration was a more influential parameter for corrosion potential than exposure condition. As the macro-cell corrosion setup intended, stressed strands exhibited more negative corrosion potentials than unstressed ones, making the stressed strands anodic to the unstressed ones at any chloride concentration. It is unclear if presence of stress or localized corrosion at the void/grout interface or both made the entire stressed strands active. When chloride concentration increased to 0.4 percent, mean corrosion potentials of the stressed strands fell into the 90 percent corrosion probability. For unstressed strands, the same condition occurred only after chloride concentration reached 2.0 percent. Overall mean macro-cell corrosion current density also began to increase at 0.4 percent chloride. At any chloride concentration, the H & H and F & D cycles produced the highest and the lowest mean macro-cell corrosion current densities, respectively. Water recharging did not influence the mean corrosion potentials and mean macro-cell current densities significantly.

Autopsy of multi-strand specimens revealed that, in general, stressed segments started to show superficial rust at 0.4 percent chloride concentration, and heavy rust required acid cleaning at 0.8 percent chloride concentration. This observation could be made with both of the interface segments and in-grout segments. Mean pit depths measured on the stressed in-grout strands increased from 4.3 to 9.4 mil if chloride concentration increased from 0.4 to 2.0 percent. For the interface segments, mean pit depth was approximately 6 mil when chloride concentration was less than 1.0 percent. At 2.0 percent chloride concentration, mean pit depth increased to 11 mil. The largest measured pit depths were 60 and 36 mil for the interface segments and in-grout segments, respectively. For unstressed strands, superficial rust began to show up at 0.6 percent chloride concentration, and none of the pits exceeded 2 mil regardless of chloride concentration.

A general trend observed from the multi-strand specimens with normal grout at the interface is that more pits were found on the segments closer to the interface when chloride concentration was 0.8 and 1.0 percent. When chloride concentration was between 0.08 and 0.6 percent, no measurable pits were found at all. This finding suggests that stressed strands near the interface were subjected to the most intensive macro-cell corrosion if chloride concentration was 0.8 percent chloride. At this level of chloride, small surface area of the interface became the most anodic in the presence of abundant dissolved oxygen and moisture in the void. The number of pits tended to decrease as a segment was getting away from the interface. It is thought that this phenomenon was related to weakened macro-cell corrosion current in the deeper grout. Mean pit depth data did not follow the same trend in that it was fairly uniform in the neighborhood of 6 mil along the most part of the stressed strand length, including the interface section.


Federal Highway Administration | 1200 New Jersey Avenue, SE | Washington, DC 20590 | 202-366-4000
Turner-Fairbank Highway Research Center | 6300 Georgetown Pike | McLean, VA | 22101