U.S. Department of Transportation
Federal Highway Administration
1200 New Jersey Avenue, SE
Washington, DC 20590
202-366-4000
Federal Highway Administration Research and Technology
Coordinating, Developing, and Delivering Highway Transportation Innovations
| REPORT |
| This report is an archived publication and may contain dated technical, contact, and link information |
| Publication Number: FHWA-HRT-14-039 Date: May 2014 |
Publication Number: FHWA-HRT-14-039 Date: May 2014 |
Chloride threshold is defined as the minimum chloride concentration required to induce corrosion. By this definition, the lowest chloride concentration creating signs of corrosion seems to be the appropriate chloride threshold. Because exact amount of admixed chloride concentrations were known in this study, corrosion performance of stressed PT strands exposed to seven different chloride concentrations and one chloride-free mix was characterized by their electrochemical data collected through 6-month accelerated corrosion testing and subsequent autopsy results. The other chloride threshold for corrosion propagation was also sought by determining the lowest chloride concentration needed to produce measurable pits. Table 13 lists the lowest acid-soluble chloride concentrations experimentally determined for corrosion initiation and corrosion propagation.
Table 13. Summary of the lowest chloride concentrations observed in the present study.
| Criteria | Grout with Void | Fully Grouted | ||||
|---|---|---|---|---|---|---|
| Specimen Type | Lowest Chloride Concentration (Percent by Weight of Cement) | Specimen Type | Lowest Chloride Concentration (Percent by Weight of Cement) | |||
| Corrosion initiation | Single-strand specimens | 0.4 | Single-strand specimens | 0.6 | ||
| Corrosion propagation | Multi-strand specimens contaminated with excessive sulfate ions | 0 | Multi-strand specimens |
0.4 | ||
| Single- and multi-strand specimens | 0.8 | Single- and multi-strand specimens | 0.8 | |||
Finally, two chloride threshold values were selected among the numbers in table 13 for the PT strands protected by normal grout (see table 14 ). The first threshold is 0.4 percent by weight of cement including mixing water ([Cl-](cement+water)), which is the lowest amount to initiate corrosion of strands fully encased in normal grout. At this threshold, a small number of pits can begin to form on the strands in association with corrosion initiation process, but the rate of corrosion should be low. It is a conservative number, and there is still sufficient time to act against potential corrosion problems. Therefore, it can serve as the lower limit in assessing longer-term corrosion risk of PT bridges. The second critical chloride threshold is determined in association with corrosion propagation. At this threshold, corrosion starts to intensify in terms of number of pits and pit depth. Test results obtained in this study suggest that 0.8 percent [Cl-](cement+water) seems to be the critical threshold, which can be considered the upper limit in corrosion risk assessment. Once chloride concentration exceeds it, it is possible that significant corrosion damage can occur rapidly, and structural integrity of the PT bridges will be compromised. However, the actual rate of corrosion is influenced by many other factors set by individual bridges.
Table 14. Suggested chloride threshold values for normal grout.
| Classification | [Cl-](cement+water) |
|---|---|
| Chloride threshold for corrosion initiation | 0.4 percent |
| Critical chloride threshold for corrosion propagation | 0.8 percent |
It should be emphasized that these values are applicable to normal grout conditions only. They may not be adequate in other conditions such as segregated grout, duct cracks, grout voids filled with excessive water with or without chloride ions, and free sulfate ions in contact with the strands. In these circumstances, corrosion can start at different chloride concentrations, most likely below the suggested threshold values.
As shown in table 8, there are three units of chloride concentration to determine whether hardened grout powder samples taken from a PT bridge contain acid-chloride concentrations more than the chloride thresholds. When performing acid-soluble chloride titration with the field powder samples, the results are reported by [Cl-]sample. For the grout product used in this study, they represent approximately 50 percent of actual chloride content included in the grout powder samples. Therefore, 50 percent of the established chloride thresholds should be used–0.2 percent for corrosion initiation and 0.4 percent for corrosion propagation. If construction records of detailed grout mix proportions are available, the [Cl-]sample can be converted to those expressed by [Cl-](cement+water) using a correction factor that accounts for weight of cement and weight of mixing water in a particular grout product. The converted concentrations in the grout samples indicated total (100 percent) acid-soluble chloride concentrations present. Therefore, it is easy compare the analysis results against the chloride threshold values listed in table 14. If information about precise weight of cement is known but weight of mixing water is not, a concentration unit of [Cl-]cement should be used with another correction factor. For the same grout product, this conversion method yields about 75 percent of the acid-soluble chloride concentrations resided in the grout samples. Therefore, 75 percent of the suggested chloride thresholds should be used–0.3 percent for corrosion initiation and 0.6 percent for corrosion propagation. Table 15 summarizes the adjusted threshold values for three different concentration units.
Table 15. Adjusted chloride threshold values to be used for field grout powder samples.
| Classification | [Cl-](cement+water) | [Cl-]cement | Fraction of [Cl-](cement+water) | [Cl-]sample | Fraction of [Cl-](cement+water) |
|---|---|---|---|---|---|
| Corrosion initiation | 0.4 percent | 0.3 percent | 0.75 percent | 0.2 percent | 0.5 percent |
| Corrosion propagation | 0.8 percent | 0.6 percent | 0.75 percent | 0.4 percent | 0.5 percent |
Table 16. Example of corrosion risk management plan with the suggested chloride threshold values.
| Risk Level Classified by Different Chloride Threshold Values | If Weight of Cement and Mixing Water are Known | If Cement Weight is Known and Mixing Water Weight is Uncertain | If Weight of Cement and Mixing Water are not Known | Recommended Actions |
|---|---|---|---|---|
| Matching Corrected Chloride Threshold Values for Different Concentration Units | ||||
| [Cl-] (cement+water) | [Cl-]cement | [Cl-]sample | ||
| Low | ˂ 0.4 percent | ˂ 0.3 percent | ˂ 0.2 percent | Routine biennial bridge inspection |
| Intermediate | 0.4–0.8 percent | 0.3–0.6 percent | 0.2–0.4 percent | Routine biennial bridge inspection; develop a longer-term maintenance plan |
| High | ˃ 0.8 percent | ˃ 0.6 percent | ˃ 0.4 percent | Conduct immediate in-depth inspection; more frequent inspections |
The classification of risk levels and proposed actions for bridge inspection and maintenance are discussed below based on the chloride threshold values in terms of [Cl-](cement+water). The same approach can be adopted for the other sets of chloride threshold values listed in table 15. Depending on situation of each bridge, any of these categories may be modified for corrosion risk assessment.
The PT bridges may be classified as low-risk bridges if the mean [Cl-](cement+water) is less than 0.4 percent. At this chloride level, the PT tendons are likely to maintain corrosion-free condition; therefore, regular biennial bridge inspection is sufficient.
The intermediate risk group bridges contain mean [Cl-](cement+water) between 0.4 and 0.8 percent. Even though rate of corrosion in this group may be slow enough not to cause an immediate concern, they may progress into the high-risk group if PT seal systems are breached. Therefore, along with routine biennial inspection, development of an appropriate longer-term maintenance plan is recommended for bridges in this group due to their unpredictable corrosion behaviors. Specifically, all of the potentially problematic areas should be identified in the maintenance plan and subsequently inspected in detail when time and resources are available.
High-risk bridges refer to ones containing mean [Cl-](cement+water) higher than 0.8 percent. They require an immediate initial indepth inspection and subsequent inspections at closer intervals. It is safe to assume that these bridges may well undergo intensive pitting corrosion. This assumption is particularly true for bridges exposed to warm weather and those already having long post-construction service life. Every tendon deficiency found in a high-risk bridge needs to be addressed immediately or kept on a close watch until appropriate repair measures are developed.
The important issue here is how to determine statistically sound mean chloride concentrations for the whole bridge or various sections depending bridge characteristics. A separate small study is recommended to develop a statistically sound sampling methodology for sample size and its distribution, confidence interval, and acceptable data variation indicated by standard deviation, coefficient of variance, etc. The goal is to make sure that mean chloride concentrations are truly representative values for the bridge or sections of the bridge without unacceptable deviations. Otherwise, corrosion risk may be elevated, as there can be some outliers that are undetected through the improper statistical analyses. The outcomes of the study can be incorporated into the existing grout sampling guideline.(20) In addition to level of chloride contamination, annual temperature variation needs to be considered as part of the corrosion risk assessment since corrosion rate is heavily influenced by temperature. Longer duration of warm weather promotes more intense corrosion, as seen by the data obtained in this study.
The preceding section discusses corrosion risk of the PT bridges under the assumption that they are surrounded by reasonably good quality grout. As some test results indicated in this study, however, chloride threshold values for poor-quality grout having segregation and voids can be meaningless, as corrosion can initiate without chloride ions under these conditions. It is particularly alarming to learn that excessive corrosion damage can occur at much higher rates if the segregated grout contains elevated water-soluble free sulfate ions.
It is critical to assess condition of the strands and thoroughly and accurately locate grout defects. As the current state of inspection practices for PT bridges are labor intensive partly due to limited inspection tools and techniques, it is highly desirable to develop new technologies or improve the existing ones. While dealing with chloride contaminated grout issues, there should be more effort on a national level to develop 100 percent reliable non-destructive inspection technologies to diagnose corrosion damage in the tendons and identify grout defect areas.
This section offers an example of service life prediction modeling with a very simplified approach. It is hoped that more sophisticated modeling software will be developed in the near future to analyze various field conditions and provide accurate and reliable predictions.
A stressed PT strand will fail by corrosion when stress in the remaining cross-sectional area of the strand reaches the 270 ksi GUTS under a constant tensile load. Figure 263 shows an example of corrosion damage prediction model outputs for a corroding strand at different penetration rates. The following assumptions were made for the modeling:
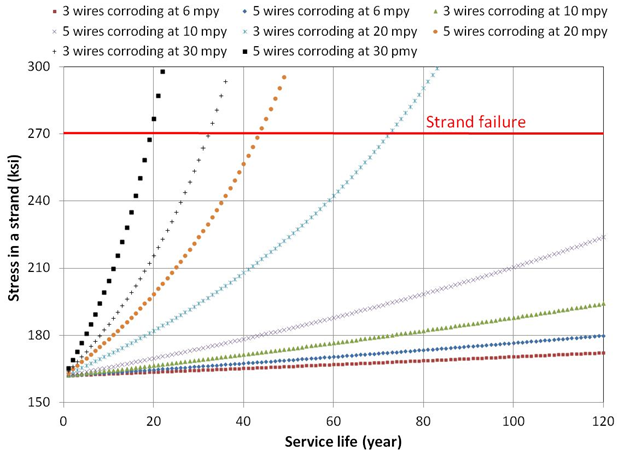
Figure 263. Graph. Example of a time-to-failure plot for a corroding strand at different penetration rates.
These assumptions may be unrealistic in the real world, but the model outputs can be informative because they illustrate the effects of cross section loss and penetration rates on structural integrity. The penetration rates used in the example are representative pit depths observed in the autopsied strands in the present study. If corrosion intensifies by rapidly losing cross-sectional area, the rate of stress buildup in the strand is no longer linear or linear-like, and strand failure occurs prematurely at higher rates. The test results indicate that corrosion damage of stressed strands increased significantly if total chloride concentration exceeded the critical chloride threshold of 0.8 percent by weight of cement. It is critical to determine present chloride concentrations in the affected bridges as soon as possible and take appropriate actions based on level of chloride contamination.
Based on the test results obtained from the 6-month accelerated corrosion laboratory study and subsequent data analyses, the following conclusions can be made:
This appendix contains examples of tendon corrosion problems caused by insufficient grout cover that were observed in three PT bridges in service. Figure 264 shows a failed externa PT tendon of the Verina-Enon bridge in Virginia. Little grout cover is visible between the 6 and 12 o’clock orientation.
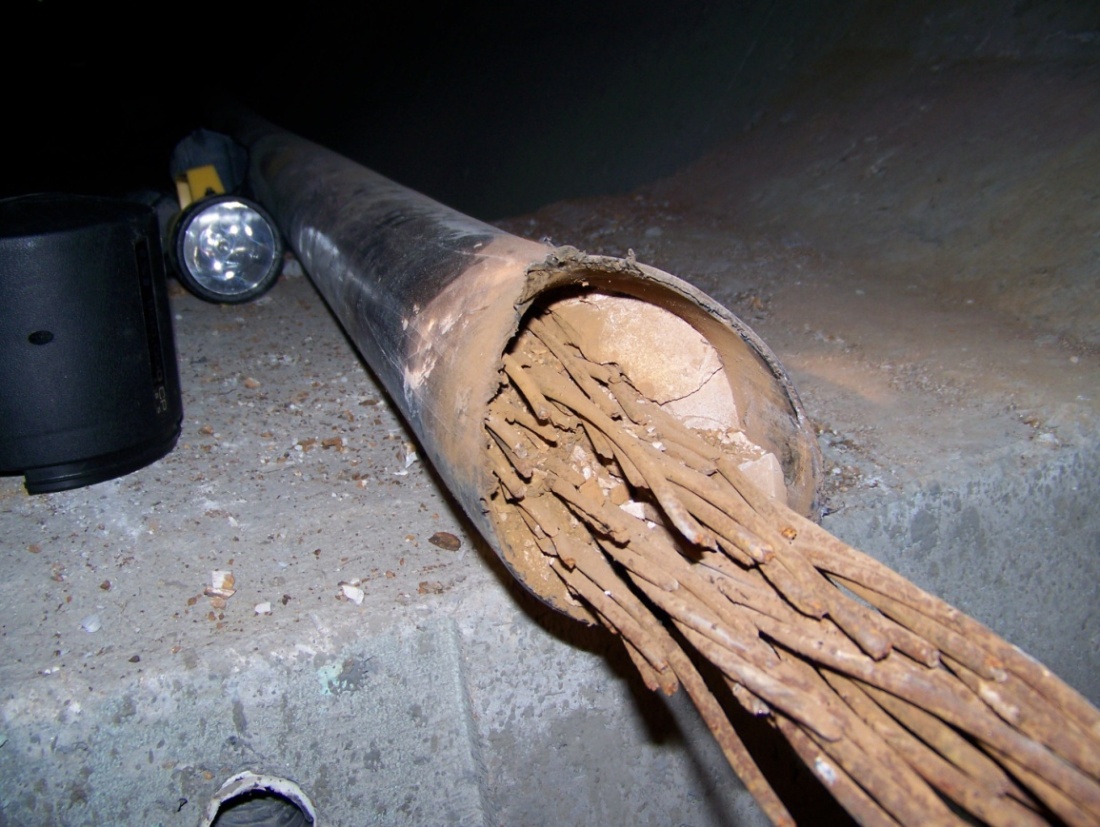
Figure 264. Photo. Failed external PT tendon of Verina-Enon bridge in Virginia.
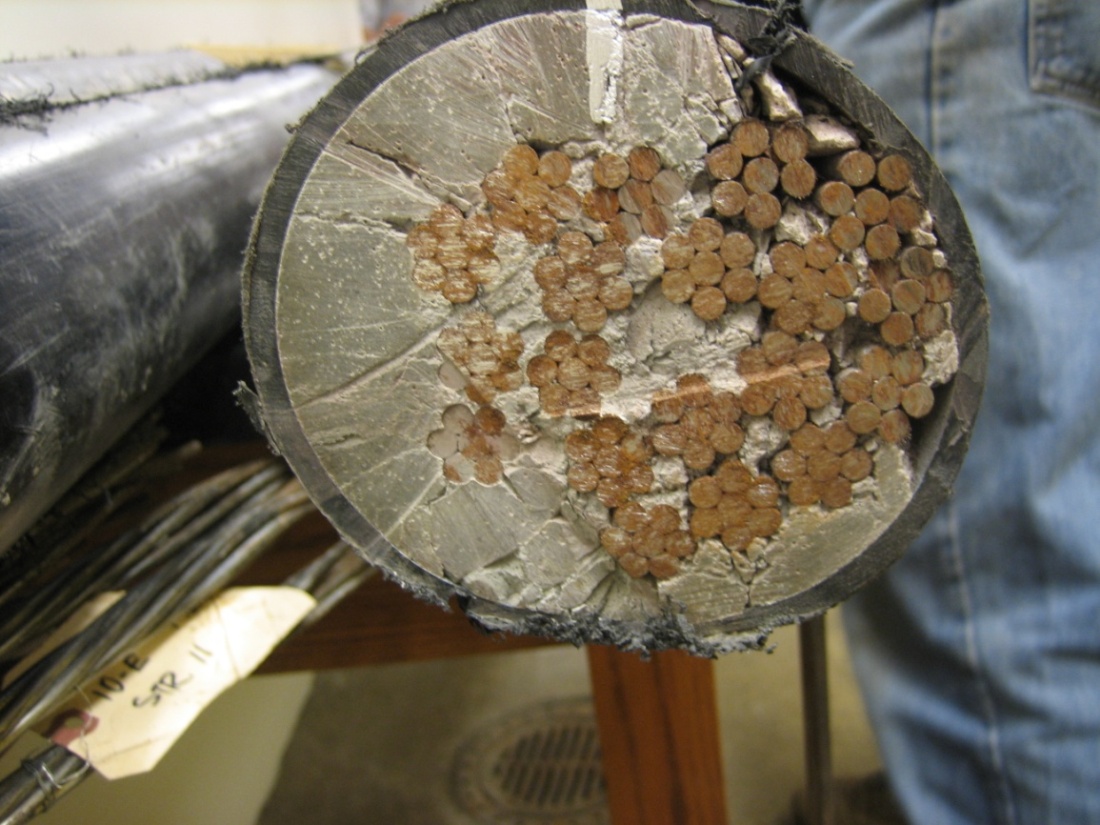
Figure 265. Photo. Other matching end of the retrieved tendon sample shown in figure 264 .
Figure 266 shows a corroding PT tendon of the Verina-Enon bridge in Virginia. Corrosion started in some areas with no grout cover near a deviation block that was exposed to stagnant water.
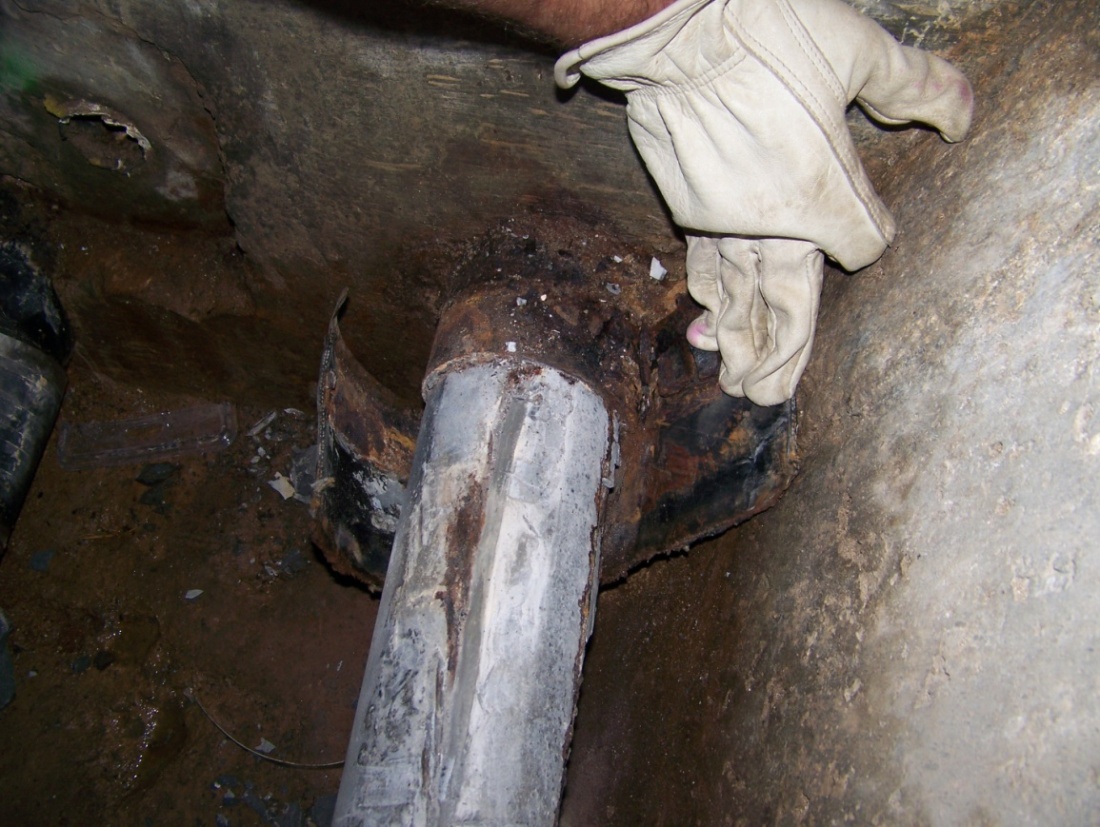
Figure 266. Photo. Corroding PT tendon of Verina-Enon bridge in Virginia.
Figure 267 shows an external PT tendon of the Verina-Enon bridge in Virginia. Little or no grout cover is visible along the free length of the tendon, but no corrosion was observed.
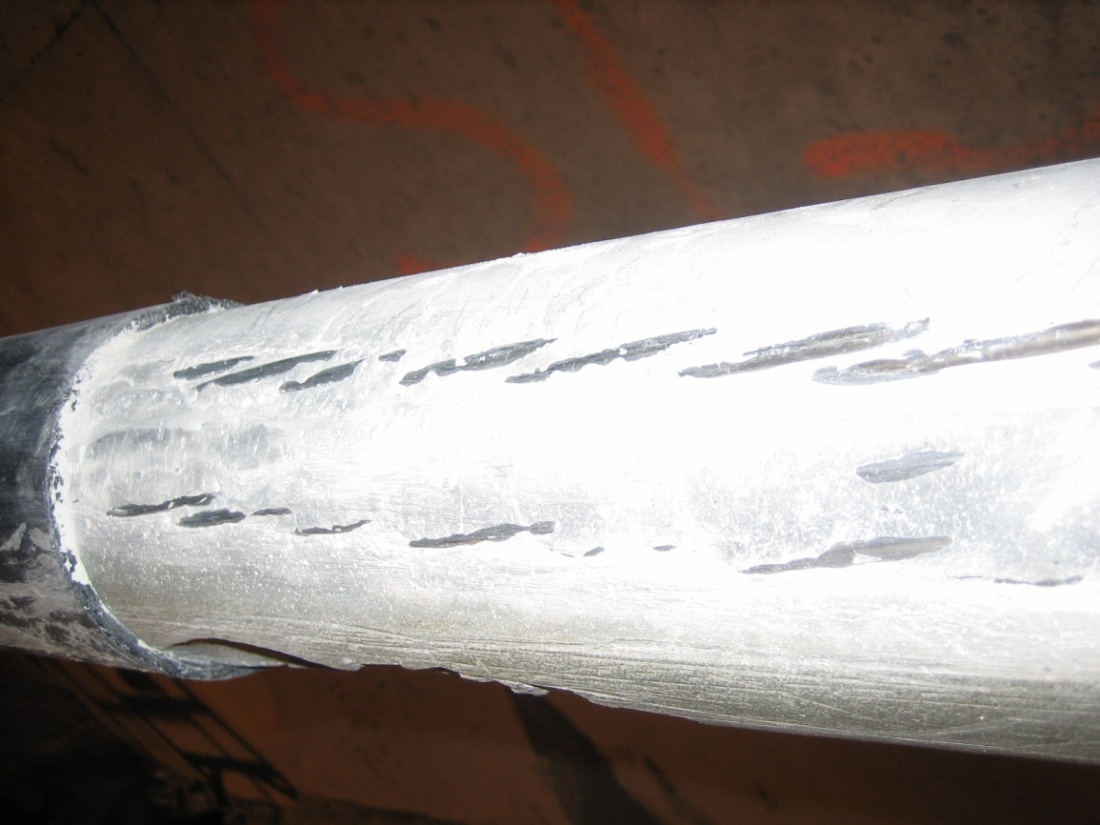
Figure 267. Photo. External PT tendon of Verina-Enon bridge in Virginia.
Figure 268 shows an external PT tendon of the Mid-Bay bridge in Florida. No grout cover was discovered.
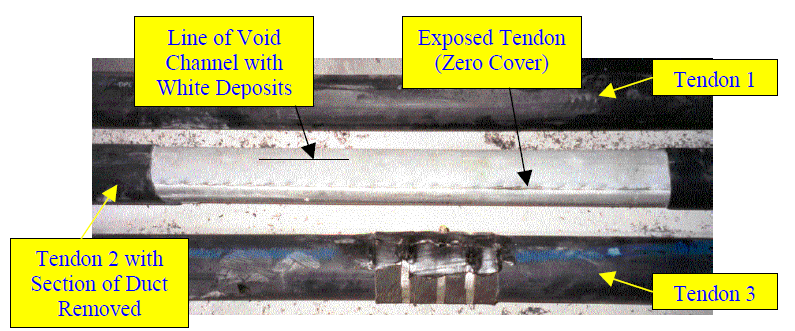
Figure 268. Photo. External PT tendon of Mid-Bay bridge in Florida.(21)
Figure 269 shows an external PT tendon of the Ringling Causeway bridge in Florida. Significant corrosion was observed in the areas with no grout cover in contact with segregated thin grout cover.
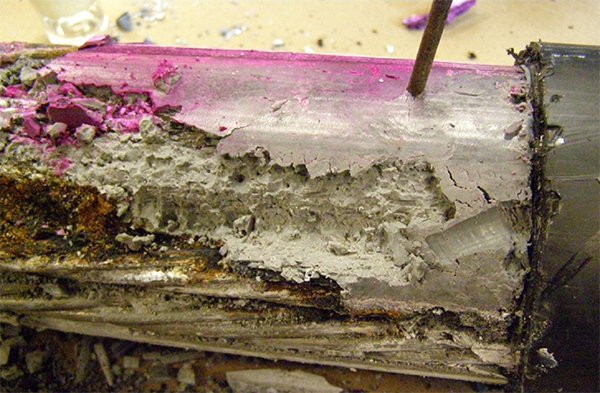
Figure 269. Photo. External PT tendon of Ringling Causeway bridge in Florida.(4)