U.S. Department of Transportation
Federal Highway Administration
1200 New Jersey Avenue, SE
Washington, DC 20590
202-366-4000
Federal Highway Administration Research and Technology
Coordinating, Developing, and Delivering Highway Transportation Innovations
| REPORT |
| This report is an archived publication and may contain dated technical, contact, and link information |
|
| Publication Number: FHWA-HRT-13-097 Date: September 2014 |
Publication Number: FHWA-HRT-13-097 Date: September 2014 |
This chapter discusses the conceptual framework and defines categories to organize operational interventions, traveler choice dimensions, and factors affecting user response. The framework’s core components are operational interventions, information dissemination, traveler choice dimensions, and network and non-network influencing factors.
Traveler behavior research is a broad domain. The synthesis presented in this chapter is not intended to be comprehensive over the entire domain. Rather, it focuses on choice dimensions that are influenced by and relevant to operational planning and management interventions. Interventions at this level have a narrower scope than, for example, the strategic level, which involves resource acquisition and network design. Nevertheless, long-term traveler decisions such as mode shifts, auto ownership, or location changes are of interest, as models of activity engagement and related decisions are becoming more realistic in practice. On the intervention side, the focus is mainly on ATDM. ATDM is a strategic approach to apply technology-supported measures in a proactive way to influence behavior and system performance and thus address potential problems before they occur. ATDM covers managing travel demand (MTD) and ICM, including dynamic mobility applications (DMAs). The synthesis also covers active traffic management (ATM) on the supply side since the delineation between supply and demand management is somewhat fuzzy, and some degree of overlap occurs in several areas, such as information supply.
Since most supply management interventions change the level of service of the network, the focus is on network factors influencing traveler behavior. However, demand management interventions may change non-network factors, as well. The range of interest for non-network factors influencing traveler behavior is broad and not rigidly delineated. Non-network factors are numerous, ranging from weather, which is natural and easy to observe, to walkability, which is more subjective and less straightforward to measure. The non-network factors are also important in that they interact with network factors in influencing traveler decisionmaking, as they define the environment (context) and relative attractiveness of choice alternatives. Furthermore, traveler characteristics as well as vehicle characteristics influence traveler choices.
Taken together, these confounding forces and influences become difficult to separate from one another. The comprehensive framework presented in the following sections attempts to conceptualize these person-network interactions over short-, medium-, and long-term time horizons. This framework seeks to capture the anticipated and actual effects of operational interventions on the supply and demand sides.
Conceptual Framework
Transport planning aims to describe, understand, and model the choices households and individuals make during the execution of their daily lives, including the more or less frequent journeys outside their daily activity space.(62,63) The behavioral demand models feed the supply and network models to assign traffic to the infrastructure. These models are in turn used to evaluate and optimize changes to the transport system undertaken by the owners of its various components (e.g., reduction or expansion of road capacity through interventions, including demand management and supply management as well as broader policy changes). Travelers make their decisions based on the characteristics of the system and travelers’ perceptions. For example, as new information becomes available, travelers adjust their perception and adapt their travel behavior. Different system factors as well as decisions en-route must be considered. People decide where they want to live, where their workplace is, and whether they will own one or more vehicles, buy monthly transit or toll passes, etc. Travelers must decide how often and where their everyday and less frequent journeys take them, their mode(s) of transport (where multimodal trip alternatives may be available), when to start trips, what destinations to visit along the way and for how long, and what route they want to take. In making decisions, individuals’ cognitive abilities and limited information availability play a substantial role, reflecting varying degrees of bounded rationality.(58,64,65) People attempt to make subjectively rational decisions based on a limited amount of knowledge and assessment capacities, not necessarily fully informed or objectively rational choices.
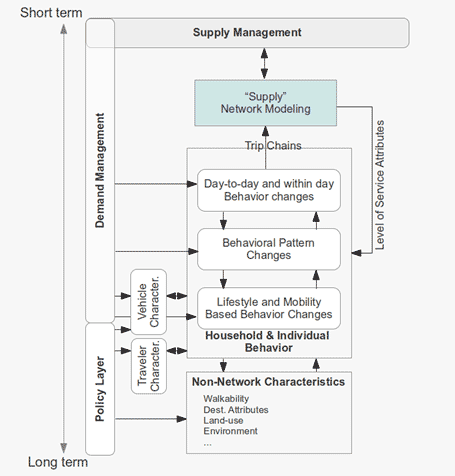
Operational interventions, supply and demand management, traveler choice dimensions, and factors affecting user response, which are considered either endogenous or exogenous, interplay with each other and are summarized in the conceptual framework in figure 1.
Household and individual behavior change dimensions can be categorized according to the time frame over which they might take place. The level of analysis where a particular decision or group of decisions must be considered includes the following:
Operational intervention programs can be categorized by the interventions or controls with which they seek to improve the system operations and performance by influencing the underlying traveler choices.(66) They can target the supply side, (i.e., the network with traffic and infrastructure access controls (e.g., ramp metering)), which in turn affects behavior changes through the level of service as an influence factor. Alternatively, operational interventions may affect the demand directly with pricing (i.e., congestion pricing). Demand and supply management overlap as information supply (i.e., variable message sign (VMSs), earlier traveler time dissemination, etc.) targets both the demand and supply sides indirectly through demand response.

Figure 1. Illustration. High-level conceptual framework.
In addition to demand management, which influences household and individual behavior directly, there are additional influencing factors, which can be divided into two categories: traveler and system factors.
Traveler factors can be further divided into the following categories:
System factors can be further divided into the following categories:
It is important to note that the behavior choices are preferably denoted as behavior changes, as they might often be better represented as the outcome of an adjustment process of a current choice rather than as the outcome of a first-time choice process that does not recognize one’s current state. Also, the arrows in figure 1 not only show the possible mappings of an explanatory variable on a possible outcome. Rather, they represent the perception of attributes and characteristics of the user in question.
Modeling and Simulation Frameworks
Three primary categories of modeling tools and simulation frameworks used in transportation studies are adapted in the case studies presented in this report. First, mesoscopic simulation-based DTA tools have become widely accepted platforms for delivering richer behavioral models to network analysis and evaluation applications. Second, microsimulation models for operations analysis are used in applications that involve more geometric detail associated with lane use and other localized interventions. Developments for the former class of tools have been shown to port rather well across software platforms, partly because most have been built on a similar blueprint developed and widely published in the early to mid 1990s. The second category is more challenging to develop generic procedures for, though experience shows that when there are valuable developments coming out of public sector research, vendors tend to adopt and incorporate them in their offerings. Third, rule-based computational process models and agent- based models aim to represent underlying processes directly, similar to a production system model, which contains complex if-then rules. As typically applied in social physics, these models have lacked the ability to statistically capture the significance of the factors embedded in the rules and as such are not always best suited to understand behavior changes, reflect observed behavior empirically or in experiments, or predict future changes for specific actual geographic areas. Conversely, they allow agents not only to interact with their environment, but also to interact with other agents. As a result, they can describe dynamic processes more completely than microsimulation models typically used in practice.
Application-Specific Modeling and Simulation Frameworks by Decreasing Time Frame
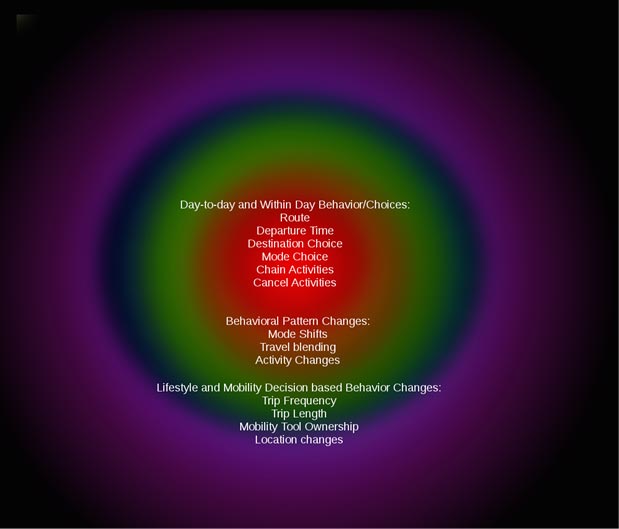
Fully configured comprehensive activity-based modeling systems are computationally very demanding, and it takes a long time to execute even a single run. Although figure 1 shows the interrelation of the different user behavior dimensions, which are affected by system or attribute changes, such a modeling system is operationally not practical. Because going through an exercise of updating medium- and long-term choice dimensions with every choice update based on short-term changes is not attractive nor useful, a key question for modelers is which choice dimensions must be treated as endogenous and which choices can be viewed as exogenous. Traditionally, supply and demand management strategies have been used to only update route choices or shortest path calculations in supply tools. However, with additional information provided to travelers, the range of endogenous choices included in the model can and should be expanded. This concept is illustrated in figure 2 where long-term changes are outside the modeling realm, and information blurs the boundary between day-to-day behaviors, behavioral patterns, and medium-term changes. As travelers gain more information, the inner sphere expands to include these behavioral patterns, which may be adjusting more dynamically than has been recognized in existing models.
The different case studies presented in the following chapters follow their time horizon from long-term policy interventions to short-term interventions. Each case study includes a general framework that points to the relevant choice dimensions to be included into the modeling tools. This framework discussion within subsequent chapters focuses on specific interventions and the associated data and modeling requirements. Within each of the following intervention areas, the following case studies are presented:

Figure 2. Illustration. Expanding sphere with fuzzy boundaries.