Alternative Intersections/Interchanges: Informational Report (AIIR)
CHAPTER 10. ALTERNATIVE INTERSECTION ASSESSMENT METHODOLOGY
The methodology that is presented in this chapter attempts to broaden the perspective of transportation engineers so that they will consider alternative intersections and interchanges in their project planning and decisionmaking. Traffic engineers, highway designers, transportation planners, and other transportation professionals who have been involved with the development of intersection and interchange designs, either as part of improvement projects for existing junctions or the design of new junctions, have frequently complained about the lack of guidance on when and where evolving or new conceptual alternatives are appropriate. Guidance developed to date has been somewhat limited, qualitative, and generalized. For example, consider the following information about MUT crossovers presented in the Signalized Intersections: Informational Guide:(49)
Due to the design, median U-turn crossovers require a wide median to enable the U-turn movement. Median U-turns may be appropriate at intersections with high major street through movements, low to medium left turns from the major street, low to medium left turns from the minor street, and any amount of minor street through volumes. Locations with high left-turning volumes may not be good candidates because the out-of-direction travel incurred and the potential for queue spillback at the median U-turn location could outweigh the benefits associated with removing left turns from the main intersection. Median U-turns can be applied on a single approach.
This guidance does not contain specific numerical values to assist transportation professionals in knowing when MUTs are applicable or most appropriate. Transportation professionals need more specific guidance. The key aspect of the alternative intersection assessment methodology is a Microsoft Excel® spreadsheet. Users can enter design hour turn movement volumes and turn lanes for an at-grade intersection into a spreadsheet. The resulting CLV sums are then calculated for the full range of alternative intersections in the spreadsheet. A summary sheet indicates whether the total CLV sums exceed a specific threshold, thereby indicating whether the intersection alternative should be advanced for more detailed consideration.
10.1 DESCRIPTION OF ALTERNATIVE INTERSECTION ASSESSMENT METHODOLOGY
Transportation planners, highway designers, and other transportation specialists can employ the process described in this section when they develop or evaluate designs for improvements to at-grade intersections. The process is shown in figure 208 and consists of six steps.
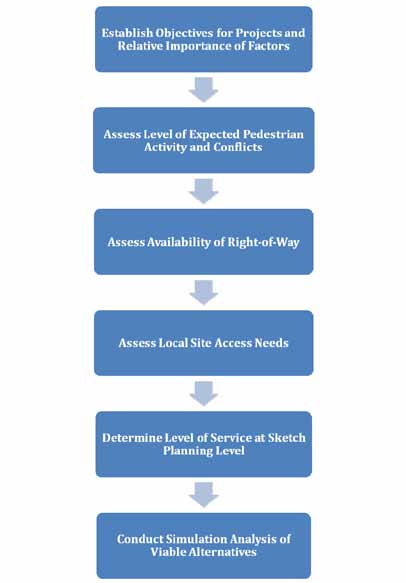
Figure 208. Chart. Alternative intersection assessment methodology.
10.1.1 Step 1. Establish Objectives
As the first step, the specific objectives for the site of interest are established by the stakeholders. The objective setting allows greater flexibility with respect to the prioritization and weighting of factors for different projects. For example, at an urban intersection project near several activity centers, pedestrian mobility and safety could be assigned significantly higher weights compared to an intersection improvement project at a remote rural location in a vastly undeveloped area. If the stakeholders identify an overriding objective, such as pedestrian mobility, then the full range of intersection alternatives should be assessed first with respect to this sole criterion. This serves as a simplified screening of the alternatives to see if that objective matches a particular strength of an alternative. For example, consider a corridor through a resort shopping area. If the stakeholders establish that speed control and minimal excessive delays are the primary criteria, then the RCUT treatment in a super street corridor could be subsequently identified as the most promising among the alternatives. If an intersection alternative is judged to be poor with respect to the primary objectives established by the stakeholders, then that intersection alternative could be eliminated from further consideration.
For this intersection alternative assessment procedure, the next four steps are to screen alternatives with respect to the following specific factors:
- Pedestrians and conflicts.
- Right-of-way.
- Access.
- Capacity and vehicular throughput.
The underlying premise is that some alternative intersection designs are better suited to certain situations compared to others. Similarly, some alternative designs are less appropriate for a given set of conditions. By investigating the range of alternative intersections as part of a first order screening, alternatives that have sufficient promise can be identified and subsequently advanced to more detailed traffic analysis and design stages.
10.1.2 Step 2. Pedestrian and Conflict Assessment
The second step in the intersection assessment is to examine the alternatives with respect to pedestrians and conflicts. As indicated previously in this report, pedestrian mobility needs can be met by all of the alternative intersections, albeit to differing degrees. For example, MUT and QR intersections have been judged to be more favorable to accommodating pedestrians crossing all legs than the other alternative intersections. In the case of the MUT intersection, the removal of left-turn maneuvers and associated left-turn phases from a conventional intersection result in fewer conflict points for pedestrians. In addition, the removal of the left-turn signal phases also allows for a reduction in the cycle length, which consequently reduces pedestrian delays. While the conflicting right-turning volume is expected to be higher at an MUT intersection compared to a conventional intersection, the reduction in the number of expected conflicts between left-turning vehicles and pedestrians on all four legs has a positive safety effect for pedestrians. This pedestrian benefit may offset the increase in the right-turning volume. Similarly, the QR intersection also enhances pedestrian safety at the main intersection by removing all left turns. Depending on their origins, destinations, and directions of travel, some pedestrians may need to cross an additional intersecting leg at a QR intersection.
If the pedestrian activity in the immediate vicinity of the subject intersection is low or nonexistent, then all four at-grade alternative intersections and roundabout designs are viable. However, if pedestrian activity is high on all four legs, then three alternative intersection designs are viable. Depending on the user's perspective, there are limitations with respect to accommodating pedestrians for two alternative intersection designs, specifically, the roundabout and the RCUT intersection. Because there are no traffic signals to stop traffic at roundabouts, some pedestrian advocates have expressed concerns about the ability of pedestrians, notably pedestrians with disabilities, to safely cross approaches to the roundabouts. As described earlier, the RCUT intersection allows pedestrians to cross diagonally but not directly across the major roadway leg at the main intersection. Pedestrians can be afforded a direct crossing of the major road at a signal-controlled midblock crossing located beyond the main intersection. However, the RCUT intersection's inability to allow direct crossings of all legs at the main intersection may be sufficient to drop this alternative from further consideration if the subject intersection has very high levels of pedestrian activity. Table 34 summarizes general guidance with respect to viable alternative intersections as a function of the level of importance placed on meeting pedestrian mobility needs at a subject intersection.
Table 34. Qualitative assessment of alternatives as a function of pedestrian mobility and degree of conflict.
Relative Level of Importance for the Need to Provide Crosswalks |
Alternative Intersection Design to Consider |
Low |
MUT |
QR |
DLT |
RCUT |
Roundabout |
High |
MUT |
QR |
DLT |
Roundabout |
Relative Level of Importance for Magnitude of Conflicts Between Pedestrians and Vehicles |
Viable Alternative Intersection Design to Consider Further |
Low |
MUT |
QR |
DLT |
RCUT |
Roundabout |
High |
MUT |
QR |
DLT |
RCUT |
For the treatment of pedestrians, there are little collision data for the alternative designs to support claims about the relative degree of safety of these alternative intersections. There is also minimal information on the influence of these alternative intersections on pedestrian demand. Some hypothesize that alternative intersections may impose greater risks to pedestrians since they are not conventional and may result in more pedestrian expectancy violations. The relative degree of difficulty that is faced by a pedestrian when crossing at an alternative intersection may be qualitatively assessed.
10.1.3 Step 3. Right-of-Way Assessment
The third step in the intersection alternatives assessment methodology is to assess alternatives in terms of the availability of the right-of-way to accommodate the alternative and the cost of additional right-of-way if more is needed. There are greater challenges to implementing these alternative intersection alternatives if the median width is insufficient to accommodate U-turns and if additional and costly right-of-way is needed for the alternative. In some cases, the cost of the additional right-of-way may make many of the alternative intersections cost prohibitive. Depending on the design and whether existing streets can serve the function of a quadrant, the QR intersection may require a significant amount of additional right-of-way for the new roadway connector. Therefore, as the total cost for additional right-of-way increases, QR intersections may become less attractive as a viable design. However, if the network street exists in one or more of the quadrants, then the QR intersection could be the best design form for a given intersection. Similarly, roundabouts can have larger footprints than other alternative intersections. If the area is densely developed or if right-of-way is limited and very expensive, then roundabouts may not be a viable alternative. If the existing median is sufficiently wide to accommodate the needed number of U-turn lanes, then both the MUT and RCUT intersection are viable. However, if the median width is not sufficient, constructing an MUT intersection or a RCUT intersection in a retro-fit manner is much more challenging but not insurmountable with the use of loons. Table 35 presents a summary of these points.
Table 35. Qualitative assessment accommodation, affordability, and availability.
Adequacy of Median Widths to Accommodate U-Turns |
Affordability of Additional Right-of-Way Required |
Viable Alternative Intersection Design to Consider Further |
Sufficient |
Affordable |
MUT |
RCUT |
DLT |
Roundabout |
QR |
Sufficient |
Very costly |
MUT |
RCUT |
DLT |
Insufficient |
Affordable |
MUT |
RCUT |
DLT |
Roundabout |
QR |
Insufficient |
Very costly |
MUT with loons |
RCUT with loons |
10.1.4 Step 4. Access Assessment
The next step in the methodology is to assess the need to preserve or provide access to adjacent parcels (e.g., via driveways) from either the major or the minor approaches in the vicinity of the subject intersection. These are often important issues in arterial design. All of the alternative intersections should be included as viable alternatives wherever the primary goal of the major road is to serve through vehicles. The RCUT intersection implemented as part of a corridor-wide treatment offers many advantages over all the other alternative intersections and conventional intersections. The median U-turn intersection is also best implemented as part of a corridor-wide treatment. In addition, a DLT intersection may be a highly desirable design to move more traffic through a heavily congested conventional intersection. However, if there is a strong need to preserve or provide access to developments in all four quadrants, then there will be greater challenges to installing a DLT intersection. Adjacent frontage roads would be required to meet the access needs within about 800 ft of the major intersection. Table 36 indicates viable alternative designs as a function of the need to provide access to parcels in four quadrants.
Table 36. Qualitative assessment of alternatives of need to provide access to all four quadrants.
Need to Provide Local Driveways in
Close Proximity |
Viable Alternative Intersection Design
to Consider Further |
Low |
RCUT |
MUT |
Roudabout |
QR |
DLT |
High |
RCUT |
MUT |
QR |
Roundabout |
10.2 TRAFFIC ANALYSIS OF ALTERNATIVE INTERSECTIONS
This section discusses the final two steps in the intersection alternatives assessment methodology. These steps involve an analysis of the traffic effects of the alternative intersection designs compared to a comparable design. While it is highly desirable to conduct traffic simulation analysis of all alternatives, frequently, there is neither the time nor the budget to do so. Consequently, many decisions are made regarding which alternatives to advance based on judgment without analysis. The intersection alternative assessment methodology recognizes this as a potential limitation. Consequently, a sketch-planning analytical method was developed to perform a level-of-service analysis of all the alternatives using the CLV summation technique. The method considers the CLV entering an intersection.
The underlying premise of the CLV summation technique is that the intersection is viewed as a common space that is shared in a sequential manner by a set of conflicting traffic movements. For example, a southbound left turn cannot be made simultaneously when the northbound movement is being made. Hence, the north-south critical movements may be either the southbound left turn and the northbound through or the northbound left turn and the southbound through according to whichever has the higher sum of lane volumes. Similarly, the east-west critical movements are calculated in an analogous manner. The sum of the CLVs for east-west and the CLVs for the north-south are considered the CLV sum for the intersection. The intersection CLV sums are then correlated to a LOS. The following values in table 37 have been used in determining LOS.
Table 37. CLV sum and corresponding LOS.
CLV Sum |
LOS |
< 1,200 |
C or better |
1,201–1,400 |
D |
1,401–1,500 |
E |
> 1,600 |
F |
10.2.1 Step 5. CLV Summation/LOS Assessment
The fifth step in the selection methodology is to assess the still-promising alternatives to a sketch-planning operational analysis. To assist transportation professionals with this analysis,
a Microsoft Excel® spreadsheet was developed. It allows users to enter design hour turn movements and basic number of left-, through, and right-turn lanes by approach for a conventional intersection. The tabs within the spreadsheet were developed to translate that
input information into data that conform to the alternative intersections. Samples of these
outputs are shown in figure 209 through figure 216. This spreadsheet will be made available
at some future time.
The figures show how the CLV sum indicates that some intersection alternatives will operate.
In general, transportation professionals conclude that an alternative will not work if the LOS is LOS F. Consequently, a CLV sum in excess of 1,600 indicates that the intersection does not work. Table 39 presents a summary of results based on the number of lanes for left-, through, and right-turning movements selected by the user. Thus, for these volumes and number of lanes, the promising alternatives include the partial N-S and full DLT intersections.
Table 38. Table for entering input volumes.
Direction |
Eastbound |
Westbound |
Northbound |
Southbound |
U-turns |
10 |
10 |
10 |
10 |
Left |
200 |
200 |
550 |
550 |
Through |
600 |
600 |
2050 |
2050 |
Right |
350 |
350 |
350 |
350 |
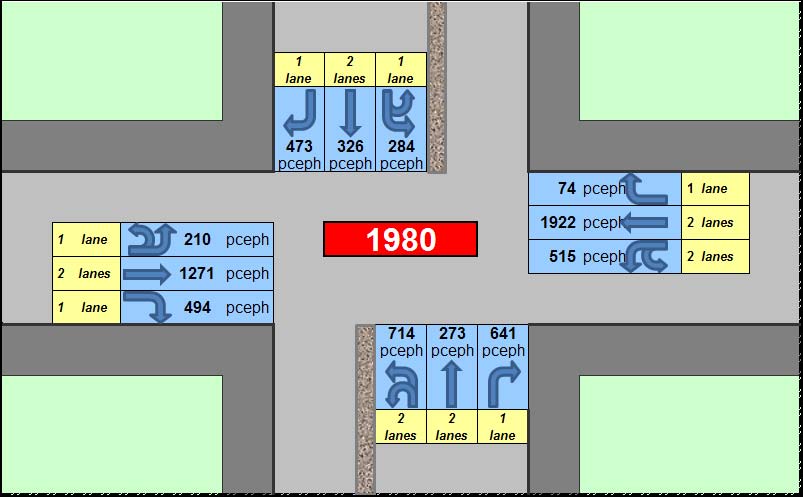
Figure 209. Illustration. Spreadsheet tab pertaining to a conventional intersection.
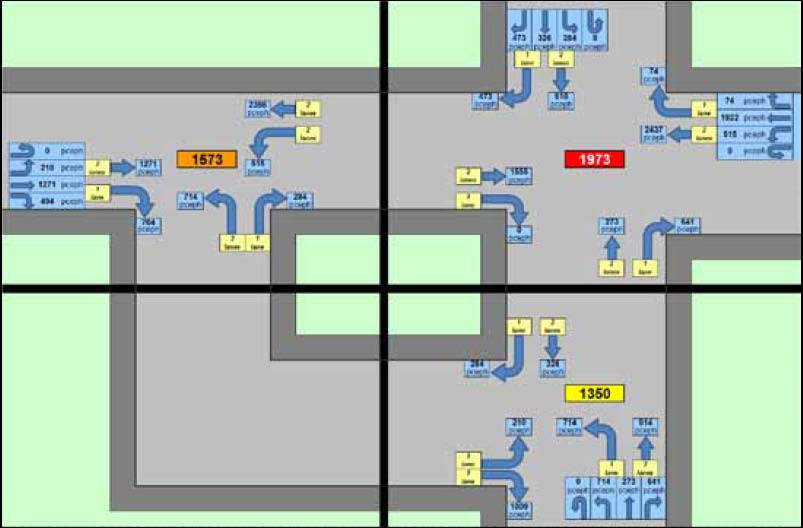
Figure 210. Illustration. Spreadsheet tab pertaining to a QR intersection.
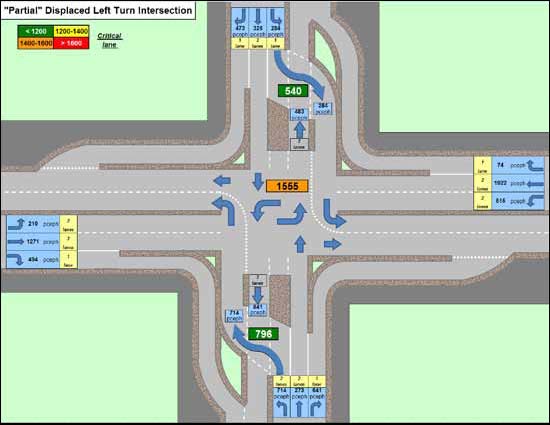
Figure 211. Illustration. Spreadsheet tab pertaining to a partial (N-S) DLT intersection.
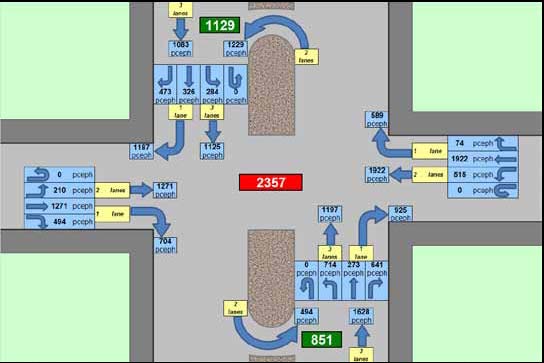
Figure 212. Illustration. Spreadsheet tab pertaining to an MUT (N-S) intersection.
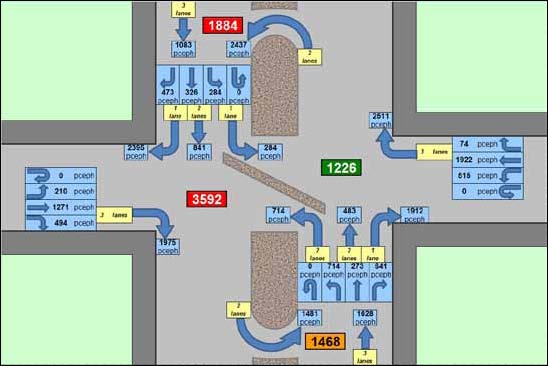
Figure 213. Illustration. Spreadsheet tab pertaining to a RCUT (N-S) intersection.
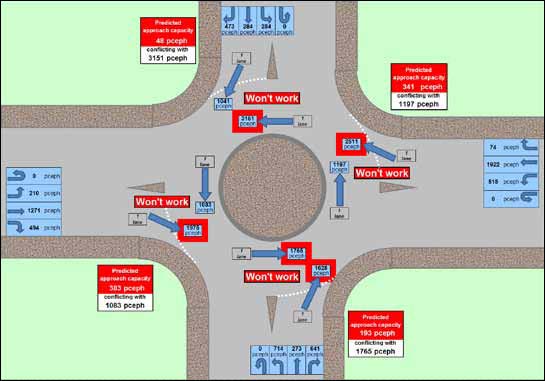
Figure 214. Illustration. Spreadsheet tab pertaining to a one-lane roundabout.
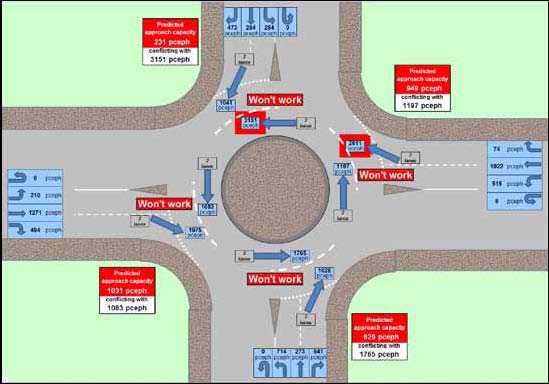
Figure 215. Illustration. Spreadsheet tab pertaining to a two-lane roundabout.
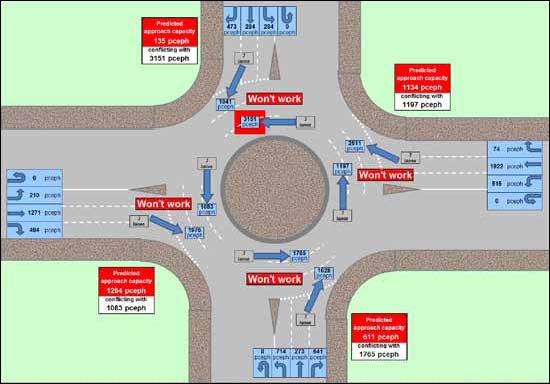
Figure 216. Illustration. Spreadsheet tab pertaining to a three-lane roundabout.
Table 39. Summary of CLV summation results.
Intersection Type |
CLV Sum |
Adequacy (Adequate at CLV Sum < 1,600) |
1 |
Conventional Intersection |
1,980 |
Inadequate |
2 |
QR intersection |
SW |
1,973 |
Inadequate |
NE |
2,072 |
Inadequate |
SE |
1,929 |
Inadequate |
NW |
2,357 |
Inadequate |
3 |
DLT intersection |
N-S |
1,555 |
Adequate |
E-W |
2,159 |
Inadequate |
Full |
1,444 |
Adequate |
4 |
RCUT intersection |
N-S |
3,592 |
Inadequate |
E-W |
1,743 |
Inadequate |
5 |
MUT intersection |
N-S |
2,357 |
Inadequate |
E-W |
1,984 |
Inadequate |
Partial MUT intersection |
N-S |
2,358 |
Inadequate |
E-W |
2,120 |
Inadequate |
6 |
One-lane roundabout |
Four approaches will not work |
Inadequate |
7 |
Two-lane roundabout |
Four approaches will not work |
Inadequate |
8 |
Three-lane roundabout |
Four approaches will not work |
Inadequate |
10.2.2 Step 6. Traffic Simulation Assessment
The final step in the selection methodology is to develop 25 percent of the design plans and detailed traffic simulation analysis of the most promising alternatives. This allows the development of more reasonable cost estimates for the alternatives. Users have to make a final decision on what alternatives to advance.
10.3 CASE STUDY
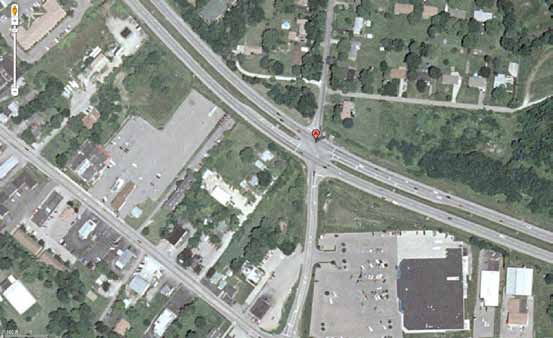
To demonstrate this process, the following case study is presented. Consider the intersection shown in figure 217. The intersection is in a suburban area of Summerside, OH. The primary highway is U.S. Route 32, which is a four-lane divided highway with an approximate median width of 42 ft. The crossroad is Bells Lane, which is a two-lane undivided road. A retail center is in the southeast quadrant of the signal-controlled intersection. The north leg of Bells Lane serves primarily as a residential area. Figure 218 shows an aerial view of the intersection.
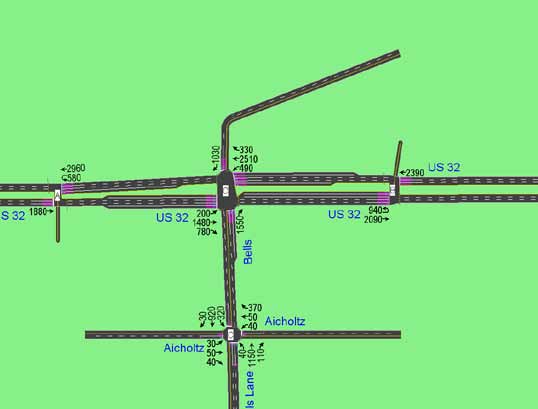
Figure 217. Illustration. U.S. Route 32/Bells Lane intersection.
Source: Google™ Earth
Figure 218. Photo. Aerial view of U.S. Route 32/Bells Lane intersection.
The area is projected to experience an increase in development. As part of a project planning study, turn movement projections are developed for the morning peak hour for the year 2030, which has been selected as the design year. The projections are summarized in table 40.
Table 40. Projected year 2030 morning peak hour turn movement counts for case study intersection.
Approach |
Movement |
Projected 2030
AM Peak Hour Turn Volume |
Eastbound |
Left |
200 |
Thru |
1210 |
Right |
470 |
Total |
1,880 |
Westbound |
Left |
70 |
Thru |
1830 |
Right |
490 |
Total |
2,390 |
Northbound |
Left |
680 |
Thru |
260 |
Right |
610 |
Total |
1,550 |
Southbound |
Left |
270 |
Thru |
310 |
Right |
450 |
Total |
1,030 |
Grand Total |
6,850 |
The pedestrian activity in the area is limited, and there are few pedestrians observed during the daylight hours on a typical weekday and weekend. The existing right-of-way is approximately 160 ft, and the price for additional land is not considered to be cost prohibitive.
As part of step 1, the stakeholders support the following objectives:
- Enhance safety.
- Reduce delay and congestion.
- Accommodate planned development in smart growth manner.
- Maintain or increase the corridor capacity of U.S. Route 32.
As part of the second step in the process, pedestrian activity is such that the at-grade alternative and the other five nontraditional intersections are all judged to be viable alternatives from a pedestrian perspective. The number of pedestrian-vehicle conflict points and the vehicle-vehicle conflict points differ among the nontraditional intersection designs. However, pedestrian crossing volumes are so low that there is no reason to reject any of the nontraditional intersections from a pure pedestrian service perspective.
As noted earlier, the available right-of-way is approximately 9,160 ft, and the cost of additional right-of-way is not cost prohibitive to purchase. Hence, from a right-of-way perspective, all of the alternative designs are considered viable as part of the right-of-way availability and cost assessment, which is the third step in the process.
The fourth step in the process is to screen the alternatives with respect to access management. Since there are no driveways on U.S. Route 32 in the study area, there is no current or planned need to accommodate access needs on the major road in the immediate vicinity of the intersection. In addition, the existing driveways to commercial development on Bells Lane south of the intersection are judged to be a sufficient distance from the major intersection such that they can be maintained or converted into a right-in right-out if a median is needed on Bells Lane. All of the nontraditional intersections except for the full DLT intersection design are deemed to be feasible despite the limited distance between the main intersection and the minor intersection on Bells Lane north of the major intersection.
The fifth step in the process is to examine all the alternatives from a sketch-planning LOS analysis. The volumes are entered into the spreadsheet, and the results are summarized in
figure 219 through figure 223. A summary of the outputs shown in table 41 reveals that only
the RCUT intersection design has a CLV sum less than 1,600 veh/h. This result indicates
that the RCUT intersection is a promising alternative that should be advanced to subsequent design phases.
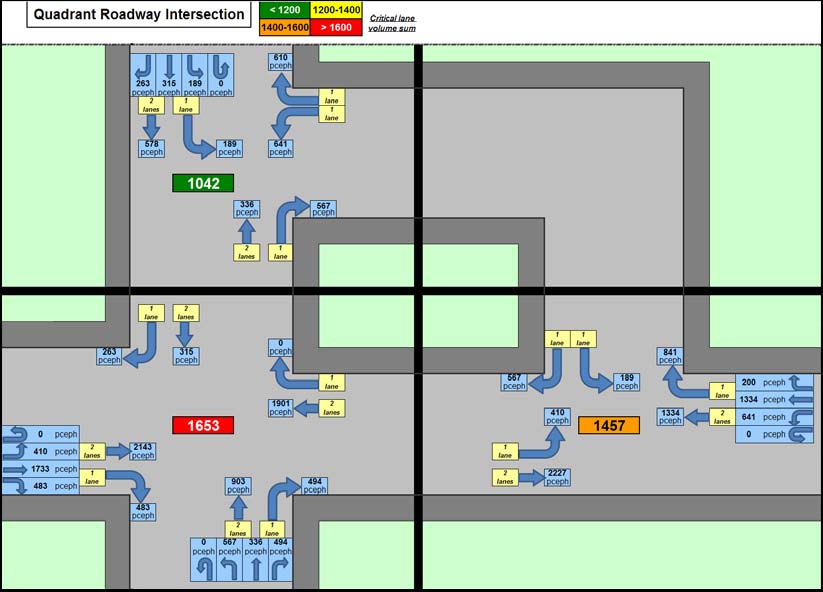
Figure 219. Illustration. Spreadsheet tab pertaining to a QR intersection.
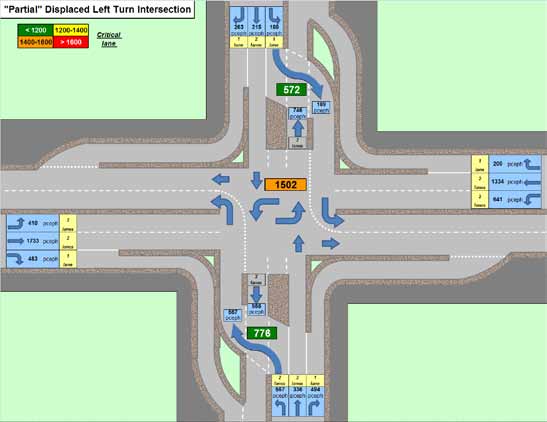
Figure 220. Illustration. Spreadsheet tab pertaining to a DLT intersection.
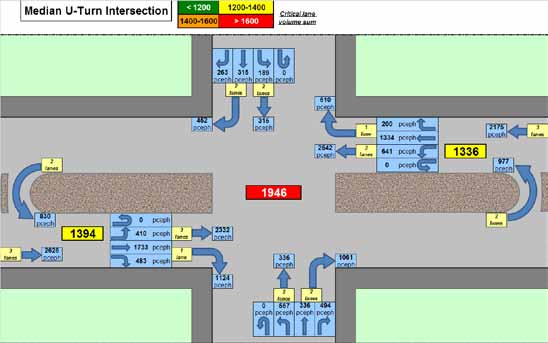
Figure 221. Illustration. Spreadsheet tab pertaining to an MUT intersection.
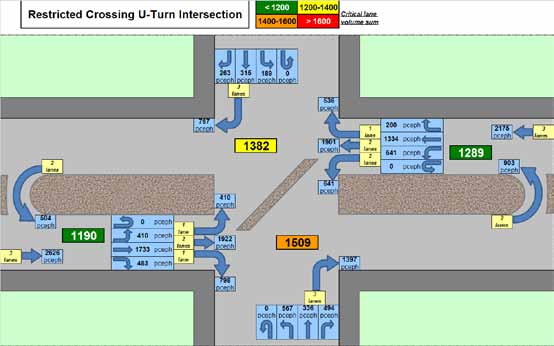
Figure 222. Illustration. Spreadsheet tab pertaining to a RCUT intersection.
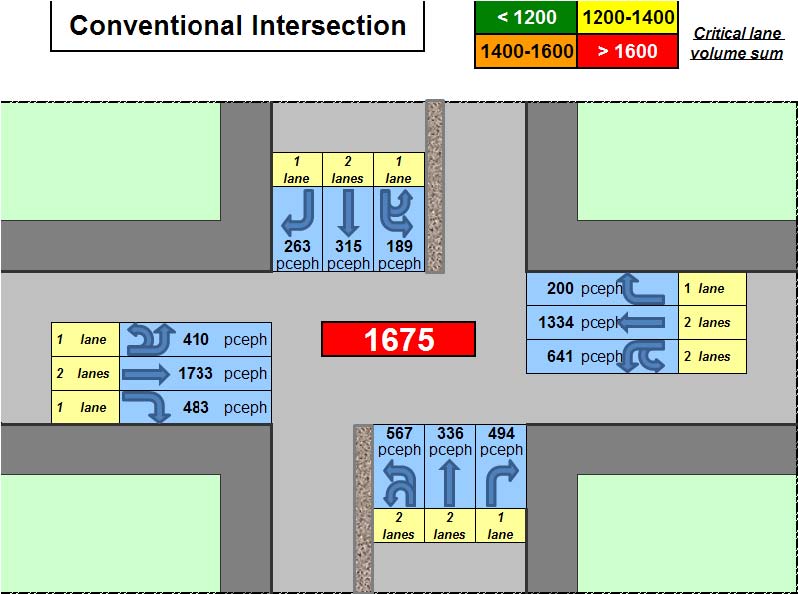
Figure 223. Illustration. Spreadsheet tab pertaining to a conventional intersection.
Table 41. Spreadsheet tab pertaining to summary results.
Intersection Type |
CLV Sum |
Adequacy (Adequate if CLV Sum < 1,600) |
1 |
Conventional Intersection |
1,675 |
Inadequate |
2 |
QR intersection |
SW |
1,569 |
Adequate |
NE |
1,653 |
Inadequate |
SE |
2,138 |
Inadequate |
NW |
1,653 |
Inadequate |
3 |
DLT intersection |
NS |
1,502 |
Adequate |
EW |
1,621 |
Inadequate |
Full |
1,463 |
Adequate |
4 |
RCUT intersection |
NS |
2,909 |
Inadequate |
EW |
1,509 |
Adequate |
5 |
MUT intersection |
NS |
2,027 |
Inadequate |
EW |
1,946 |
Inadequate |
Partial MUT intersection |
NS |
1,695 |
Inadequate |
EW |
1,978 |
Inadequate |
6 |
One-lane roundabout |
N/A |
Four approaches will not work |
Inadequate |
7 |
Two-lane roundabout |
N/A |
Four approaches will not work |
Inadequate |
8 |
Three-lane roundabout |
N/A |
Four approaches will not work |
Inadequate |
The sixth step consists of a more detailed traffic and design assessment of the alternative. The Ohio Department of Transportation (ODOT) used Synchro® to further investigate the traffic impacts of a super street.(21) While Synchro® may not be as robust an evaluation tool as a simulation program such as VISSIM®, it is adequate to provide a better analysis of the alternatives than the sketch planning procedure. The network evaluated is shown in figure 217, and their results confirmed that the RCUT intersection provided acceptable LOS for both the morning and afternoon peak hours. In developing the 25 percent design plans, the ODOT made further refinements to the RCUT intersection in order to accommodate traffic on the northern leg and future planned development. The resulting alternative is shown in figure 224. This alternative was still being considered as a viable alternative by ODOT at the time this report was prepared.
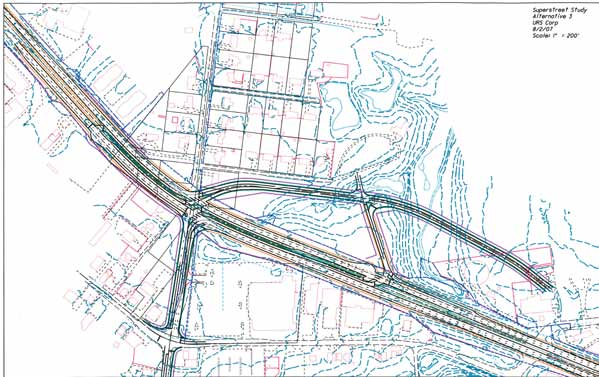
Figure 224. Illustration. Proposed configuration at the intersection of U.S. Route 32/Bells Lane intersection used in case study.
In conclusion, it can be seen that the process developed for this report and documented in this chapter provides a simplified method to consider and to screen a range of nontraditional intersections designs. This process can serve as a means to identify additional nontraditional intersection designs that might not have been included as viable alternatives. The process could be refined in subsequent research efforts. As a first order of magnitude tool, though, it helps to empower the transportation professional to promote creative and innovative thinking and to generate reasons for advancing nontraditional intersections.
|


