Safety Evaluation of the Safety Edge Treatment
Chapter 4. Analysis Results for Safety Evaluation
This chapter presents the safety
evaluation approach, the development of SPFs, and the safety evaluation results. The safety evaluation results
include the findings of a before-period compatibility study, a before-after evaluation using the EB
technique, a cross-sectional analysis, and an analysis of shifts in
crash severity.
4.1 Evaluation Approach
Two statistical approaches were
used to evaluate the safety effectiveness of the safety edge treatment: (1) a before-after comparison of the
effect of pavement resurfacing with and without
the safety edge treatment using the EB technique and (2) a cross-sectional
comparison of the effect of pavement
resurfacing with and without the safety edge treatment based on after-period data
only. These two evaluation approaches were applied concurrently to provide
alternative statistical approaches to the
key issues being addressed. The following discussion describes these
evaluations, including issues related to the specific nature of the safety edge
treatment.
A key objective of the
evaluation was to determine the safety effectiveness of the safety edge treatment while avoiding the potential confounding
effects of regression to the mean and the safety effect of pavement resurfacing. Regression
to the mean is a characteristic of repeated measures data in which
observations move toward the mean value over time. That is, if an observation
in a year is unusually high, then the
observation in the following year will nearly always be lower (and vice versa), returning to the mean. This phenomenon
often leads to an overestimation or underestimation of safety for some
sites. Thus, the effect of the treatment is likely to be partially confounded
with the expected decrease or increase in crash experience from regression to
the mean. Regression to the mean can only be accounted for with knowledge of
the "normal" or expected value of before-period crash experience at the treated
sites. The EB technique has the advantage of compensating for regression to the mean. The cross-sectional
approach does not explicitly compensate for regression to the mean. This
concern is lessened by the availability of 3 years of crash data for the
period after resurfacing.
The second potential confounding effect is the safety effect
of pavement resurfacing since it is always used in conjunction with the safety
edge treatment. Previous research has indicated that pavement resurfacing by itself may have an effect on safety, increasing
crashes because of increased speeds. This effect was found in one study
to be statistically significant but was found to persist for only 12-30 months after resurfacing.(4) However, a more recent, larger study in National Cooperative Highway Research
Program Project 17-9(2) found
inconsistent results; increases
in crash frequency with resurfacing were found in some States, but decreases in
crash frequency with resurfacing were found in others.(5) Therefore,
the safety effects of the pavement resurfacing
and installation of the safety edge
treatment will be confounded, at least for some time, following resurfacing.
The study design was developed to address the safety effect
of resurfacing and the safety edge treatment
as well as the confounding effect of resurfacing. First, the study period after
resurfacing was selected to be 3 years.
This is sufficiently long as to extend beyond the duration of any short-term resurfacing effect. Annual interim evaluations
to monitor time trends were conducted to address this issue. Thus, the results
for safety effectiveness of the safety edge treatment in the first- and second-year interim reports may be
confounded by the safety effect of pavement resurfacing, but it is expected that this confounding effect is lessened
in the final results. Second, resurfaced sites both with and without the
safety edge treatment were considered. The ratio of safety between resurfaced sites with and without the safety edge
treatment (i.e., the treatment and comparison sites) may represent an
effect of the safety edge treatment as long as the sites can be assumed
comparable in other respects.
The first evaluation
approach is an observational before-after comparison using the EB technique,
as formulated by Hauer.(6,7) The specific version of the EB
technique used in this evaluation was developed
for the FHWA SafetyAnalyst software tools.(8) The primary objective
of the before-after evaluation is to compare the observed number of crashes after the
treatment is implemented to the expectednumber
of crashes in the after period had the countermeasure not been implemented.
This provides an estimate of the overall safety effectiveness of the
countermeasure expressed as a percent change in the crash frequency.
When performing before-after evaluations using the EB technique,
it is typical to collect data at sites where countermeasures were implemented
(i.e., treatment sites) and at sites similar to the treatment sites with respect to area type (rural/urban), geometric
design, and traffic volumes, but where no countermeasures were installed.
Data from this comparison group of sites are used to create SPFs, which are
then used with the observed crash counts at the treated sites in the before
period to estimate the number of crashes that would have occurred at the
treated sites in the after period if no improvement had been made. These SPFs
are discussed in section 4.2.
The comparability before resurfacing of the two types of
sites (treatment and comparison sites) is critical
to interpreting the difference of the two estimated before-after effects as an
effect of the safety edge treatment. For example, if one of the site
types had a higher mean in the before period and both site types had the
same mean in the after period, then the effectiveness of one treatment may be presumed greater than the other
treatment. The comparability of sites was established through analysis of the
before-period crash data. These analyses are discussed in section 4.3.1.
The EB before-after evaluation
produced separate estimates of the effectiveness of resurfacing with the safety edge (treatment sites) and resurfacing
only (comparison sites) for each target crash type in each State. From each
pair of estimated percent changes in safety (treatment and comparison), the effect of the safety edge alone was estimated
as the ratio between the two measures of effectiveness. For every
combination of site characteristics under consideration, the mean and standard
error of the percent change in target crash frequency and its statistical
significance are presented in section 4.3.2.
It was anticipated that the effectiveness measure for the
safety edge treatment would be relatively small
since it was expected that the safety edge treatment would affect only certain
crash types and would have the greatest impact on two-lane highways with
no paved shoulders. Most such sites have relatively low traffic volume and
therefore are not expected to have a high frequency of run-off-the-road and drop-off-related
crashes.
The EB-based before-after
comparison technique is theoretically the strongest approach to
evaluations of this type. However, because of the confounding of the pavement
resurfacing effect and the safety edge
treatment effect, it cannot be assured that this approach correctly identifies
the treatment effectiveness. Therefore, an alternative cross-sectional
comparison was also conducted.
A cross-sectional
evaluation of the after data at the treated sites was conducted to directly
compare the crash data between the
two types of treatment-resurfacing with the safety edge treatment and resurfacing without the safety edge treatment.
Assuming that all roadway factors except resurfacing are held constant, one could hypothesize that the
differences in either after-period crash frequencies or crash severity distributions
between treatment and comparison sites are due to the provision of the safety
edge treatment. This comparison was made with a cross-sectional approach using
data for the period after resurfacing while accounting for the effects of AADT.
The cross-sectional
comparison of crash data for the period after resurfacing was conducted using
negative binomial regression models to
compare the crash frequencies for the period after resurfacing for the sites with the safety edge treatment to
those of the sites resurfaced without the safety edge treatment. Site type (i.e., treatment versus
comparison) was the main factor of interest in the analysis. The effect
of AADT was accounted for in this approach by quantifying the relationship
between AADT and specific target crash types.
When significant, the effect of lane width was also accounted for in the model. The safety edge treatment effect
and its standard error were then calculated for each target crash type. The treatment effect was
converted to a percent change in crash frequency for ease in interpreting the results. The results of the
cross-sectional analysis are presented in section 4.4.3.
In addition to evaluating mean crash frequencies, a
comparison of the before-after data by crash severity
level was performed to determine shifts in the crash severity distribution. These
comparisons were accomplished by calculating a confidence interval for
the average difference in proportions across
all sites at a preselected significance level of 10 percent. However, a
non-parametric statistical test, the Wilcoxon signed-rank test, was also
applied as the differences in proportions may not follow a normal distribution.
Results from this analysis are presented in section 4.4.4.(9)
4.2 Safety Performance Functions
This section documents the SPFs and calibration factors
developed for use in the before-after EB evaluation
of the safety effectiveness of the safety edge treatment. SPFs are regression
relationships between target crash frequencies and traffic volumes that can be
used to predict the long-term crash frequency for a site. SPFs are used
in the before-after EB evaluation to estimate what the safety performance of a treated site would be in the after
period if the treatment had not been implemented.
Negative binomial regression
models were developed using data from the reference group of untreated sites for
use in three categories of target crashes (all crash types combined, run-off-road
crashes, and drop-off-related crashes) and two severity levels (total crashes and
fatal and injury crashes). Thus, a total of six dependent variables were
considered. Traffic volume and lane width were the only independent variables
considered in the SPFs. Separate models were developed for Georgia and Indiana
for each of the three classifications, as follows:
- Rural multilane highways with paved shoulders
with widths of 4 ft or less.
-
Rural two-lane highways with paved shoulders
with widths of 4 ft or less.
-
Rural two-lane highways with no paved shoulders
(i.e., unpaved shoulders only).
Regression models were not developed for New York due to the
limited number of treated sites.
All regression models were developed to predict target crash
frequencies per mile per year as a function of traffic volume and, in some
cases, lane width in the functional forms shown in equation 1 and equation 2.
 (1) (1)
 (2) (2)
Where:
N = predicted number of target crashes
per mile per year
AADT = average daily traffic volume
(vehicles per day) for the roadway segment
LW = lane width for the roadway
segment (ft)
a, b, c = regression coefficients
The AADT in the regression models was statistically
significant in all cases. The lane width term was included in the regression
model only when it was statistically significant.
Two generalized linear
modeling techniques were used to fit the data. The first method used a repeated measures correlation structure to model
yearly crash counts for a site. In this method, the covariance structure, assuming compound symmetry,
is estimated before final regression parameter estimates are determined
by general estimating equations. Consequently, model convergence for this
method is dependent on the covariance estimates as well as parameter estimates.
When the model failed to converge for the covariance estimates, an alternative
method was considered. In this method,
yearly crash counts for a site were totaled and annual daily traffic (ADT) values
were averaged to create one summary
record for a site. Regression parameter estimates were then directly estimated
by maximum likelihood without an additional covariance structure being
estimated.
Both methods produced an estimate of the overdispersion
parameter, the estimate for which the variance exceeds the mean. Overdispersion
occurs in traffic data when a number of sites being modeled have zero accident
counts, which creates variation in the data. When the estimate for dispersion
was very small or even slightly negative, the model was refit assuming a
constant value. Both methods were accomplished with the GENMOD procedure of SAS®.(3)
Statistically significant models were not found for all
dependent variables for some road type/ shoulder type combinations. In these
three cases, the intercept coefficient of the total crashes or fatal and injury crashes model was adjusted by the
proportion of the applicable dependent variable to produce the final model. The model coefficients with their standard
errors are presented in table
10 for Georgia and in table
11 for Indiana. All AADT coefficients shown are significant
at the 10 percent significance level or better. Lane width coefficients
shown are significant at the 20 percent significance level or better. Total
crash and fatal and injury crash SPFs are illustrated in figure
3 for Georgia and in figure
4 for Indiana.
Table 10. SPFs for Georgia sites.
Roadway type |
Shoulder type |
Number of site-years |
Intercept (standard error) |
AADT coefficient (standard error) |
Lane width coefficient (standard
error) |
Overdispersion parameter |
R2LR (%) |
Total
crashes |
Multilane |
Paved |
192 |
-4.801 (1.608) |
0.642 (0.172) |
|
0.487 |
9.2 |
Two-lane |
Paved |
582 |
-8.921 (1.189) |
1.108 (0.141) |
|
0.724 |
36.4 |
Two-lane |
Unpaved |
792 |
-7.730 (0.783) |
0.978 (0.095) |
|
0.425 |
25.1 |
Fatal
and injury crashes |
Multilane |
Paved |
192 |
-2.204 (1.752) |
0.252 (0.184) |
|
0.588 |
0.2 |
Two-lane |
Paved |
582 |
-7.818 (1.116) |
0.853 (0.132) |
|
0.401 |
21.3 |
Two-lane |
Unpaved |
792 |
-8.556 (0.796) |
0.958 (0.098) |
|
0.346 |
16.0 |
PDO
crashes |
Multilane |
Paved |
192 |
-6.611 (1.747) |
0.787 (0.189) |
|
0.540 |
14.0 |
Two-lane |
Paved |
582 |
-11.414 (1.397) |
1.349 (0.164) |
|
0.982 |
34.6 |
Two-lane |
Unpaved |
792 |
-8.470 (0.981) |
1.011 (0.119) |
|
0.623 |
19.3 |
Total
run-off-road crashes |
Multilane |
Paved |
192 |
-3.475 (2.145) |
0.360 (0.228) |
|
0.213 |
1.9 |
Two-lane |
Paved |
582 |
-2.625 (1.710) |
0.783 (0.134) |
-0.376 (0.109) |
0.464 |
19.9 |
Two-lane |
Unpaved |
132 |
-4.405 (1.443) |
0.757 (0.141) |
-0.199 (0.106) |
0.472 |
14.8 |
Fatal
and injury run-off-road crashes |
Multilane |
Paved |
192 |
-3.425(1.752) |
0.252 (0.184) |
|
0.588 |
0.2 |
Two-lane |
Paved |
582 |
-1.848(1.618) |
0.544 (0.128) |
-0.339 (0.110) |
0.374 |
8.1 |
Two-lane |
Unpaved |
132 |
-5.556(1.543) |
0.743 (0.139) |
-0.151 (0.115) |
0.341 |
15.8 |
PDO
run-off-road crashes |
Multilane |
Paved |
192 |
-7.742(3.004) |
0.750 (0.320) |
|
0.117 |
5.6 |
Two-lane |
Paved |
582 |
-5.029(2.236) |
1.033 (0.154) |
-0.406 (0.144) |
0.598 |
19.2 |
Two-lane |
Unpaved |
132 |
-4.544(1.709) |
0.752 (0.173) |
-0.238 (0.126) |
0.636 |
9.7 |
Total
drop-off-related crashes |
Multilane |
Paved |
192 |
-3.583(2.126) |
0.318 (0.226) |
|
0.131 |
1.6 |
Two-lane |
Paved |
582 |
-4.586(2.069) |
0.884 (0.169) |
-0.327 (0.125) |
0.585 |
16.3 |
Two-lane |
Unpaved |
132 |
-4.140(1.495) |
0.770 (0.141) |
-0.270 (0.114) |
0.427 |
14.0 |
Fatal
and injury drop-off-related crashes |
Multilane |
Paved |
192 |
-2.344(1.974) |
0.113 (0.141) |
|
0.294 |
0.1 |
Two-lane |
Paved |
582 |
-3.297(1.894) |
0.604 (0.154) |
-0.290 (0.121) |
0.558 |
6.2 |
Two-lane |
Unpaved |
132 |
-4.869(1.654) |
0.699 (0.148) |
-0.209 (0.127) |
0.357 |
11.9 |
PDO
drop-off-related crashes |
Multilane |
Paved |
192 |
-6.690(3.194) |
0.574 (0.340) |
|
0.101 |
2.7 |
Two-lane |
Paved |
582 |
-8.291(3.272) |
1.269 (0.217) |
-0.359 (0.195) |
0.754 |
16.3 |
Two-lane |
Unpaved |
792 |
-4.345(3.899) |
0.872 (0.157) |
-0.388 (0.290) |
0.565 |
6.6 |
Note: Blank cells indicate lane width coefficient was not significant.
Table 11. SPFs for Indiana sites.
Road type |
Shoulder Type |
Number of site-years |
Intercept (standard error) |
AADT coefficient (standard error) |
Lane width coefficient (standard error) |
Overdispersion parameter |
R2LR (%) |
Total
crashes |
Two-lane |
Paved |
100 |
-5.500(1.317) |
0.737(0.154) |
|
0.444 |
15.3 |
Two-lane |
Unpaved |
98 |
-3.865(1.118) |
0.701(0.146) |
-0.156(0.086) |
0.654 |
15.5 |
Fatal
and injury crashes |
Two-lane |
Paved |
100 |
-6.279(1.977) |
0.642(0.233) |
|
0.563 |
5.1 |
Two-lane |
Unpaved |
196 |
-2.707(1.305) |
0.427(0.139) |
-0.198(0.098) |
0.211 |
7.2 |
PDO
crashes |
Two-lane |
Paved |
100 |
-5.572(1.373) |
0.718(0.161) |
|
0.398 |
14.8 |
Two-lane |
Unpaved |
98 |
-4.348(1.153) |
0.694(0.148) |
-0.128(0.089) |
0.661 |
15.9 |
Total
run-off-road crashes |
Two-lane |
Paved |
100 |
-3.250(1.962) |
0.303(0.231) |
|
0.413 |
1.5 |
Two-lane |
Unpaved |
196 |
-1.700(1.221) |
0.490(0.119) |
-0.278(0.103) |
0.438 |
10.9 |
Fatal
and injury run-off-road crashes |
Two-lane |
Paved |
296 |
-3.127(1.034) |
0.346(0.105) |
-0.132(0.078) |
0.154 |
2.5 |
Two-lane |
Unpaved |
196 |
-1.467(1.432) |
0.331(0.129) |
-0.284(0.102) |
0.027 |
6.4 |
PDO
run-off-road crashes |
Two-lane |
Paved |
100 |
-4.764(2.398) |
0.426(0.286) |
|
0.212 |
2.5 |
Two-lane |
Unpaved |
196 |
-2.752(1.260) |
0.573(0.133) |
-0.279(0.112) |
0.540 |
8.6 |
Total
drop-off-related crashes |
Two-lane |
Paved |
100 |
-4.477(3.598) |
0.313(0.421) |
|
0.738 |
0.6 |
Two-lane |
Unpaved |
98 |
-2.352(1.489) |
0.356(0.192) |
-0.232(0.111) |
0.310 |
1.5 |
Fatal
and injury drop-off-related crashes |
Two-lane |
Paved |
100 |
-7.772(1.977) |
0.642(0.233) |
|
0.563 |
5.1 |
Two-lane |
Unpaved |
98 |
-2.943(1.989) |
0.227(0.258) |
-0.167(0.147) |
0.276 |
0.3 |
PDO
drop-off-related crashes |
Two-lane |
Paved |
100 |
-7.464(5.554) |
0.597(0.653) |
|
0.623 |
1.4 |
Two-lane |
Unpaved |
98 |
-3.006(1.593) |
0.419(0.209) |
-0.266(0.122) |
0.069 |
1.7 |
Note: Blank cells indicate lane width
coefficient was not significant.
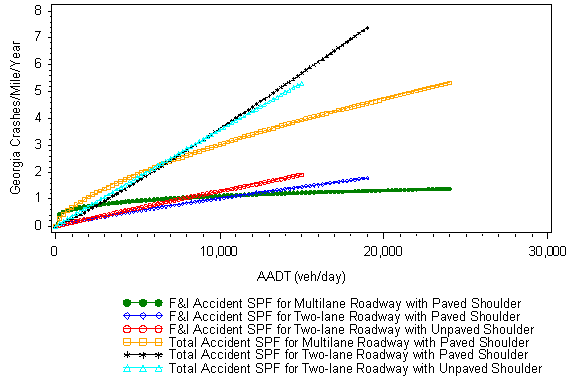
Figure 3. Graph. Comparison of Georgia SPFs by crash severity and roadway and shoulder type.
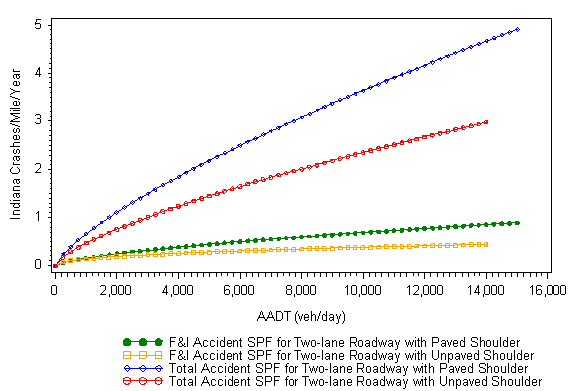
Figure 4. Graph. Comparison of Indiana SPFs by crash severity and roadway and
shoulder type.
As noted earlier, the proportion of run-off-road and
drop-off-related crashes (developed from reference sites) was sometimes needed
to adjust total or fatal and injury SPFs for prediction of those crash types. Table 12 presents these proportions estimated from the
reference site data.
Table 12. Run-off-road and drop-off-related crash frequencies as a proportion
of total crashes.
State |
Roadway type |
Shoulder type |
Crash severity Level |
Proportion of
run-off-road crashes |
Proportion of drop-off-related crashes |
GA |
Multilane |
Paved |
Total |
0.215 |
0.127 |
FI |
0.295 |
0.194 |
PDO |
0.162 |
0.084 |
Two-lane |
Paved |
Total |
0.371 |
0.230 |
FI |
0.511 |
0.368 |
PDO |
0.298 |
0.158 |
Unpaved |
Total |
0.473 |
0.300 |
FI |
0.574 |
0.410 |
PDO |
0.398 |
0.219 |
IN |
Two-lane |
Paved |
Total |
0.272 |
0.091 |
FI |
0.566 |
0.225 |
PDO |
0.199 |
0.058 |
Unpaved |
Total |
0.321 |
0.119 |
FI |
0.645 |
0.248 |
PDO |
0.253 |
0.091 |
FI = Fatal and injury crashes.
PDO
= Property-damage-only crashes.
Additionally, yearly calibration factors were developed from
the SPFs to provide a better yearly prediction in the methodology. These
factors are needed because the SPFs are developed as an average of all years. The yearly calibration factor is determined as the
ratio of the sum of observed crashes for
all sites for a specific roadway type/shoulder type combination to the sum of
the predicted crashes for the same sites using the AADT and crash count
values for that year. These factors are presented in table 13 for Georgia and in table
14 for Indiana.
Table 13. Georgia SPF calibration factors.
Roadway type |
Shoulder type |
Crash severity level |
Yearly calibration factors |
2001 |
2002 |
2003 |
2004 |
2005 |
2006 |
2007 |
2008 |
Total crashes |
Multilane |
Paved |
Total |
0.956 |
1.023 |
1.071 |
0.943 |
1.078 |
1.178 |
0.993 |
0.983 |
FI |
0.908 |
1.091 |
0.950 |
1.153 |
1.168 |
1.170 |
0.959 |
0.942 |
PDO |
0.998 |
1.005 |
1.155 |
0.849 |
1.049 |
1.203 |
1.031 |
1.021 |
Two-lane |
Paved |
Total |
0.856 |
0.949 |
0.919 |
1.044 |
0.990 |
1.045 |
1.025 |
1.023 |
FI |
0.926 |
0.979 |
0.996 |
1.114 |
1.139 |
1.167 |
1.115 |
1.075 |
PDO |
0.823 |
0.933 |
0.873 |
0.998 |
0.905 |
0.977 |
0.969 |
0.990 |
Unpaved |
Total |
0.996 |
0.876 |
0.884 |
1.061 |
1.068 |
1.112 |
0.895 |
1.024 |
FI |
1.056 |
0.999 |
0.840 |
1.106 |
1.318 |
1.202 |
1.031 |
1.167 |
PDO |
0.964 |
0.804 |
0.910 |
1.036 |
0.922 |
1.062 |
0.817 |
0.943 |
Run-off-road crashes |
Multilane |
Paved |
Total |
0.958 |
1.135 |
1.174 |
0.891 |
1.094 |
0.974 |
0.962 |
0.819 |
FI |
1.167 |
1.268 |
1.267 |
1.267 |
1.425 |
1.216 |
1.048 |
1.064 |
PDO |
0.928 |
1.168 |
1.241 |
0.731 |
0.987 |
0.917 |
0.999 |
0.747 |
Two-lane |
Paved |
Total |
1.192 |
1.389 |
1.131 |
1.397 |
1.307 |
1.542 |
1.458 |
1.378 |
FI |
1.302 |
1.188 |
1.226 |
1.502 |
1.481 |
1.688 |
1.474 |
1.416 |
PDO |
1.110 |
1.581 |
1.058 |
1.318 |
1.168 |
1.430 |
1.451 |
1.355 |
Unpaved |
Total |
1.107 |
1.064 |
1.089 |
1.201 |
1.335 |
1.280 |
1.046 |
1.183 |
FI |
1.150 |
1.167 |
0.828 |
1.241 |
1.405 |
1.232 |
1.114 |
1.265 |
PDO |
1.003 |
0.905 |
1.282 |
1.095 |
1.194 |
1.256 |
0.923 |
1.036 |
Drop-off-related crashes |
Multilane |
Paved |
Total |
1.040 |
1.102 |
1.134 |
1.101 |
1.034 |
1.003 |
1.156 |
0.774 |
FI |
0.925 |
1.320 |
0.989 |
1.121 |
0.989 |
1.254 |
1.117 |
0.860 |
PDO |
1.156 |
0.874 |
1.275 |
1.075 |
1.075 |
0.741 |
1.188 |
0.683 |
Two-lane |
Paved |
Total |
1.203 |
1.410 |
1.144 |
1.385 |
1.364 |
1.609 |
1.491 |
1.511 |
FI |
1.290 |
1.135 |
1.270 |
1.449 |
1.549 |
1.652 |
1.543 |
1.636 |
PDO |
1.111 |
1.746 |
1.001 |
1.312 |
1.154 |
1.564 |
1.429 |
1.368 |
Unpaved |
Total |
1.129 |
1.035 |
1.133 |
1.240 |
1.397 |
1.409 |
1.194 |
1.303 |
FI |
1.217 |
1.212 |
0.818 |
1.186 |
1.426 |
1.409 |
1.345 |
1.393 |
PDO |
0.997 |
0.794 |
1.506 |
1.285 |
1.335 |
1.384 |
0.982 |
1.165 |
FI = Fatal and injury crashes.
PDO
= Property-damage-only crashes.
Table 14. Indiana SPF calibration factors.
Roadway type |
Shoulder type |
Crash severity level |
Yearly calibration factors |
2003 |
2004 |
2005 |
2006 |
2007 |
2008 |
Total
crashes |
Two-lane |
Paved |
Total |
0.932 |
0.944 |
0.579 |
0.605 |
0.320 |
0.384 |
FI |
0.918 |
1.006 |
0.456 |
0.586 |
0.343 |
0.326 |
PDO |
0.943 |
0.936 |
0.616 |
0.615 |
0.317 |
0.402 |
Unpaved |
Total |
1.268 |
1.011 |
0.629 |
0.556 |
0.365 |
0.265 |
FI |
0.914 |
1.002 |
0.471 |
0.472 |
0.287 |
0.182 |
PDO |
1.322 |
0.968 |
0.650 |
0.557 |
0.373 |
0.279 |
Run-off-road crashes |
Two-lane |
Paved |
Total |
1.092 |
0.936 |
0.607 |
0.551 |
0.304 |
0.497 |
FI |
1.266 |
1.097 |
0.489 |
0.651 |
0.407 |
0.448 |
PDO |
1.074 |
0.911 |
0.713 |
0.535 |
0.268 |
0.558 |
Unpaved |
Total |
1.002 |
0.863 |
0.479 |
0.363 |
0.279 |
0.177 |
FI |
0.850 |
1.041 |
0.503 |
0.446 |
0.232 |
0.154 |
PDO |
1.068 |
0.754 |
0.457 |
0.313 |
0.300 |
0.186 |
Drop-off-related crashes |
Two-lane |
Paved |
Total |
0.994 |
0.946 |
0.646 |
0.431 |
0.431 |
0.690 |
FI |
0.729 |
0.722 |
0.362 |
0.434 |
0.290 |
0.290 |
PDO |
1.016 |
0.929 |
0.777 |
0.310 |
0.467 |
0.934 |
Unpaved |
Total |
1.289 |
1.038 |
0.544 |
0.545 |
0.520 |
0.249 |
FI |
1.265 |
0.989 |
0.661 |
0.441 |
0.385 |
0.220 |
PDO |
1.298 |
1.066 |
0.459 |
0.613 |
0.610 |
0.267 |
FI = Fatal and injury crashes.
PDO
= Property-damage-only crashes.
4.3 Safety Evaluations
As previously discussed,
four types of safety evaluations were performed as part of this study: (1) a
safety comparison of treatment and comparison sites in the period before
resurfacing;
(2) an EB before-after evaluation; (3) a cross-sectional analysis; and (4) an
analysis of shifts
in the severity distribution from before to after resurfacing. The findings of
these evaluations
are presented in this section.
4.3.1 Safety Comparison of Treatment and Comparison Sites in the Period Before Resurfacing
An evaluation was
conducted to compare the safety performance of treatment and comparison sites
before resurfacing for specific States and
roadway type/shoulder type combinations. This evaluation is critical to the interpretation of the safety
differences between the treatment and comparison sites as an effect of the safety edge treatment. If the safety
performance of the two types of sites differed in the period before
resurfacing, the comparison of treatment and comparison sites in the period
after resurfacing may be influenced.
Initial comparisons were made by examination of scatter plots of crashes
and traffic volumes (crashes per mile per year versus lnAADT). Ideal
plots would contain no discernable differences between treatment and comparison sites nor any extreme points. Separation
of the data points between the two
groups may indicate a potential concern in the subsequent analyses. Furthermore,
if one group had systematically higher crash
frequencies in the period before resurfacing, then the analysis for the
period after resurfacing might need to account for this difference. Finally,
large variation in crash frequencies for the same AADT values could inhibit
crash analysis of the treatment and
comparison groups. Inspection of these plots with data from year 3 (see appendix C)
showed an improvement in the plots from year 1 and year 2.
Yearly total crash and target
crash distributions were also presented in box plots to review data consistency
from year to year. Ideal plots would have approximately the same distribution
for crashes each year within a given site
type and between site types. Additionally, potential concerns for the
crash analysis-specifically, a regression to the mean or resurfacing effect-
may be identified if the period after resurfacing is included.
Since crash frequencies are
known to experience random variation around the mean or regression to the mean,
the average over several years for the period before resurfacing should be compared
to the average of several years for the period after resurfacing. Therefore, if
the after period data are within the range of yearly crash means but
numerically higher than the before period average, then safety analyses might
show an increase in crash frequency due to the treatment (provided AADT growth
was minimal). Conversely, if the after implementation year data are lower than the before period average, then the treatment
effect would be a decrease in crash frequency. Examination of these
graphs indicated that the after period data were almost always higher than the
average of the before years but within the range of variation in yearly crash
totals for both types of treated sites.
The apparent increase in crashes was examined to determine if it could
be attributed to resurfacing. A
resurfacing effect occurs when the reference sites remain the same or decrease
in crashes while the treatment and comparison sites both increase. This effect
was observed in nearly all of the plots.
One additional potential problem
was found in this analysis. One treatment site on a two-lane highway with paved
shoulders in Georgia site doubled in crash frequency from the before to the after period. Subsequent investigation found that
this site was reconstructed during the second year after resurfacing, and
therefore, it was excluded from the safety analysis presented in this report.
Formal crash frequency comparisons of means between the treatment and
comparison sites for the period
before resurfacing were conducted for each State/roadway type/shoulder type combination
and target crash type. Two types of
comparisons were made, a comparison of EB-adjusted expected crash frequencies and a comparison
of observed crash frequencies. Both comparisons were performed using PROC GENMOD, a generalized linear model procedure
available in SAS®, assuming a negative binomial crash
distribution.(3) This procedure uses predictive modeling to test the
means between the two treatment groups for statistical significance.
The results of these analyses are presented in table 15 and table
16. For the EB-adjusted crash analysis, results
are provided only for those roadway type/shoulder type combinations for which SPFs could be developed. However, all target crash
types were considered as they can be estimated by the EB technique.
Regression coefficients with their standard errors are shown in the tables for
each independent variable, including AADT and the treatment versus comparison
site effect. The significance and p-value for each effect are also
presented. Blank rows in the tables represent models that did not
converge.
Table 15. Evaluation of treatment versus comparison site effect for the period before resurfacing using EB-adjusted
crash frequencies.
State |
Roadway type |
Shoulder type |
Crash type and severity level |
Number of site-years |
Intercept |
AADT effect |
Lane width effect |
Treatment versus comparison site effect |
Dispersion parameter |
R2LR% |
Coefficient |
Standard error |
p-value |
Statistically significant?1 |
Coefficient |
Standard error |
p-value |
Statistically significant?1 |
Coefficient |
Standard error |
p-value |
Statistically significant?1 |
GA |
Multilane |
Paved |
TOT |
102 |
-3.965 |
0.572 |
0.143 |
0.001 |
Yes |
|
|
|
|
-0.497 |
0.452 |
0.272 |
No |
0.237 |
31.4 |
FI |
102 |
-2.115 |
0.239 |
0.165 |
0.148 |
No |
|
|
|
|
-0.391 |
0.394 |
0.322 |
No |
0.031 |
9.4 |
PDO |
102 |
-5.926 |
0.740 |
0.172 |
0.001 |
Yes |
|
|
|
|
-0.531 |
0.525 |
0.312 |
No |
0.282 |
35.3 |
rorTOT |
102 |
-5.253 |
0.559 |
0.179 |
0.002 |
Yes |
|
|
|
|
-0.149 |
0.191 |
0.434 |
No |
0.010 |
5.9 |
rorFI |
102 |
-3.843 |
0.328 |
0.158 |
0.038 |
Yes |
|
|
|
|
-0.293 |
0.169 |
0.083 |
Yes |
0.010 |
22.2 |
rorPDO |
102 |
-7.761 |
0.757 |
0.189 |
0.001 |
Yes |
|
|
|
|
-0.043 |
0.239 |
0.856 |
No |
0.010 |
8.1 |
doTOT |
102 |
-4.265 |
0.430 |
0.127 |
0.001 |
Yes |
|
|
|
|
-0.095 |
0.132 |
0.469 |
No |
0.010 |
21.2 |
doFI |
102 |
-3.620 |
0.285 |
0.104 |
0.006 |
Yes |
|
|
|
|
-0.134 |
0.106 |
0.204 |
No |
0.010 |
24.1 |
doPDO |
102 |
-6.240 |
0.569 |
0.172 |
0.001 |
Yes |
|
|
|
|
-0.060 |
0.177 |
0.734 |
No |
0.010 |
19.1 |
Two-lane |
Paved |
TOT |
264 |
-12.086 |
1.475 |
0.089 |
0.000 |
Yes |
|
|
|
|
0.154 |
0.177 |
0.384 |
No |
0.010 |
56.9 |
FI |
264 |
-11.367 |
1.306 |
0.099 |
0.000 |
Yes |
|
|
|
|
-0.104 |
0.129 |
0.420 |
No |
0.010 |
33.5 |
PDO |
264 |
-13.244 |
1.534 |
0.095 |
0.000 |
Yes |
|
|
|
|
0.302 |
0.222 |
0.175 |
No |
0.010 |
48.0 |
rorTOT |
264 |
-5.358 |
1.133 |
0.107 |
0.000 |
Yes |
-0.361 |
0.093 |
0.001 |
Yes |
-0.259 |
0.141 |
0.067 |
Yes |
0.010 |
25.3 |
rorFI |
264 |
-4.377 |
0.973 |
0.132 |
0.001 |
Yes |
-0.381 |
0.070 |
0.001 |
Yes |
-0.338 |
0.126 |
0.007 |
Yes |
0.010 |
5.2 |
rorPDO |
264 |
-7.053 |
1.173 |
0.100 |
0.000 |
Yes |
-0.314 |
0.128 |
0.014 |
Yes |
-0.190 |
0.167 |
0.255 |
No |
0.010 |
15.9 |
doTOT |
264 |
-7.238 |
1.221 |
0.116 |
0.000 |
Yes |
-0.303 |
0.067 |
0.001 |
Yes |
-0.312 |
0.120 |
0.009 |
Yes |
0.010 |
19.0 |
doFI |
264 |
-6.870 |
1.207 |
0.124 |
0.000 |
Yes |
-0.366 |
0.102 |
0.000 |
Yes |
-0.369 |
0.158 |
0.020 |
Yes |
0.010 |
1.7 |
doPDO |
264 |
-10.155 |
1.290 |
0.105 |
0.000 |
Yes |
-0.189 |
0.107 |
0.078 |
Yes |
-0.169 |
0.123 |
0.171 |
No |
0.010 |
12.1 |
Unpaved |
TOT |
318 |
-8.117 |
1.001 |
0.098 |
0.000 |
Yes |
|
|
|
|
0.611 |
0.149 |
0.001 |
Yes |
0.010 |
61.2 |
FI |
318 |
-8.026 |
0.899 |
0.102 |
0.000 |
Yes |
|
|
|
|
0.237 |
0.137 |
0.084 |
Yes |
0.010 |
39.1 |
PDO |
318 |
-9.051 |
1.031 |
0.079 |
0.000 |
Yes |
|
|
|
|
0.902 |
0.180 |
0.001 |
Yes |
0.010 |
57.8 |
rorTOT |
318 |
-7.230 |
0.819 |
0.088 |
0.000 |
Yes |
|
|
|
|
0.358 |
0.159 |
0.024 |
Yes |
0.010 |
37.3 |
rorFI |
318 |
-6.816 |
0.703 |
0.077 |
0.000 |
Yes |
|
|
|
|
0.179 |
0.133 |
0.179 |
No |
0.010 |
20.6 |
rorPDO |
318 |
-8.895 |
0.909 |
0.071 |
0.000 |
Yes |
|
|
|
|
0.574 |
0.208 |
0.006 |
Yes |
0.010 |
30.0 |
doTOT |
318 |
-7.444 |
0.801 |
0.084 |
0.000 |
Yes |
|
|
|
|
0.271 |
0.142 |
0.056 |
Yes |
0.010 |
29.7 |
doFI |
318 |
-6.545 |
0.636 |
0.085 |
0.001 |
Yes |
|
|
|
|
0.180 |
0.127 |
0.157 |
No |
0.010 |
12.8 |
doPDO |
318 |
-10.351 |
1.026 |
0.107 |
0.000 |
Yes |
|
|
|
|
0.414 |
0.196 |
0.035 |
Yes |
0.010 |
21.4 |
See notes at end of table.
Table 15. Evaluation of treatment versus comparison site effect for the period before
resurfacing using EB-adjusted crash frequencies-Continued.
State |
Roadway type |
Shoulder type |
Crash type and severity level |
Number of site-years |
Intercept |
AADT effect |
Lane width effect |
Treatment versus comparison site effect |
Dispersion parameter |
R2LR% |
Coefficient |
Standard error |
p-value |
Statistically significant?1 |
Coefficient |
Standard error |
p-value |
Statistically significant?1 |
Coefficient |
Standard error |
p-valuev |
Statistically significant?1 |
IN |
Two-lane |
Paved |
TOT |
42 |
-10.904 |
1.409 |
0.056 |
0.000 |
Yes |
|
|
|
|
-0.517 |
0.307 |
0.092 |
Yes |
0.150 |
7.3 |
FI |
42 |
-21.302 |
2.546 |
0.222 |
0.000 |
Yes |
|
|
|
|
-1.076 |
0.338 |
0.001 |
Yes |
0.010 |
9.3 |
PDO |
42 |
-2.772 |
0.422 |
0.114 |
0.000 |
Yes |
|
|
|
|
-0.184 |
0.405 |
0.650 |
No |
0.152 |
4.7 |
rorTOT |
42 |
-2.431 |
0.208 |
0.283 |
0.463 |
No |
|
|
|
|
-0.054 |
0.208 |
0.793 |
No |
0.010 |
23.8 |
rorFI |
42 |
-4.735 |
0.361 |
0.061 |
0.001 |
Yes |
|
|
|
|
-0.073 |
0.078 |
0.352 |
No |
0.010 |
34.0 |
rorPDO |
42 |
|
|
|
|
|
|
|
|
|
|
|
|
|
|
|
doTOT |
42 |
|
|
|
|
|
|
|
|
|
|
|
|
|
|
|
doFI |
42 |
-5.918 |
0.391 |
0.059 |
0.001 |
Yes |
|
|
|
|
-0.269 |
0.159 |
0.090 |
Yes |
0.010 |
35.2 |
doPDO |
42 |
|
|
|
|
|
|
|
|
|
|
|
|
|
|
|
Unpaved |
TOT |
68 |
-0.578 |
0.787 |
0.231 |
0.001 |
Yes |
-0.506 |
0.117 |
0.001 |
Yes |
0.097 |
0.273 |
0.723 |
No |
0.137 |
43.8 |
FI |
68 |
-1.688 |
0.470 |
0.141 |
0.001 |
Yes |
-0.312 |
0.061 |
0.001 |
Yes |
-0.063 |
0.165 |
0.701 |
No |
0.010 |
15.9 |
PDO |
68 |
-1.128 |
0.932 |
0.264 |
0.000 |
Yes |
-0.584 |
0.141 |
0.001 |
Yes |
0.172 |
0.302 |
0.570 |
No |
0.212 |
40.4 |
rorTOT |
68 |
0.889 |
0.588 |
0.208 |
0.005 |
Yes |
-0.585 |
0.103 |
0.001 |
Yes |
-0.045 |
0.219 |
0.837 |
No |
0.010 |
34.6 |
rorFI |
68 |
-1.126 |
0.283 |
0.035 |
0.001 |
Yes |
-0.278 |
0.010 |
0.000 |
Yes |
-0.039 |
0.040 |
0.328 |
No |
0.010 |
17.1 |
rorPDO |
68 |
0.902 |
0.879 |
0.321 |
0.006 |
Yes |
-0.838 |
0.174 |
0.001 |
Yes |
-0.015 |
0.323 |
0.964 |
No |
0.010 |
35.7 |
doTOT |
68 |
-0.837 |
0.211 |
0.106 |
0.047 |
Yes |
-0.242 |
0.069 |
0.000 |
Yes |
-0.433 |
0.169 |
0.011 |
Yes |
0.010 |
5.1 |
doFI |
68 |
-1.842 |
0.139 |
0.056 |
0.013 |
Yes |
-0.190 |
0.036 |
0.001 |
Yes |
-0.246 |
0.092 |
0.008 |
Yes |
0.010 |
21.4 |
doPDO |
68 |
-1.212 |
0.259 |
0.161 |
0.108 |
Yes |
-0.285 |
0.107 |
0.008 |
Yes |
-0.565 |
0.258 |
0.028 |
Yes |
0.010 |
3.5 |
1 At the 0.20 level.
TOT
= total crashes (all severity levels combined).
Fl
= fatal and injury crashes.
PDO
= property-damage-only crashes.
ror
= run-off-road crashes.
do
= drop-off-related crashes.
Note:
Blank cells represent models that did not converge.
Table 16. Evaluation of treatment versus comparison site effect for the period before resurfacing using observed crash frequencies.
State |
Roadway type |
Shoulder type |
Crash type and severity level |
Number of site-years |
Intercept |
AADT effect |
Lane width effect |
Treatment versus comparison site effect |
Dispersion parameter |
R2LR% |
Coefficient |
Standard error |
p-value |
Statistically significant?1 |
Coefficient |
Standard error |
p-value |
Statistically significant?1 |
Coefficient |
Standard error |
p-value |
Statistically significant?1 |
GA |
Multilane |
Paved |
TOT |
102 |
-9.014 |
1.128 |
0.282 |
0.000 |
Yes |
|
|
|
|
-0.878 |
0.505 |
0.082 |
Yes |
0.378 |
27.7 |
FI |
102 |
-7.293 |
0.812 |
0.288 |
0.005 |
Yes |
|
|
|
|
-0.826 |
0.516 |
0.109 |
No |
0.338 |
10.1 |
PDO |
102 |
-10.881 |
1.286 |
0.321 |
0.000 |
Yes |
|
|
|
|
-0.885 |
0.527 |
0.093 |
Yes |
0.505 |
27.3 |
rorTOT |
102 |
-7.749 |
0.822 |
0.268 |
0.002 |
Yes |
|
|
|
|
-0.295 |
0.225 |
0.188 |
No |
0.015 |
15.0 |
rorFI |
102 |
-7.005 |
2.654 |
0.660 |
0.288 |
Yes |
|
|
|
|
-0.547 |
0.259 |
0.035 |
Yes |
0.010 |
5.6 |
rorPDO |
102 |
-9.207 |
3.372 |
0.911 |
0.353 |
Yes |
|
|
|
|
-0.119 |
0.282 |
0.672 |
No |
0.010 |
16.2 |
doTOT |
102 |
-8.374 |
2.175 |
0.844 |
0.229 |
Yes |
|
|
|
|
-0.355 |
0.180 |
0.048 |
Yes |
0.010 |
11.9 |
doFI |
102 |
-8.785 |
2.656 |
0.809 |
0.287 |
Yes |
|
|
|
|
-0.442 |
0.221 |
0.046 |
Yes |
0.010 |
5.0 |
doPDO |
102 |
-9.387 |
3.466 |
0.884 |
0.364 |
Yes |
|
|
|
|
-0.304 |
0.272 |
0.264 |
No |
0.010 |
7.6 |
Two-lane |
Paved |
TOT |
264 |
-8.045 |
0.982 |
0.130 |
0.000 |
Yes |
|
|
|
|
0.222 |
0.176 |
0.207 |
No |
0.247 |
35.7 |
FI |
264 |
-7.646 |
0.852 |
0.143 |
0.000 |
Yes |
|
|
|
|
-0.121 |
0.152 |
0.426 |
No |
0.018 |
21.3 |
PDO |
264 |
-10.106 |
1.147 |
0.139 |
0.000 |
Yes |
|
|
|
|
0.447 |
0.200 |
0.025 |
Yes |
0.436 |
30.8 |
rorTOT |
264 |
-3.346 |
0.666 |
0.121 |
0.000 |
Yes |
-0.220 |
0.161 |
0.172 |
Yes |
-0.231 |
0.206 |
0.261 |
No |
0.166 |
13.9 |
rorFI |
264 |
-1.188 |
0.465 |
0.156 |
0.003 |
Yes |
-0.303 |
0.161 |
0.059 |
Yes |
-0.593 |
0.229 |
0.010 |
Yes |
0.073 |
7.2 |
rorPDO |
264 |
-8.299 |
0.834 |
0.118 |
0.000 |
Yes |
|
|
|
|
0.110 |
0.203 |
0.587 |
No |
0.360 |
10.8 |
doTOT |
264 |
-6.541 |
0.673 |
0.173 |
0.000 |
Yes |
|
|
|
|
-0.297 |
0.173 |
0.086 |
Yes |
0.177 |
10.3 |
doFI |
264 |
-1.063 |
0.414 |
0.202 |
0.040 |
Yes |
-0.300 |
0.170 |
0.077 |
Yes |
-0.752 |
0.249 |
0.003 |
Yes |
0.173 |
5.7 |
doPDO |
264 |
-10.600 |
1.038 |
0.204 |
0.000 |
Yes |
|
|
|
|
-0.016 |
0.223 |
0.942 |
No |
0.156 |
9.9 |
Unpaved |
TOT |
318 |
-8.615 |
1.059 |
0.104 |
0.000 |
Yes |
|
|
|
|
0.610 |
0.174 |
0.000 |
Yes |
0.389 |
35.9 |
FI |
318 |
-8.473 |
0.940 |
0.097 |
0.000 |
Yes |
|
|
|
|
0.258 |
0.177 |
0.143 |
No |
0.318 |
21.3 |
PDO |
318 |
-9.950 |
1.148 |
0.119 |
0.000 |
Yes |
|
|
|
|
0.864 |
0.197 |
0.000 |
Yes |
0.419 |
34.3 |
rorTOT |
318 |
-7.022 |
0.774 |
0.106 |
0.000 |
Yes |
|
|
|
|
0.441 |
0.194 |
0.023 |
Yes |
0.309 |
19.4 |
rorFI |
318 |
-7.358 |
0.740 |
0.109 |
0.000 |
Yes |
|
|
|
|
0.226 |
0.220 |
0.304 |
No |
0.487 |
9.7 |
rorPDO |
318 |
-8.611 |
0.874 |
0.150 |
0.000 |
Yes |
|
|
|
|
0.653 |
0.228 |
0.004 |
Yes |
0.385 |
16.8 |
doTOT |
318 |
-7.106 |
0.736 |
0.132 |
0.000 |
Yes |
|
|
|
|
0.397 |
0.212 |
0.061 |
Yes |
0.247 |
15.6 |
doFI |
318 |
-6.937 |
0.645 |
0.139 |
0.000 |
Yes |
|
|
|
|
0.270 |
0.245 |
0.272 |
No |
0.548 |
6.9 |
doPDO |
318 |
-9.469 |
0.922 |
0.188 |
0.000 |
Yes |
|
|
|
|
0.554 |
0.252 |
0.028 |
Yes |
0.361 |
12.5 |
See notes at end of table.
Table 16. Evaluation of treatment versus comparison site effect for the period before resurfacing using observed crash frequencies-Continued.
State |
Roadway type |
Shoulder type |
Crash type and severity level |
Number of site-years |
Intercept |
AADT effect |
Lane width effect |
Treatment versus comparison site effect |
Dispersion parameter |
R2LR% |
Coefficient |
Standard error |
p-value |
Statistically significant?1 |
Coefficient |
Standard error |
p-value |
Statistically significant?1 |
Coefficient |
Standard error |
p-value |
Statistically significant?1 |
IN |
Two-lane |
Paved |
TOT |
42 |
-3.824 |
0.588 |
0.250 |
0.019 |
Yes |
|
|
|
|
-0.380 |
0.364 |
0.296 |
No |
0.416 |
6.6 |
FI |
42 |
-7.523 |
0.850 |
0.606 |
0.161 |
No |
|
|
|
|
-0.842 |
0.533 |
0.114 |
No |
0.629 |
7.9 |
PDO |
42 |
-3.076 |
0.465 |
0.235 |
0.048 |
Yes |
|
|
|
|
-0.205 |
0.356 |
0.565 |
No |
0.369 |
4.1 |
rorTOT |
42 |
-6.756 |
0.736 |
0.546 |
0.178 |
No |
|
|
|
|
-0.468 |
0.396 |
0.237 |
No |
0.446 |
5.1 |
rorFI |
42 |
-2.953 |
4.414 |
0.188 |
0.515 |
No |
|
|
|
|
-0.830 |
0.457 |
0.069 |
Yes |
0.010 |
6.0 |
rorPDO |
42 |
-8.070 |
0.815 |
0.589 |
0.167 |
No |
|
|
|
|
-0.092 |
0.432 |
0.831 |
No |
0.461 |
5.0 |
doTOT |
42 |
-13.860 |
1.420 |
1.212 |
0.241 |
No |
|
|
|
|
-0.996 |
0.503 |
0.048 |
Yes |
0.478 |
6.0 |
doFI |
42 |
|
|
|
|
|
|
|
|
|
|
|
|
|
|
0.0 |
doPDO |
42 |
-23.901 |
2.478 |
0.959 |
0.010 |
Yes |
|
|
|
|
-0.477 |
0.529 |
0.368 |
No |
0.010 |
11.9 |
Unpaved |
TOT |
68 |
-0.761 |
0.918 |
0.248 |
0.000 |
Yes |
-0.587 |
0.140 |
0.000 |
Yes |
0.188 |
0.297 |
0.525 |
No |
0.435 |
35.8 |
FI |
68 |
-0.041 |
0.732 |
0.347 |
0.035 |
Yes |
-0.640 |
0.225 |
0.005 |
Yes |
-0.050 |
0.347 |
0.884 |
No |
0.093 |
23.4 |
PDO |
68 |
-1.612 |
0.998 |
0.270 |
0.000 |
Yes |
-0.594 |
0.155 |
0.000 |
Yes |
0.269 |
0.304 |
0.377 |
No |
0.527 |
31.5 |
rorTOT |
68 |
1.418 |
0.806 |
0.316 |
0.011 |
Yes |
-0.783 |
0.200 |
0.000 |
Yes |
-0.068 |
0.331 |
0.838 |
No |
0.221 |
34.7 |
rorFI |
68 |
1.478 |
3.119 |
0.435 |
0.358 |
No |
-0.608 |
0.212 |
0.004 |
Yes |
-0.268 |
0.340 |
0.431 |
No |
0.010 |
18.7 |
rorPDO |
68 |
0.475 |
1.120 |
0.398 |
0.005 |
Yes |
-0.974 |
0.313 |
0.002 |
Yes |
0.091 |
0.365 |
0.804 |
No |
0.377 |
29.2 |
doTOT |
68 |
1.029 |
0.101 |
0.386 |
0.794 |
No |
-0.312 |
0.246 |
0.204 |
No |
-1.107 |
0.596 |
0.063 |
Yes |
0.010 |
21.7 |
doFI |
68 |
|
|
|
|
|
|
|
|
|
|
|
|
|
|
0.0 |
doPDO |
68 |
-4.194 |
0.270 |
0.560 |
0.630 |
No |
|
|
|
|
-1.090 |
0.699 |
0.119 |
No |
0.584 |
6.4 |
NY |
Two-lane |
Paved |
TOT |
36 |
-5.328 |
0.674 |
0.085 |
0.000 |
Yes |
|
|
|
|
0.127 |
0.182 |
0.484 |
No |
0.486 |
24.9 |
FI |
36 |
-6.943 |
0.766 |
0.113 |
0.000 |
Yes |
|
|
|
|
0.308 |
0.172 |
0.074 |
Yes |
0.674 |
19.3 |
PDO |
36 |
-5.467 |
0.625 |
0.083 |
0.000 |
Yes |
|
|
|
|
-0.030 |
0.204 |
0.884 |
No |
0.813 |
15.7 |
rorTOT |
36 |
-4.846 |
0.480 |
0.085 |
0.000 |
Yes |
|
|
|
|
0.577 |
0.140 |
0.000 |
Yes |
0.243 |
19.6 |
rorFI |
36 |
-5.333 |
0.486 |
0.122 |
0.000 |
Yes |
|
|
|
|
0.643 |
0.175 |
0.000 |
Yes |
0.410 |
14.4 |
rorPDO |
36 |
-5.784 |
0.372 |
0.467 |
0.048 |
Yes |
|
|
|
|
0.475 |
0.105 |
0.000 |
Yes |
0.010 |
13.0 |
doTOT |
36 |
|
|
|
|
|
|
|
|
|
|
|
|
|
|
|
doFI |
36 |
|
|
|
|
|
|
|
|
|
|
|
|
|
|
|
doPDO |
36 |
|
|
|
|
|
|
|
|
|
|
|
|
|
|
|
1 At the 0.20
significance level.
TOT
= total crashes (all severity levels combined).
Fl
= fatal and injury crashes.
PDO
= property-damage-only crashes.
ror
= run-off-road crashes.
do
= drop-off-related crashes.
Note:
Blank cells indicate models that did not converge.
Results from the analysis
of EB-adjusted crash frequencies in table
15 show that there tended to be significant
differences between treatment and comparison site crash frequencies for Georgia
sites with unpaved shoulders in the period
before resurfacing. Comparison sites that had unpaved shoulders had lower crash
rates than treatment sites. There is also evidence of differences in drop-off-related and run-off-road crashes for
Georgia paved shoulder locations. Similarly, Indiana unpaved shoulder
locations differed for drop-off-related crashes. These locations had treatment
sites with lower crash rates.
Results from the analysis
of observed crash frequencies somewhat confirmed the results of the EB-adjusted
crashes. However, there tended to be fewer significant results and poorer fit
of the models in general. This was to
be expected because EB-adjusted crashes are smoothed by the SPF model
predictions, causing smaller differences and less variation and leading to more
significant results. Differences between treatment and
comparison sites were confirmed for Georgia unpaved shoulder locations and drop-off-related crashes
for paved shoulder locations. Additionally, New York locations, which were not
tested by EB-adjusted crashes, showed differences for run-off-road crashes. All
other significant differences were associated with poor models.
It was also desirable to
confirm the existence of a cause-and-effect chain leading from the frequency
and height of pavement-edge drop-offs to the likelihood of crashes. The
drop-off height analysis reported in chapter
3 indicated that two-lane highway sites with unpaved shoulders and the multilane highway sites in Georgia did not
have significant differences in the proportion of high drop-offs and therefore
should have non-significant differences in crash frequency in the period before resurfacing. This expectation was not
entirely supported by crash analysis results. However, for cases in
which there were significant differences, these differences were in the same
direction indicated in the drop-off analysis. That is, if drop-offs were more
prevalent, then the sites had more crashes.
Similarly, two-lane highway sites with paved shoulders in Georgia had
comparison sites with a significantly higher probability of high
drop-offs, and the crash analysis showed the comparison sites had more crashes,
although the result was not significant.
Results for Indiana sites on two-lane highways with paved
shoulders were consistent with the analysis of drop-off measurements, but the
results for Indiana sites on two-lane highways with unpaved shoulders were not
consistent with the analysis of drop-off measurements.
Overall, the treatment and
comparison sites showed similar crash frequencies for paved shoulder sites in the period before resurfacing. By
contrast, there were some statistically significant differences in crash frequencies between treatment
and comparison sites for unpaved shoulders during the period before resurfacing. It should be noted that only 2
years of crash data were available for the period before resurfacing in
Indiana, in comparison to 6 years for the period before resurfacing in Georgia. Thus, the variability of the Indiana
crash frequencies was expected to be higher. In most cases (with the
single exception previously noted), the differences in crash frequencies between treatment and comparison sites
were similar to the differences in proportions of extreme drop-off
heights for the period before resurfacing.
4.3.2 Before-After Evaluation Using the EB Technique
An
observational before-after evaluation
was conducted using the EB technique to estimate the safety effectiveness of
the safety edge treatment. Separate before-after evaluations were conducted
for resurfacing projects with the safety edge (treatment sites) and resurfacing
projects without the safety edge (comparison sites). The ratio of these results
was used to estimate the effect of the safety edge treatment.
All crash severity levels for total crashes, run-off-road
crashes, and drop-off-related crashes were evaluated. The study period before
resurfacing for these evaluations was the 4-year period from 2001 to 2004. The
study period after resurfacing was the 3-year period from 2006 to 2008. The
entire year in which resurfacing was performed, 2005, was excluded from the
evaluation. The rationale for excluding
crashes during the construction year is that it takes time for drivers to
adjust to new driving conditions, and
so the transition period is not necessarily representative of the long-term
safety performance of the site. All of the crash data used in the evaluation
were for complete calendar years so that there would be no opportunity
for seasonal biases to affect the results.
The EB procedure was programmed and executed in SAS®.(3) Effectiveness estimates and their precision estimates, along with their
statistical significance, are presented for specific crash types in table
17 through table
25.
Table 17. Before-after EB evaluation results for total crashes.
State |
Roadway type |
Shoulder type |
Site type |
Number of
sites |
Odds ratio |
Change in crash frequency from before to
after resurfacing |
Statistically significant? |
Safety edge effect |
Percent change |
Direction |
Standard error (%) |
5% level |
10% level |
Effect (%) |
Direction |
Standard error (%) |
5% level |
10% level |
GA |
Two-lane |
Paved |
T |
25 |
1.804 |
13.123 |
Increase |
7.276 |
No |
Yes |
7.732 |
Decrease |
9.596 |
No |
No |
C |
19 |
2.262 |
22.602 |
Increase |
9.993 |
Yes |
Yes |
Unpaved |
T |
22 |
2.246 |
-13.562 |
Decrease |
6.038 |
Yes |
Yes |
11.361 |
Decrease |
8.467 |
No |
No |
C |
31 |
0.389 |
-2.483 |
Decrease |
6.376 |
No |
No |
Combined |
T |
47 |
0.143 |
-0.670 |
Decrease |
4.697 |
No |
No |
6.817 |
Decrease |
6.459 |
No |
No |
C |
50 |
1.217 |
6.597 |
Increase |
5.421 |
No |
No |
IN |
Two-lane |
Paved |
T |
14 |
0.047 |
0.567 |
Increase |
12.167 |
No |
No |
15.524 |
Decrease |
14.422 |
No |
No |
C |
7 |
1.333 |
19.048 |
Increase |
14.293 |
No |
No |
Unpaved |
T |
16 |
1.524 |
29.925 |
Increase |
19.639 |
No |
No |
-26.942 |
Increase |
24.027 |
No |
No |
C |
18 |
0.201 |
2.350 |
Increase |
11.691 |
No |
No |
Combined |
T |
30 |
1.000 |
10.456 |
Increase |
10.454 |
No |
No |
-0.235 |
Increase |
12.622 |
No |
No |
C |
25 |
1.120 |
10.197 |
Increase |
9.104 |
No |
No |
GA
& IN |
Two-lane |
Paved |
T |
39 |
1.601 |
10.027 |
Increase |
6.262 |
No |
No |
9.485 |
Decrease |
8.009 |
No |
No |
C |
26 |
2.628 |
21.556 |
Increase |
8.203 |
Yes |
Yes |
Unpaved |
T |
38 |
1.311 |
-7.657 |
Decrease |
5.842 |
No |
No |
6.516 |
Decrease |
7.910 |
No |
No |
C |
49 |
0.218 |
-1.221 |
Decrease |
5.604 |
No |
No |
Combined |
T |
77 |
0.360 |
1.546 |
Increase |
4.293 |
No |
No |
5.674 |
Decrease |
5.737 |
No |
No |
C |
75 |
1.642 |
7.654 |
Increase |
4.662 |
No |
No |
T = Treatment sites resurfaced with safety edge.
C = Comparison sites resurfaced
without safety edge.
Table 18. Before-after EB evaluation results for fatal and injury crashes.
State |
Roadway type |
Shoulder type |
Site type |
Number of
sites |
Odds ratio |
Change in crash frequency from before to
after resurfacing |
Statistically significant? |
Safety edge effect |
Percent change |
Direction |
Standard
error (%) |
5%
level |
10% level |
Effect (%) |
Direction |
Standard error (%) |
5% level |
10% level |
GA |
Two-lane |
Paved |
T |
25 |
1.592 |
19.899 |
Increase |
12.499 |
No |
No |
10.959 |
Decrease |
13.779 |
No |
No |
C |
19 |
2.244 |
34.656 |
Increase |
15.446 |
Yes |
Yes |
Unpaved |
T |
22 |
0.232 |
2.761 |
Increase |
11.887 |
No |
No |
-15.555 |
Increase |
17.687 |
No |
No |
C |
31 |
1.243 |
-11.072 |
Decrease |
8.907 |
No |
No |
Combined |
T |
47 |
1.346 |
11.647 |
Increase |
8.651 |
No |
No |
-5.982 |
Increase |
11.462 |
No |
No |
C |
50 |
0.676 |
5.345 |
Increase |
7.905 |
No |
No |
IN |
Two-lane |
Paved |
T |
14 |
0.736 |
-18.579 |
Decrease |
25.239 |
No |
No |
44.993 |
Decrease |
21.492 |
Yes |
Yes |
C |
7 |
1.359 |
48.020 |
Increase |
35.335 |
No |
No |
Unpaved |
T |
16 |
1.340 |
-35.945 |
Decrease |
26.829 |
No |
No |
43.548 |
Decrease |
26.137 |
No |
No |
C |
18 |
0.598 |
13.469 |
Increase |
22.521 |
No |
No |
Combined |
T |
30 |
1.339 |
-24.947 |
Decrease |
18.633 |
No |
No |
40.939 |
Decrease |
17.167 |
Yes |
Yes |
C |
25 |
1.403 |
27.078 |
Increase |
19.294 |
No |
No |
GA
& IN |
Two-lane |
Paved |
T |
39 |
1.295 |
14.685 |
Increase |
11.337 |
No |
No |
16.528 |
Decrease |
11.919 |
No |
No |
C |
26 |
2.633 |
37.393 |
Increase |
14.199 |
Yes |
Yes |
Unpaved |
T |
38 |
0.087 |
-0.961 |
Decrease |
11.012 |
No |
No |
-6.361 |
Increase |
15.147 |
No |
No |
C |
49 |
0.827 |
-6.884 |
Decrease |
8.328 |
No |
No |
Combined |
T |
77 |
0.924 |
7.328 |
Increase |
7.93 |
No |
No |
1.667 |
Decrease |
9.780 |
No |
No |
C |
75 |
1.246 |
9.148 |
Increase |
7.341 |
No |
No |
T = Treatment sites resurfaced with safety
edge.
C
= Comparison sites resurfaced without safety edge.
Table 19. Before-after EB evaluation results for PDO crashes.
State |
Roadway type |
Shoulder type |
Site type |
Number of
sites |
Odds ratio |
Change in crash frequency from before to
after resurfacing |
Statistically significant? |
Safety edge effect |
Percent change |
Direction |
Standard error (%) |
5% level |
10% level |
Effect (%) |
Direction |
Standard error (%) |
5% level |
10% level |
GA |
Two-lane |
Paved |
T |
25 |
0.975 |
9.276 |
Increase |
9.511 |
No |
No |
2.554 |
Decrease |
15.183 |
No |
No |
C |
19 |
0.837 |
12.140 |
Increase |
14.502 |
No |
No |
Unpaved |
T |
22 |
2.886 |
-20.980 |
Decrease |
7.271 |
Yes |
Yes |
24.281 |
Decrease |
10.078 |
Yes |
Yes |
C |
31 |
0.437 |
4.359 |
Increase |
9.963 |
No |
No |
Combined |
T |
47 |
1.150 |
-6.764 |
Decrease |
5.881 |
No |
No |
13.201 |
Decrease |
8.607 |
No |
No |
C |
50 |
0.899 |
7.416 |
Increase |
8.249 |
No |
No |
IN |
Two-lane |
Paved |
T |
14 |
0.287 |
4.045 |
Increase |
14.108 |
No |
No |
6.579 |
Decrease |
18.450 |
No |
No |
C |
7 |
0.710 |
11.372 |
Increase |
16.024 |
No |
No |
Unpaved |
T |
16 |
1.898 |
47.501 |
Increase |
25.033 |
No |
Yes |
-50.902 |
Increase |
33.486 |
No |
No |
C |
18 |
0.160 |
-2.254 |
Decrease |
14.046 |
No |
No |
Combined |
T |
30 |
1.449 |
18.175 |
Increase |
12.540 |
No |
No |
-12.894 |
Increase |
16.531 |
No |
No |
C |
25 |
0.440 |
4.678 |
Increase |
10.631 |
No |
No |
GA
& IN |
Two-lane |
Paved |
T |
39 |
0.995 |
7.860 |
Increase |
7.901 |
No |
No |
3.845 |
Decrease |
11.632 |
No |
No |
C |
26 |
1.127 |
12.173 |
Increase |
10.803 |
No |
No |
Unpaved |
T |
38 |
1.469 |
-10.599 |
Decrease |
7.215 |
No |
No |
12.795 |
Decrease |
9.898 |
No |
No |
C |
49 |
0.309 |
2.518 |
Increase |
8.150 |
No |
No |
Combined |
T |
77 |
0.185 |
-0.995 |
Decrease |
5.364 |
No |
No |
7.100 |
Decrease |
7.601 |
No |
No |
C |
75 |
1.007 |
6.572 |
Increase |
6.529 |
No |
No |
T = Treatment sites resurfaced with safety
edge.
C
= Comparison sites resurfaced without safety edge.
Table 20. Before-after EB evaluation results for total run-off-road crashes.
State |
Roadway type |
Shoulder type |
Site type |
Number of
sites |
Odds ratio |
Change in crash frequency from before to
after resurfacing |
Statistically significant? |
Safety edge effect |
Percent change |
Direction |
Standard error (%) |
5% level |
10% level |
Effect (%) |
Direction |
Standard error (%) |
5% level |
10% level |
GA |
Two-lane |
Paved |
T |
25 |
3.375 |
27.777 |
Increase |
8.230 |
Yes |
Yes |
13.721 |
Decrease |
9.010 |
No |
No |
C |
19 |
3.956 |
48.097 |
Increase |
12.158 |
Yes |
Yes |
Unpaved |
T |
22 |
0.102 |
0.718 |
Increase |
7.049 |
No |
No |
9.080 |
Decrease |
8.652 |
No |
No |
C |
31 |
1.487 |
10.777 |
Increase |
7.248 |
No |
No |
Combined |
T |
47 |
2.594 |
14.006 |
Increase |
5.400 |
Yes |
Yes |
7.872 |
Decrease |
6.406 |
No |
No |
C |
50 |
3.766 |
23.747 |
Increase |
6.306 |
Yes |
Yes |
IN |
Two-lane |
Paved |
T |
14 |
3.152 |
63.675 |
Increase |
20.201 |
Yes |
Yes |
8.183 |
Decrease |
15.844 |
No |
No |
C |
7 |
3.639 |
78.263 |
Increase |
21.505 |
Yes |
Yes |
Unpaved |
T |
16 |
3.408 |
105.593 |
Increase |
30.982 |
Yes |
Yes |
-46.895 |
Increase |
27.796 |
No |
Yes |
C |
18 |
2.502 |
39.959 |
Increase |
15.968 |
Yes |
Yes |
Combined |
T |
30 |
4.573 |
78.116 |
Increase |
17.083 |
Yes |
Yes |
-13.484 |
Increase |
14.389 |
No |
No |
C |
25 |
4.391 |
56.952 |
Increase |
12.969 |
Yes |
Yes |
GA & IN |
Two-lane |
Paved |
T |
39 |
4.522 |
34.710 |
Increase |
7.675 |
Yes |
Yes |
14.177 |
Decrease |
7.593 |
No |
Yes |
C |
26 |
5.351 |
56.962 |
Increase |
10.645 |
Yes |
Yes |
Unpaved |
T |
38 |
1.631 |
11.534 |
Increase |
7.071 |
No |
No |
4.786 |
Decrease |
8.094 |
No |
No |
C |
49 |
2.581 |
17.140 |
Increase |
6.640 |
Yes |
Yes |
Combined |
T |
77 |
4.496 |
23.514 |
Increase |
5.230 |
Yes |
Yes |
6.315 |
Decrease |
5.654 |
No |
No |
C |
75 |
5.576 |
31.840 |
Increase |
5.710 |
Yes |
Yes |
T = Treatment sites resurfaced with safety
edge.
C = Comparison sites resurfaced
without safety edge.
Table 21. Before-after EB evaluation results for fatal and injury run-off-road crashes.
State |
Roadway type |
Shoulder type |
Site type |
Number of
sites |
Odds ratio |
Change in crash frequency from before to
after resurfacing |
Statistically significant? |
Safety edge effect |
Percent change |
Direction |
Standard error (%) |
5% level |
10% level |
Effect (%) |
Direction |
Standard error (%) |
5% level |
10% level |
GA |
Two-lane |
Paved |
T |
25 |
3.036 |
46.712 |
Increase |
15.384 |
Yes |
Yes |
19.175 |
Decrease |
12.659 |
No |
No |
C |
19 |
3.856 |
81.517 |
Increase |
21.142 |
Yes |
Yes |
Unpaved |
T |
22 |
1.891 |
28.134 |
Increase |
14.877 |
No |
Yes |
-18.058 |
Increase |
18.139 |
No |
No |
C |
31 |
0.784 |
8.535 |
Increase |
10.892 |
No |
No |
Combined |
T |
47 |
3.529 |
37.878 |
Increase |
10.733 |
Yes |
Yes |
-3.609 |
Increase |
11.192 |
No |
No |
C |
50 |
3.295 |
33.075 |
Increase |
10.037 |
Yes |
Yes |
IN |
Two-lane |
Paved |
T |
14 |
0.086 |
-2.553 |
Decrease |
29.761 |
No |
No |
46.332 |
Decrease |
20.632 |
Yes |
Yes |
C |
7 |
1.931 |
81.574 |
Increase |
42.252 |
No |
Yes |
Unpaved |
T |
16 |
0.140 |
6.109 |
Increase |
43.637 |
No |
No |
-12.464 |
Increase |
51.101 |
No |
No |
C |
18 |
0.309 |
-5.651 |
Decrease |
18.313 |
No |
No |
Combined |
T |
30 |
0.018 |
0.440 |
Increase |
24.694 |
No |
No |
16.402 |
Decrease |
23.965 |
No |
No |
C |
25 |
1.137 |
20.146 |
Increase |
17.714 |
No |
No |
GA
& IN |
Two-lane |
Paved |
T |
39 |
2.877 |
39.851 |
Increase |
13.853 |
Yes |
Yes |
23.123 |
Decrease |
11.053 |
Yes |
Yes |
C |
26 |
4.323 |
81.916 |
Increase |
18.950 |
Yes |
Yes |
Unpaved |
T |
38 |
1.877 |
26.499 |
Increase |
14.120 |
No |
Yes |
-20.037 |
Increase |
17.137 |
No |
No |
C |
49 |
0.573 |
5.383 |
Increase |
9.388 |
No |
No |
Combined |
T |
77 |
3.407 |
33.764 |
Increase |
9.911 |
Yes |
Yes |
-2.622 |
Increase |
10.228 |
No |
No |
C |
75 |
3.469 |
30.346 |
Increase |
8.748 |
Yes |
Yes |
T = Treatment sites
resurfaced with safety edge.
C = Comparison sites resurfaced without
safety edge.
Table 22. Before-after EB evaluation results for PDO run-off-road crashes.
State |
Roadway type |
Shoulder type |
Site type |
Number of
sites |
Odds ratio |
Change in crash frequency from before to
after resurfacing |
Statistically significant? |
Safety edge effect |
Percent change |
Direction |
Standard error (%) |
5% level |
10% level |
Effect (%) |
Direction |
Standard error (%) |
5% level |
10% level |
GA |
Two-lane |
Paved |
T |
25 |
1.821 |
18.575 |
Increase |
10.200 |
No |
Yes |
5.160 |
Decrease |
14.498 |
No |
No |
C |
19 |
1.587 |
25.026 |
Increase |
15.770 |
No |
No |
Unpaved |
T |
22 |
1.286 |
-10.527 |
Decrease |
8.185 |
No |
No |
20.225 |
Decrease |
10.451 |
No |
Yes |
C |
31 |
1.158 |
12.156 |
Increase |
10.494 |
No |
No |
Combined |
T |
47 |
0.535 |
3.462 |
Increase |
6.472 |
No |
No |
11.524 |
Decrease |
8.673 |
No |
No |
C |
50 |
1.929 |
16.938 |
Increase |
8.779 |
No |
Yes |
IN |
Two-lane |
Paved |
T |
14 |
3.154 |
82.392 |
Increase |
26.120 |
Yes |
Yes |
-3.538 |
Increase |
21.327 |
No |
No |
C |
7 |
2.922 |
76.160 |
Increase |
26.061 |
Yes |
Yes |
Unpaved |
T |
16 |
3.396 |
131.099 |
Increase |
38.606 |
Yes |
Yes |
-31.229 |
Increase |
30.365 |
No |
No |
C |
18 |
2.699 |
76.104 |
Increase |
28.193 |
Yes |
Yes |
Combined |
T |
30 |
4.549 |
99.719 |
Increase |
21.920 |
Yes |
Yes |
-12.878 |
Increase |
17.414 |
No |
No |
C |
25 |
3.999 |
76.934 |
Increase |
19.240 |
Yes |
Yes |
GA
& IN |
Two-lane |
Paved |
T |
39 |
3.323 |
32.288 |
Increase |
9.718 |
Yes |
Yes |
7.374 |
Decrease |
11.235 |
No |
No |
C |
26 |
3.108 |
42.820 |
Increase |
13.778 |
Yes |
Yes |
Unpaved |
T |
38 |
0.657 |
5.574 |
Increase |
8.485 |
No |
No |
16.029 |
Decrease |
9.550 |
No |
No |
C |
49 |
2.548 |
25.727 |
Increase |
10.096 |
Yes |
Yes |
Combined |
T |
77 |
2.976 |
19.201 |
Increase |
6.452 |
Yes |
Yes |
10.162 |
Decrease |
7.404 |
No |
No |
C |
75 |
3.995 |
32.684 |
Increase |
8.181 |
Yes |
Yes |
T = Treatment sites resurfaced with safety
edge.
C
= Comparison sites resurfaced without safety edge.
Table 23. Before-after EB evaluation results for total drop-off-related crashes.
State |
Roadway type |
Shoulder type |
Site type |
Number of
sites |
Odds ratio |
Change in crash frequency from before to
after resurfacing |
Statistically significant? |
Safety edge effect |
Percent change |
Direction |
Standard error (%) |
5% level |
10% level |
Effect (%) |
Direction |
Standard error (%) |
5% level |
10% level |
GA |
Two-lane |
Paved |
T |
25 |
3.817 |
32.758 |
Increase |
8.582 |
Yes |
Yes |
10.293 |
Decrease |
9.405 |
No |
No |
C |
19 |
3.930 |
47.991 |
Increase |
12.210 |
Yes |
Yes |
Unpaved |
T |
22 |
0.591 |
4.334 |
Increase |
7.328 |
No |
No |
9.130 |
Decrease |
8.698 |
No |
No |
C |
31 |
1.970 |
14.817 |
Increase |
7.522 |
No |
Yes |
Combined |
T |
47 |
3.250 |
18.272 |
Increase |
5.623 |
Yes |
Yes |
6.603 |
Decrease |
6.522 |
No |
No |
C |
50 |
4.115 |
26.633 |
Increase |
6.472 |
Yes |
Yes |
IN |
Two-lane |
Paved |
T |
14 |
3.681 |
86.217 |
Increase |
23.425 |
Yes |
Yes |
8.759 |
Decrease |
15.949 |
No |
No |
C |
7 |
4.202 |
104.093 |
Increase |
24.772 |
Yes |
Yes |
Unpaved |
T |
16 |
4.374 |
193.003 |
Increase |
44.122 |
Yes |
Yes |
-79.564 |
Increase |
34.036 |
Yes |
Yes |
C |
18 |
3.357 |
63.175 |
Increase |
18.820 |
Yes |
Yes |
Combined |
T |
30 |
5.509 |
117.38 |
Increase |
21.305 |
Yes |
Yes |
-19.733 |
Increase |
15.389 |
No |
No |
C |
25 |
5.386 |
81.554 |
Increase |
15.141 |
Yes |
Yes |
GA & IN |
Two-lane |
Paved |
T |
39 |
5.191 |
42.320 |
Increase |
8.153 |
Yes |
Yes |
12.586 |
Decrease |
7.803 |
No |
No |
C |
26 |
5.657 |
62.812 |
Increase |
11.104 |
Yes |
Yes |
Unpaved |
T |
38 |
2.489 |
18.854 |
Increase |
7.574 |
Yes |
Yes |
4.455 |
Decrease |
8.189 |
No |
No |
C |
49 |
3.450 |
24.396 |
Increase |
7.070 |
Yes |
Yes |
Combined |
T |
77 |
5.564 |
31.039 |
Increase |
5.578 |
Yes |
Yes |
5.587 |
Decrease |
5.739 |
No |
No |
C |
75 |
6.428 |
38.794 |
Increase |
6.035 |
Yes |
Yes |
T = Treatment sites
resurfaced with safety edge.
C
= Comparison sites resurfaced without safety edge.
Table 24. Before-after EB evaluation
results for fatal and injury drop-off-related crashes.
State |
Roadway type |
Shoulder type |
Site type |
Number of
sites |
Odds ratio |
Change in crash frequency from before to
after resurfacing |
Statistically significant? |
Safety edge effect |
Percent change |
Direction |
Standard error (%) |
5% level |
10% level |
Effect (%) |
Direction |
Standard error (%) |
5% level |
10% level |
GA |
Two-lane |
Paved |
T |
25 |
3.082 |
48.356 |
Increase |
15.691 |
Yes |
Yes |
15.135 |
Decrease |
13.441 |
No |
No |
C |
19 |
3.639 |
74.815 |
Increase |
20.560 |
Yes |
Yes |
Unpaved |
T |
22 |
2.068 |
31.810 |
Increase |
15.383 |
Yes |
Yes |
-18.357 |
Increase |
18.246 |
No |
No |
C |
31 |
1.014 |
11.366 |
Increase |
11.214 |
No |
No |
Combined |
T |
47 |
3.683 |
40.587 |
Increase |
11.019 |
Yes |
Yes |
-5.202 |
Increase |
11.444 |
No |
No |
C |
50 |
3.317 |
33.635 |
Increase |
10.139 |
Yes |
Yes |
IN |
Two-lane |
Paved |
T |
14 |
1.727 |
120.288 |
Increase |
69.662 |
No |
Yes |
42.488 |
Decrease |
22.855 |
No |
Yes |
C |
7 |
3.073 |
283.030 |
Increase |
92.115 |
Yes |
Yes |
Unpaved |
T |
16 |
1.038 |
77.468 |
Increase |
74.600 |
No |
No |
38.503 |
Decrease |
28.727 |
No |
No |
C |
18 |
3.208 |
188.581 |
Increase |
58.789 |
Yes |
Yes |
Combined |
T |
30 |
2.037 |
105.168 |
Increase |
51.641 |
Yes |
Yes |
36.972 |
Decrease |
18.615 |
No |
Yes |
C |
25 |
4.473 |
225.519 |
Increase |
50.414 |
Yes |
Yes |
GA
& IN |
Two-lane |
Paved |
T |
39 |
3.473 |
53.546 |
Increase |
15.419 |
Yes |
Yes |
21.596 |
Decrease |
11.453 |
No |
Yes |
C |
26 |
4.604 |
95.839 |
Increase |
20.818 |
Yes |
Yes |
Unpaved |
T |
38 |
2.255 |
34.086 |
Increase |
15.115 |
Yes |
Yes |
-5.230 |
Increase |
15.186 |
No |
No |
C |
49 |
2.381 |
27.422 |
Increase |
11.516 |
Yes |
Yes |
Combined |
T |
77 |
4.106 |
44.481 |
Increase |
10.833 |
Yes |
Yes |
4.676 |
Decrease |
9.672 |
No |
No |
C |
75 |
4.980 |
51.568 |
Increase |
10.356 |
Yes |
Yes |
T = Treatment sites
resurfaced with safety edge.
C = Comparison sites resurfaced
without safety edge.
Table 25. Before-after EB evaluation results for PDO drop-off-related crashes.
State |
Roadway type |
Shoulder type |
Site type |
Number of
sites |
Odds ratio |
Change in crash frequency from before to
after resurfacing |
Statistically significant? |
Safety edge effect |
Percent change |
Direction |
Standard error (%) |
5% level |
10% level |
Effect (%) |
Direction |
Standard error (%) |
5% level |
10% level |
GA |
Two-lane |
Paved |
T |
25 |
2.281 |
24.794 |
Increase |
10.870 |
Yes |
Yes |
2.550 |
Decrease |
15.169 |
No |
No |
C |
19 |
1.698 |
28.059 |
Increase |
16.524 |
No |
No |
Unpaved |
T |
22 |
0.826 |
-7.063 |
Decrease |
8.556 |
No |
No |
20.631 |
Decrease |
10.466 |
No |
Yes |
C |
31 |
1.550 |
17.095 |
Increase |
11.032 |
No |
No |
Combined |
T |
47 |
1.194 |
8.149 |
Increase |
6.827 |
No |
No |
10.829 |
Decrease |
8.786 |
No |
No |
C |
50 |
2.307 |
21.283 |
Increase |
9.224 |
Yes |
Yes |
IN |
Two-lane |
Paved |
T |
14 |
3.242 |
81.224 |
Increase |
25.055 |
Yes |
Yes |
-2.553 |
Increase |
20.262 |
No |
No |
C |
7 |
3.085 |
76.713 |
Increase |
24.863 |
Yes |
Yes |
Unpaved |
T |
16 |
4.122 |
216.618 |
Increase |
52.557 |
Yes |
Yes |
-131.652 |
Increase |
50.289 |
Yes |
Yes |
C |
18 |
1.922 |
36.678 |
Increase |
19.087 |
No |
Yes |
Combined |
T |
30 |
5.032 |
118.845 |
Increase |
23.618 |
Yes |
Yes |
-40.967 |
Increase |
20.594 |
No |
Yes |
C |
25 |
3.600 |
55.246 |
Increase |
15.347 |
Yes |
Yes |
GA
& IN |
Two-lane |
Paved |
T |
39 |
3.695 |
37.481 |
Increase |
10.143 |
Yes |
Yes |
5.319 |
Decrease |
11.529 |
No |
No |
C |
26 |
3.217 |
45.205 |
Increase |
14.052 |
Yes |
Yes |
Unpaved |
T |
38 |
1.390 |
12.718 |
Increase |
9.148 |
No |
No |
7.890 |
Decrease |
10.369 |
No |
No |
C |
49 |
2.330 |
22.373 |
Increase |
9.601 |
Yes |
Yes |
Combined |
T |
77 |
3.730 |
25.534 |
Increase |
6.845 |
Yes |
Yes |
4.435 |
Decrease |
7.789 |
No |
No |
C |
75 |
3.926 |
31.360 |
Increase |
7.988 |
Yes |
Yes |
T = Treatment sites resurfaced with safety
edge.
C
= Comparison sites resurfaced without safety edge.
The safety edge effect shown in the results tables is the
ratio between the before-to-after change in crash frequency for the treatment
sites and the before-to-after change in crash frequency for the comparison
sites. This formulation of the safety effect was derived from the
multiplicative nature of crash modification factors (CMFs), as shown in
equation 3 and equation 4:
 (3) (3)
or
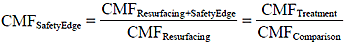 (4) (4)
The before-to-after
percent change in crash frequency can be converted to a CMF for this
calculation by dividing by 100 and adding a value of 1. Similarly, the
final CMF for the safety edge can be converted
back to a percent change by subtracting the ratio from 1 and multiplying by
100. When the increase in crashes with resurfacing was greater at the
comparison sites than at the treatment sites,
an indication that the safety edge treatment was effective, the safety edge
effect is shown as a positive value.
A precision estimate of the ratio was calculated and used to generate a confidence interval of the ratio. Confidence
intervals excluding the value 1 indicate statistical significance. For instance, the safety edge effect
for Georgia two-lane roadways with paved shoulders shown in table
17 is calculated by first converting the before-to-after
changes to CMFs and then taking the
ratio: (1+13.12/100)/(1+22.60/100) = 1.1312/1.2260 = 0.927. This CMF represents a (1-0.927)*100 = 7.73 percent
decrease in crashes. Since both confidence intervals (i.e., 7.73±(9.60)*1.645 and 7.73±(9.60)*1.96, where 1.645 and 1.96 are critical
confidence level values) contain the value 1, the estimate of the safety
edge effect is not significant.
The EB results indicate that for all two-lane sites in
Georgia and Indiana, the safety edge effect was 5.7 percent for total crashes,
6.3 percent for run-off-road crashes, and 5.6 percent for drop-off-related
crashes. While none of these results is statistically significant, they do show
a small, consistent benefit of the provision of the safety edge on rural
two-lane highways.
When the results are examined separately for the two shoulder
types (sites with paved shoulders having widths of 4 ft or less and sites with
unpaved shoulders) the use of the safety edge shows more benefit for paved
shoulder sites than for unpaved shoulder sites. The safety edge effect for
sites with paved shoulders is 9.5 percent for total crashes, 14.2 percent for
run-off-road crashes, and 12.6 percent for drop-off-related crashes. The
results for run-off road crashes are statistically significant at the 10
percent significance level, but the result for total crashes and drop-off
related crashes are not statistically significant. For sites with unpaved
shoulders, the safety edge effect was 6.5 percent for total crashes, 4.8
percent for run-off-road crashes, and 4.5 percent for drop-off-related
crashes. None of these results is significant.
The expectation was that the use of the safety edge treatment
would produce larger benefits on highways with unpaved shoulders, since
potential drop-offs at such sites are closer to the travel lanes than on
highways with paved shoulders and therefore are expected to be driven over more
frequently. However, the sites with unpaved shoulders in both States had much
lower ADT than the sites with paved
shoulders, and the lower numbers of crashes in the before and after resurfacing
periods undoubtedly affected the effectiveness estimates.
In considering the States individually, Georgia sites showed
a safety edge effect of 6.8 percent for
total crashes, 7.9 percent for run-off-road crashes, and 6.6 percent for
drop-off-related crashes. None of the
results were statistically significant. Indiana sites had safety edge effects
of ‑0.2 percent for total crashes, -13.5 percent for
run-off-road crashes, and -19.7 percent for drop-off-related crashes. The
negative results are not statistically significant at the 10 percent significance
level. The results for Indiana sites were affected by very low numbers of
crashes in the before period.
Overall results for the EB
evaluation are summarized in table
26 and compared to interim results obtained from
analyses conducted 1 and 2 years after resurfacing. The analysis for data
including
3 years after resurfacing, which are presented in this section of the report, includes
additional comparisons because shoulder
types and the two States were combined and compared. Fifty-six
of the 81 results for year 3 showed positive
safety edge effects; however, only 11 of these positive safety effects were
statistically significant. While 25 of the observed effects were
negative (e.g., comparison sites had fewer crashes than treatment sites), only 4
of these results were statistically significant.
Table 26. Summary of safety effects from year 3, year 2, and year 1 results
for before-after EB safety evaluations.
Direction of
safety effect |
Statistically significant
safety effect? |
Number of cases |
Year 3
analysis results |
Year 2
analysis results |
Year 1
analysis results |
Positive |
Yes |
11 |
8 |
2 |
Positive |
No |
45 |
14 |
13 |
Negative |
Yes |
4 |
7 |
6 |
Negative |
No |
21 |
7 |
15 |
Total |
81 |
36 |
36 |
The magnitude of the effects also changed with the addition of the year 3 data.
The safety effects from the year 3 evaluation
were smaller and less variable than the year 1 or year 2 results. The
overall impact of the safety edge was expected to be small, since
drop-off-related crashes are usually only a small percentage of the total non-intersection
crashes on rural roads. The year 3 results
presented above follow this trend and therefore are considered more reliable
than the earlier results. However, in some cases the smaller magnitude
of the safety edge effect makes it more difficult for the effect to be statistically
significant.
Total crashes on all sites mainly increased; some of this
increase may be due to a resurfacing effect that was very evident in the year 1
results but less so in later years.
The year 3 evaluation results presented above vary in
magnitude and statistical significance. The overall
evaluation results for total crashes in Georgia and Indiana combined show an
average safety edge treatment effect
of 5.7 percent. In other words, the sites treated with the safety edge appear
to have lower crash frequencies after
resurfacing than sites not treated with the safety edge. Although not
statistically significant, this seems to be the most appropriate overall
effectiveness measure for the safety edge treatment from the EB evaluation. The
lack of statistical significance for this result is not surprising given the
small magnitude of the effect.
Two trends were evident in the EB analysis of run-off-road
and drop-off-related crashes. First, the safety edge treatment generally
appears to have had a positive effect on safety for all site types except for
sites with unpaved shoulders in Indiana. This variability in results has not been
fully explained. Second, the negative safety edge effects for Indiana sites
with unpaved shoulders may be explained by
low frequencies of drop-off-related crashes on comparison sites in the period
before resurfacing. The safety edge effect was statistically significant only for
Indiana sites with unpaved shoulders (negative effect).
Georgia sites with paved
shoulders showed safety edge treatment effects of approximately 14 percent for run-off-road crashes and
10 percent for drop-off-related crashes. Indiana sites with unpaved shoulders had
safety edge effects of -31 to -47 percent for run-off-road crashes and -45 to -80 percent
for drop-off-related crashes, and these effects were statistically significant.
When data from both States were combined, the safety edge treatment effects for
paved shoulders were 14 percent for run-off-road crashes and 12.6 percent for
drop-off-related crashes. The effect for run-off-road
crashes was statistically significant at the 10 percent significance level. The
treatment effects for sites with unpaved shoulders were 5 percent for
run-off-road crashes and 4.5 percent for
drop-off-related crashes. These small, non-significant effects are probably influenced
strongly by the Indiana sites with unpaved shoulders.
The effects for run-off-road and drop-off-related crashes are
larger than the effects for total crashes in absolute magnitude but vary in
sign and statistical significance. These evaluation results for run-off-road
and drop-off-related crashes appear less stable, and thus less reliable, than
the results for total crashes. Although not statistically significant, the
single most reliable estimate of the effectiveness of the safety edge treatment
is the 5.7 percent reduction in total crashes observed for two-lane highways in
the combined data for sites with both paved and unpaved shoulders in both
Georgia and Indiana (see the last row in table
17).
There are several potential biases and limitations that may
influence these results, including
the following:
-
There were
some observed differences between treatment and comparison sites for the period
before resurfacing which could confound the analysis results (see sections 3.1
and 4.3.1).
-
The sites
with unpaved shoulders, where the safety edge treatment was expected to be most
effective, also had the lowest crash frequencies. This increased the
variability in the data and made the statistical test less powerful.
4.3.3 Cross-Sectional Analysis
A cross-sectional analysis of the crash data for the period after
resurfacing at the treatment and comparison sites was conducted to directly
compare the safety performance. This cross-sectional analysis is analogous to the analysis of safety differences for the
period before resurfacing reported in
section 4.3.1 but serves a different purpose. In this analysis, any observed
difference in safety performance between the treatment and comparison
sites is interpreted as an effect of the
safety edge treatment. This interpretation should be made cautiously because,
as noted in sections 3 and 4.3.1, there are other differences
between the treatment and comparison sites that may affect the comparison.
The cross-sectional comparison of data for the period after
resurfacing was conducted using analysis of covariance to assess the
statistical significance of the treatment versus comparison site effects. This
analysis was conducted for each State/roadway type/shoulder type combination
with PROC GENMOD in SAS®.(3) Traffic volume and site type
(treatment versus comparison) were the main factors of interest in the
analysis. Lane width was also considered but was not found to be statistically significant.
The analysis was conducted with the same negative binomial modeling techniques
described in the discussion of SPFs in section 4.2.
The safety edge treatment effect and its standard error were
calculated for each target crash type and adjusted
for any covariates. The results are presented in table 27. The significance and p‑value for the treatment versus comparison site
effects are also provided.
Where blank lines are
shown in the table, the regression model did not converge, so no model could be
developed. Table
27 shows that there were 44 models that converged for
the final analysis. This is an
improvement on the year 1 and year 2 analysis, for which only 20 and 35 models
converged, respectively. Thus, as additional years of data have become
available, more models have been obtained in
the cross-sectional analysis. Table
27 shows that the crash frequencies for the treatment
sites after resurfacing were generally lower than for the comparison sites,
indicating that the safety edge treatment was effective. Statistically
significant results for the safety edge effect (treatment versus comparison
sites) were obtained for 19 of the 44 models shown in the table. In 15 of these cases, the safety performance
of the treatment sites was better than the comparison sites, indicating
that the safety edge was effective. However, in four cases (three of which were
on two-lane highways with unpaved shoulders in Georgia), the safety performance
of the comparison sites was better than the treatment sites.
In summary, the cross-sectional analysis results are similar
to the results of the EB analysis, suggesting that the safety edge treatment is
effective in reducing crashes for sites with paved shoulders and for sites in
Indiana with unpaved shoulders. However, results for sites in Georgia with
unpaved shoulders did not show that the safety edge was effective in reducing
crashes.
The potential biases and limitations of this analysis are as
follows:
-
There were
some observed differences between treatment and comparison sites for the period
before resurfacing which could confound the analysis results (see sections 3.1
and 4.3.1).
-
The sites with unpaved shoulders, where the
safety edge treatment would be expected to be most effective, had the lowest
crash frequencies, which increased the variability in the data and made the
statistical test less powerful.
-
The cross-sectional approach does not explicitly
compensate for regression to the mean.
Table 27. Cross-sectional analysis of safety edge treatment effect for the period after resurfacing.
State |
Roadway type |
Shoulder type |
Crash type and severity level |
Number of site-years |
Intercept |
AADT effect |
Treatment effect |
Dispersion parameter |
R2LR% |
Safety edge effect2
(%) |
Coefficient |
Standard error |
p-Value |
Statistically significant?1 |
Coefficient |
Standard error |
p-Value |
Statistically significant?1 |
GA |
Multilane |
Paved |
TOT |
51 |
-13.212 |
1.542 |
0.309 |
0.000 |
Yes |
-0.655 |
0.305 |
0.032 |
Yes |
0.282 |
48.4 |
48.1 |
FI |
51 |
-12.940 |
1.360 |
0.332 |
0.000 |
Yes |
-0.293 |
0.257 |
0.254 |
No |
0.027 |
30.4 |
25.4 |
PDO |
51 |
-14.627 |
1.656 |
0.372 |
0.000 |
Yes |
-0.703 |
0.345 |
0.042 |
Yes |
0.404 |
44.0 |
50.5 |
rorTOT |
51 |
-19.840 |
2.114 |
0.329 |
0.000 |
Yes |
-0.946 |
0.201 |
0.000 |
Yes |
0.010 |
66.5 |
61.2 |
rorFI |
51 |
-15.748 |
1.562 |
0.391 |
0.000 |
Yes |
-0.410 |
0.244 |
0.092 |
Yes |
0.010 |
20.3 |
33.6 |
rorPDO |
51 |
-23.547 |
2.462 |
0.308 |
0.000 |
Yes |
-1.280 |
0.240 |
0.000 |
Yes |
0.010 |
61.8 |
72.2 |
doTOT |
51 |
-19.432 |
2.029 |
0.446 |
0.000 |
Yes |
-0.882 |
0.219 |
0.000 |
Yes |
0.010 |
48.8 |
58.6 |
doFI |
51 |
-18.509 |
1.841 |
0.380 |
0.000 |
Yes |
-0.610 |
0.121 |
0.000 |
Yes |
0.010 |
23.6 |
45.7 |
doPDO |
51 |
-20.271 |
2.061 |
0.552 |
0.000 |
Yes |
-1.130 |
0.354 |
0.001 |
Yes |
0.010 |
34.5 |
67.7 |
Two-lane |
Paved |
TOT |
132 |
-8.695 |
1.104 |
0.121 |
0.000 |
Yes |
0.111 |
0.183 |
0.545 |
No |
0.178 |
51.0 |
-11.7 |
FI |
132 |
-7.501 |
0.880 |
0.182 |
0.000 |
Yes |
-0.197 |
0.264 |
0.457 |
No |
0.273 |
27.4 |
17.8 |
PDO |
132 |
-11.162 |
1.306 |
0.125 |
0.000 |
Yes |
0.414 |
0.193 |
0.032 |
Yes |
0.136 |
49.6 |
-51.2 |
rorTOT |
132 |
-7.654 |
0.902 |
0.161 |
0.000 |
Yes |
-0.120 |
0.260 |
0.645 |
No |
0.279 |
30.3 |
11.3 |
rorFI |
132 |
-5.201 |
0.546 |
0.197 |
0.006 |
Yes |
-0.497 |
0.355 |
0.161 |
No |
0.453 |
11.5 |
39.2 |
rorPDO |
132 |
-12.208 |
1.322 |
0.216 |
0.000 |
Yes |
0.342 |
0.328 |
0.298 |
No |
0.283 |
29.3 |
-40.8 |
doTOT |
132 |
-8.244 |
0.927 |
0.163 |
0.000 |
Yes |
-0.153 |
0.301 |
0.611 |
No |
0.287 |
25.9 |
14.2 |
doFI |
132 |
-5.844 |
0.582 |
0.193 |
0.003 |
Yes |
-0.368 |
0.383 |
0.337 |
No |
0.589 |
8.7 |
30.8 |
doPDO |
132 |
-14.467 |
1.518 |
0.276 |
0.000 |
Yes |
0.328 |
0.415 |
0.428 |
No |
0.209 |
24.9 |
-38.9 |
Unpaved |
TOT |
159 |
-10.116 |
1.253 |
0.173 |
0.000 |
Yes |
0.581 |
0.225 |
0.010 |
Yes |
0.555 |
37.0 |
-78.7 |
FI |
159 |
-8.599 |
0.959 |
0.182 |
0.000 |
Yes |
0.415 |
0.226 |
0.066 |
Yes |
0.267 |
24.3 |
-51.5 |
PDO |
159 |
-12.683 |
1.498 |
0.199 |
0.000 |
Yes |
0.594 |
0.274 |
0.030 |
Yes |
0.683 |
34.0 |
-81.1 |
rorTOT |
159 |
-7.229 |
0.799 |
0.169 |
0.000 |
Yes |
0.341 |
0.222 |
0.125 |
No |
0.270 |
17.9 |
-40.6 |
rorFI |
159 |
-8.063 |
0.834 |
0.193 |
0.000 |
Yes |
0.275 |
0.265 |
0.301 |
No |
0.217 |
14.4 |
-31.6 |
rorPDO |
159 |
-8.374 |
0.840 |
0.177 |
0.000 |
Yes |
0.365 |
0.255 |
0.152 |
No |
0.262 |
12.0 |
-44.0 |
doTOT |
159 |
-7.422 |
0.773 |
0.196 |
0.000 |
Yes |
0.379 |
0.262 |
0.149 |
No |
0.301 |
14.2 |
-46.0 |
doFI |
159 |
-8.725 |
0.882 |
0.202 |
0.000 |
Yes |
0.297 |
0.257 |
0.248 |
No |
0.128 |
14.0 |
-34.6 |
doPDO |
159 |
-8.048 |
0.728 |
0.243 |
0.003 |
Yes |
0.411 |
0.344 |
0.231 |
No |
0.402 |
6.8 |
-50.9 |
See notes at end of table.
Table 27. Cross-sectional analysis of safety edge
treatment effect for the period after resurfacing-Continued.
State |
Roadway type |
Shoulder type |
Crash type and severity level |
Number of site-years |
Intercept |
AADT effect |
Treatment effect |
Dispersion parameter |
R2LR% |
Safety edge effect2
(%) |
Coefficient |
Standard error |
p-Value |
Statistically significant?1 |
Coefficient |
Standard error |
p-Value |
Statistically significant?1 |
|
IN |
Two-lane |
Paved |
TOT |
63 |
|
|
|
|
|
|
|
|
|
|
|
|
FI |
63 |
-1.982 |
0.117 |
0.647 |
0.856 |
No |
-0.819 |
0.582 |
0.159 |
No |
0.853 |
4.2 |
55.9 |
PDO |
63 |
|
|
|
|
|
|
|
|
|
|
|
|
rorTOT |
63 |
|
|
|
|
|
|
|
|
|
|
|
|
rorFI |
63 |
|
|
|
|
|
|
|
|
|
|
|
|
rorPDO |
63 |
|
|
|
|
|
|
|
|
|
|
|
|
doTOT |
63 |
|
|
|
|
|
|
|
|
|
|
|
|
doFI |
63 |
-13.163 |
1.184 |
3.132 |
0.705 |
No |
-1.599 |
0.729 |
0.028 |
Yes |
0.010 |
3.0 |
79.8 |
doPDO |
63 |
|
|
|
|
|
|
|
|
|
|
|
|
Unpaved |
TOT |
102 |
-4.887 |
0.543 |
0.256 |
0.034 |
Yes |
-0.069 |
0.211 |
0.742 |
No |
0.653 |
7.4 |
6.7 |
FI |
102 |
-5.650 |
0.493 |
0.313 |
0.115 |
No |
-1.215 |
0.492 |
0.013 |
Yes |
0.757 |
9.4 |
70.3 |
PDO |
102 |
-5.657 |
0.594 |
0.269 |
0.027 |
Yes |
0.206 |
0.231 |
0.373 |
No |
0.697 |
6.1 |
-22.9 |
rorTOT |
102 |
-3.429 |
0.273 |
0.396 |
0.491 |
No |
-0.864 |
0.394 |
0.028 |
Yes |
0.527 |
8.7 |
57.9 |
rorFI |
102 |
-3.926 |
0.219 |
0.399 |
0.583 |
No |
-1.689 |
0.610 |
0.006 |
Yes |
0.247 |
10.2 |
81.5 |
rorPDO |
102 |
-4.619 |
0.358 |
0.499 |
0.473 |
No |
-0.486 |
0.417 |
0.244 |
No |
0.972 |
3.4 |
38.5 |
doTOT |
102 |
-5.486 |
0.488 |
0.363 |
0.178 |
No |
-1.206 |
0.389 |
0.002 |
Yes |
0.320 |
11.1 |
70.1 |
doFI |
102 |
-9.490 |
0.869 |
0.355 |
0.014 |
Yes |
-1.970 |
1.029 |
0.056 |
Yes |
0.010 |
9.3 |
86.0 |
doPDO |
102 |
-4.672 |
0.327 |
0.525 |
0.534 |
No |
-0.990 |
0.407 |
0.015 |
Yes |
0.718 |
5.4 |
62.8 |
NY |
Two-lane |
Paved |
TOT |
18 |
-3.595 |
0.510 |
0.186 |
0.006 |
Yes |
-0.278 |
0.273 |
0.307 |
No |
0.117 |
28.4 |
24.3 |
FI |
18 |
-9.373 |
1.040 |
0.134 |
0.000 |
Yes |
0.092 |
0.144 |
0.525 |
No |
0.010 |
57.9 |
-9.6 |
PDO |
18 |
-2.241 |
0.311 |
0.281 |
0.268 |
No |
-0.440 |
0.405 |
0.277 |
No |
0.214 |
16.9 |
35.6 |
rorTOT |
18 |
-4.255 |
0.480 |
0.174 |
0.006 |
Yes |
-0.128 |
0.271 |
0.638 |
No |
0.010 |
28.5 |
12.0 |
rorFI |
18 |
-9.553 |
1.035 |
0.101 |
0.000 |
Yes |
0.004 |
0.135 |
0.976 |
No |
0.010 |
48.7 |
-0.4 |
rorPDO |
18 |
|
|
|
|
|
|
|
|
|
|
|
|
doTOT |
18 |
|
|
|
|
|
|
|
|
|
|
|
|
doFI |
18 |
|
|
|
|
|
|
|
|
|
|
|
|
doPDO |
18 |
|
|
|
|
|
|
|
|
|
|
|
|
1 At the 0.10 level.
2 Percent difference
between treatment and comparison sites.
TOT
= total crashes (all severity levels combined).
Fl
= fatal-and-injury crashes.
PDO
= property-damage-only crashes.
ror
= run-off-road crashes.
do
= drop-off-related crashes.
Note:
Blank cells represent models that did not converge.
4.3.4 Analysis of Shifts in the Crash Severity Distribution
An analysis was conducted to assess whether the safety edge
treatment affected the proportion of severe
crashes for specific crash types. This analysis compared fatal and injury
crashes as a proportion of total
crashes in the periods before and after resurfacing for each State/roadway
type/ shoulder type combination. Results of this analysis are presented
in table
28. The fatal and injury crash proportions were
evaluated for run-off-road crashes, drop-off-related crashes, and all crash types
combined. These comparisons were made by estimating the mean difference in
proportions and its confidence interval across all sites at a 10 percent significance
level.
Table 28. Comparison of proportions of fatal and
injury crashes before and after resurfacing.
|
Crash type |
State |
Roadway type |
Shoulder type |
Site type |
Average before
proportion |
Average after
proportion |
Estimated average
difference |
Number of sites |
Estimated mean
difference |
Lower 90%
confidence limit |
Upper 90%
confidence limit |
Significant at the
0.10 level? |
TOT |
GA |
Multilane |
Paved |
T |
0.362 |
0.397 |
0.035 |
10 |
0.088 |
-0.115 |
0.208 |
No |
C |
0.353 |
0.370 |
0.017 |
6 |
-0.024 |
-0.272 |
0.334 |
No |
Two-lane |
Paved |
T |
0.276 |
0.246 |
-0.030 |
15 |
-0.030 |
-0.132 |
0.054 |
No |
C |
0.414 |
0.444 |
0.031 |
13 |
0.042 |
-0.167 |
0.296 |
No |
Unpaved |
T |
0.209 |
0.476 |
0.267 |
20 |
0.238 |
0.088 |
0.480 |
Yes |
C |
0.384 |
0.317 |
-0.067 |
24 |
-0.025 |
-0.151 |
0.085 |
No |
All |
T |
0.245 |
0.354 |
0.109 |
35 |
0.099 |
0.006 |
0.216 |
Yes |
C |
0.395 |
0.366 |
-0.030 |
37 |
-0.009 |
-0.122 |
0.095 |
No |
IN |
Two-lane |
Paved |
T |
0.116 |
0.154 |
0.038 |
8 |
0.007 |
-0.172 |
0.286 |
No |
C |
0.222 |
0.165 |
-0.058 |
6 |
-0.034 |
-0.242 |
0.069 |
No |
Unpaved |
T |
0.111 |
0.088 |
-0.023 |
7 |
-0.166 |
-0.276 |
0.218 |
No |
C |
0.233 |
0.271 |
0.038 |
14 |
0.044 |
-0.042 |
0.165 |
No |
All |
T |
0.113 |
0.119 |
0.005 |
15 |
-0.047 |
-0.188 |
0.190 |
No |
C |
0.230 |
0.241 |
0.011 |
20 |
0.017 |
-0.072 |
0.106 |
No |
NY |
Two-lane |
Paved |
T |
0.507 |
0.334 |
-0.172 |
3 |
-0.181 |
|
|
No Test |
C |
0.407 |
0.219 |
-0.188 |
3 |
-0.188 |
|
|
No Test |
All |
Two-lane |
Paved |
T |
0.239 |
0.221 |
-0.018 |
26 |
-0.044 |
-0.116 |
0.045 |
No |
C |
0.367 |
0.354 |
-0.013 |
22 |
-0.032 |
-0.150 |
0.108 |
No |
Unpaved |
T |
0.168 |
0.313 |
0.145 |
27 |
0.156 |
0.022 |
0.350 |
Yes |
C |
0.329 |
0.300 |
-0.028 |
38 |
0.008 |
-0.083 |
0.079 |
No |
All |
T |
0.205 |
0.265 |
0.059 |
53 |
|
|
|
No |
C |
0.343 |
0.320 |
-0.023 |
60 |
|
|
|
No |
ROR |
GA |
Multilane |
Paved |
T |
0.340 |
0.459 |
0.119 |
9 |
0.168 |
-0.083 |
0.357 |
No |
C |
0.378 |
0.154 |
-0.224 |
6 |
-0.250 |
-0.400 |
-0.143 |
Yes |
Two-lane |
Paved |
T |
0.331 |
0.234 |
-0.097 |
17 |
-0.148 |
-0.297 |
0.035 |
No |
C |
0.386 |
0.361 |
-0.025 |
11 |
-0.035 |
-0.467 |
0.321 |
No |
Unpaved |
T |
0.309 |
0.491 |
0.182 |
14 |
0.250 |
0.021 |
0.542 |
Yes |
C |
0.339 |
0.366 |
0.026 |
19 |
0.065 |
-0.126 |
0.250 |
No |
All |
T |
0.321 |
0.355 |
0.034 |
31 |
0.035 |
-0.125 |
0.200 |
No |
C |
0.357 |
0.364 |
0.007 |
30 |
0.024 |
-0.142 |
0.214 |
No |
See notes at end
of table.
Table 28. Comparison of proportions of fatal and injury crashes before and after resurfacing-Continued.
|
Crash type |
State |
Roadway type |
Shoulder type |
Site type |
Average before proportion |
Average after proportion |
Estimated average difference |
Number of sites |
Estimated mean difference |
Lower 90% confidence limit |
Upper 90% confidence limit |
Significant at the
0.10 level? |
ROR |
IN |
Two-lane |
Paved |
T |
0.063 |
0.139 |
0.077 |
5 |
0.179 |
-0.171 |
0.750 |
No |
C |
0.486 |
0.193 |
-0.293 |
6 |
-0.317 |
-0.708 |
0.000 |
No |
Unpaved |
T |
0.207 |
0.096 |
-0.111 |
8 |
-0.333 |
-0.667 |
0.313 |
No |
C |
0.367 |
0.413 |
0.046 |
11 |
0.042 |
-0.294 |
0.387 |
No |
All |
T |
0.140 |
0.116 |
-0.024 |
13 |
-0.108 |
-0.333 |
0.333 |
No |
C |
0.400 |
0.351 |
-0.049 |
17 |
-0.113 |
-0.317 |
0.173 |
No |
NY |
Two-lane |
Paved |
T |
0.685 |
0.519 |
-0.166 |
3 |
-0.156 |
|
|
No Test |
C |
0.628 |
0.635 |
0.007 |
3 |
-0.023 |
|
|
No Test |
All |
Two-lane |
Paved |
T |
0.267 |
0.223 |
-0.044 |
25 |
-0.097 |
-0.229 |
0.065 |
No |
C |
0.435 |
0.349 |
-0.086 |
20 |
-0.133 |
-0.367 |
0.100 |
No |
Unpaved |
T |
0.266 |
0.325 |
0.059 |
22 |
0.089 |
-0.110 |
0.333 |
No |
C |
0.350 |
0.383 |
0.034 |
30 |
0.061 |
-0.097 |
0.217 |
No |
All |
T |
0.267 |
0.271 |
0.005 |
47 |
-0.011 |
-0.134 |
0.122 |
No |
C |
0.381 |
0.370 |
-0.011 |
50 |
-0.008 |
-0.142 |
0.117 |
No |
DO |
GA |
Multilane |
Paved |
T |
0.410 |
0.526 |
0.116 |
9 |
0.167 |
-0.083 |
0.333 |
No |
C |
0.401 |
0.186 |
-0.216 |
6 |
-0.250 |
-0.458 |
-0.057 |
Yes |
Two-lane |
Paved |
T |
0.416 |
0.313 |
-0.103 |
14 |
-0.200 |
-0.455 |
0.089 |
No |
C |
0.399 |
0.308 |
-0.091 |
12 |
-0.152 |
-0.500 |
0.250 |
No |
Unpaved |
T |
0.305 |
0.562 |
0.257 |
17 |
0.375 |
0.104 |
0.563 |
Yes |
C |
0.285 |
0.355 |
0.070 |
18 |
0.151 |
-0.089 |
0.333 |
No |
All |
T |
0.364 |
0.430 |
0.066 |
31 |
0.100 |
-0.075 |
0.292 |
No |
C |
0.328 |
0.337 |
0.009 |
30 |
0.000 |
-0.199 |
0.250 |
No |
IN |
Two-lane |
Paved |
T |
0.000 |
0.071 |
0.071 |
1 |
1.000 |
|
|
No Test |
C |
0.238 |
0.097 |
-0.141 |
2 |
-0.492 |
|
|
No Test |
Unpaved |
T |
0.141 |
0.063 |
-0.078 |
4 |
-0.438 |
-1.000 |
1.000 |
No |
C |
0.435 |
0.289 |
-0.146 |
11 |
-0.338 |
-0.583 |
0.125 |
No |
All |
T |
0.075 |
0.067 |
-0.008 |
5 |
0.000 |
-1.000 |
1.000 |
No |
C |
0.380 |
0.236 |
-0.144 |
13 |
-0.375 |
-0.554 |
0.000 |
Yes |
NY |
Two-lane |
Paved |
T |
0.667 |
0.000 |
-0.667 |
2 |
-1.000 |
|
|
No Test |
C |
0.667 |
0.167 |
-0.500 |
2 |
-0.750 |
|
|
No Test |
All |
Two-lane |
Paved |
T |
0.295 |
0.210 |
-0.085 |
17 |
-0.211 |
-0.472 |
0.078 |
No |
C |
0.388 |
0.243 |
-0.145 |
16 |
-0.300 |
-0.550 |
0.000 |
Yes |
Unpaved |
T |
0.236 |
0.352 |
0.116 |
21 |
0.250 |
0.000 |
0.508 |
No |
C |
0.340 |
0.331 |
-0.009 |
29 |
-0.003 |
-0.217 |
0.183 |
No |
All |
T |
0.267 |
0.277 |
0.010 |
38 |
0.000 |
-0.181 |
0.250 |
No |
C |
0.358 |
0.298 |
-0.060 |
45 |
-0.113 |
-0.289 |
0.028 |
No |
TOT = Total crashes.
ROR = Run-off-road
crashes.
DO =
Drop-off-related crashes.
T = Treatment sites
resurfaced with safety edge.
C = Comparison sites
resurfaced without safety edge.
Note: Blank cells
indicate that the test of proportions could not be conducted or that the
category had fewer than four sites.
These evaluations were performed with the Wilcoxon signed-rank
test, a nonparametric test that does not
require that the differences being considered follow a normal distribution. The
Wilcoxon signed-rank test was
programmed in SAS® using the algorithm developed for the FHWA SafetyAnalyst
software.(8) The primary measures of interest presented in table
28 for differences
in proportion of fatal and injury crashes are as follows:
- Average proportion of fatal and injury crashes
before resurfacing.
- Average proportion of fatal and injury crashes
after resurfacing.
-
Simple average difference in proportions
(after-before).
-
Number of sites included in the analysis.
-
Estimated median before-after effect.
-
Lower confidence limit of median before-after
effect.
-
Upper confidence limit of median before-after
effect.
-
Summary of statistical significance.
The estimated average
treatment effect is the
difference between the proportions for the periods before and after resurfacing
based only on those sites where the difference is not zero. Since the Wilcoxon signed-rank test uses only those sites
with an observed non-zero change in the proportion of fatal and injury
crashes, it estimates the median rather than the mean. Consequently, the test results are less influenced by extreme changes in
proportions. Cases in which the test of proportions could not be
conducted are left blank in the table.
A negative estimated median difference indicates that the
proportion of fatal and injury crashes decreased. If the number of sites was
less than four, no test was conducted.
The proportion of severe
crashes after resurfacing was lower than the proportion of severe
crashes before resurfacing in 31 out of 58
cases shown in table
28. Thirteen of the 31 positive results were
for sites resurfaced with the safety edge treatment, and 18 were for sites
resurfaced without the safety edge treatment. Only 4 of the 58 comparisons of
severity proportions were statistically significant;
all 4 of these cases were comparison sites. Overall, it appears that the
proportion of severe crashes was reduced from before to after
resurfacing, but only a few of the results were statistically significant, and
there is no apparent difference in the shift in severity distributions between
resurfacing with and without the safety edge treatment.
|


