Safety Evaluation of the Safety Edge Treatment
Appendix B. Pavement-Edge Drop-Off Data Collection Methodology
This appendix presents the methodology used to collect field
measurements for pavement-edge drop-offs.
Selection of Data Collection Locations
Several data collection locations were selected within each
resurfacing project site to obtain field measurements
of pavement-edge drop-offs. Data collection locations were generally 2-4 mi apart.
There were typically three to four data collection locations within each site,
depending on the overall site length.
Each data collection
location was predefined as being a specified distance, in whole miles, from the
start of the site. Then, to remove bias from
the data collection process, a random offset was added to the predefined
distance. This random offset, selected separately for each data location, was 0.1-0.9 mi, in increments of 0.1 mi. The location
defined by the predefined distance plus the offset was used as the starting point for data collection.
Field data collection personnel were given discretion to move the
starting point if the measurement location was clearly not representative of the roadway as a whole or if sight distance was
too limited for measurements to be made safely. Data were not collected
at a selected location if recent maintenance had occurred or if weather did not
permit data to be collected safely or accurately.
Field Measurements
Roadway characteristics were recorded at the selected
starting point, and pavement-edge
drop-off height was measured every 52 ft on
both sides of the roadway over a 0.1-mi interval beginning at the starting
point. A field data collection form is illustrated in figure 8. The data collection intervals are illustrated in figure
9. The measurements illustrated in the figure were
repeated at intervals of 2-4 mi along the roadway, as previously described.
The roadway characteristics recorded at each data collection starting
point included the following:
- Speed limit.
-
Pavement type.
-
Shoulder type.
-
Shoulder grade.
-
Shoulder width.
-
Lane cross-slope.
-
Lane width.
-
Pavement edge drop-off shape.
-
Grade.
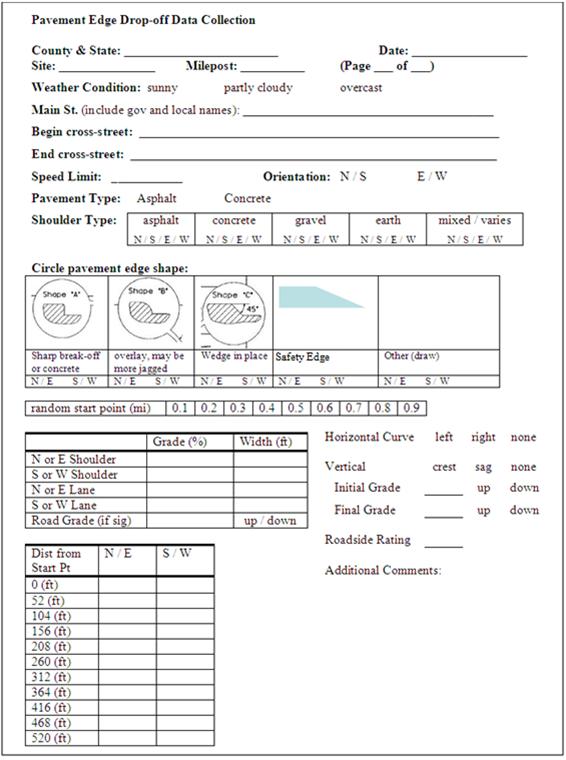
Figure 8. Illustration. Sample data collection form.
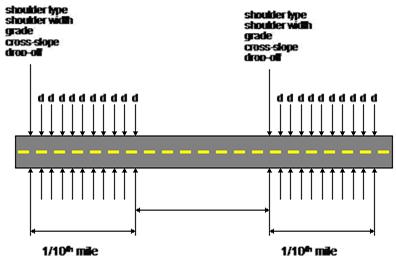
Figure 9. Illustration. Data collection intervals.
Shoulder Type and Width
Shoulder types were generally recorded as paved, gravel, or
earth. When a mixture of shoulder types was found (i.e., a composite shoulder),
the width of paved shoulder beyond the edge of the traveled way was recorded
and the presence of the other shoulder type was noted.
Drop-Off Shape
Drop-off shapes are shown
in the data collection form in figure
8. Shapes A, B, and C are defined in other
literature.(2) Most shapes correspond to A, B, or C. Shape A
typically corresponds to the edge of concrete
pavement. The likely cause of such drop-offs is settling of the concrete
pavement. Shape A may also occur when asphalt pavement breaks. Shape B
is the most common shape for drop-offs at the edge of an asphalt pavement. It
is the shape that occurs from a typical overlay. Shape C corresponds to the safety wedge. It is recorded when the edge
shape is angled at approximately 45 degrees and appears to be intentionally shaped at that angle. Other drop-off shapes were also recorded
when present.
Lane Width and Pavement Width
Both pavement widths (i.e., traveled way width) and lane
widths were measured. Lane widths were measured from the edge of the lane to
the painted centerline of the roadway. Where no centerline was present, the
lane width was calculated as half of the total pavement width. Where pavement
extended less than 4 inches beyond the pavement edge line, it was included in
the lane width. Where pavement extended more than 4 inches beyond the pavement
edge line, it was treated as a paved shoulder.
Drop-Off Height
Drop-off height was measured to the nearest 0.125 inch since
most measuring tools measure in 0.125-inch increments. Additionally,
measurement tools marked with 0.125-inch increments are easier to read consistently
than those marked with 0.1-inch increments. It is assumed that a tire could
catch on just a few inches of drop-off, even if shoulder material is at grade
beyond that distance. Therefore, drop-off height was measured approximately 4 inches from the edge of the pavement for shape A
and 4 inches from the base of the pavement for shapes B and C (see figure 10).
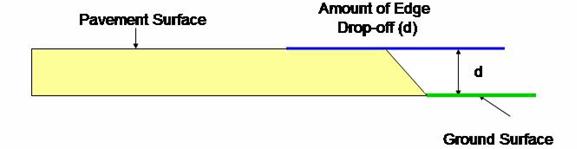
Figure 10. Illustration. Measurement of drop-off perpendicular to pavement surface.
Drop-off height was measured by placing a level across the
top of the pavement surface so that it hung
over the shoulder. A ruler was then used to measure the vertical distance
between the shoulder and the level at the appropriate location. Drop-off
height was measured from the ground to the base of the level, as shown in figure
11.
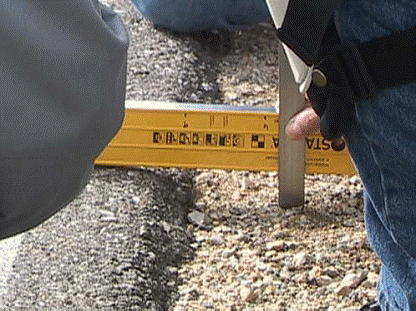
Figure 11. Photo. Measurement of pavement-edge drop-off height.
Pavement-edge drop-off
height was not measured at driveways or minor intersections if they
coincided with a planned data collection point. If a driveway or intersection
was located at a data collection point along a segment, data collectors recorded
that information and moved to the next data collection point.
|


