Safety Evaluation of the Safety Edge Treatment
Chapter 6. Benefit-Cost Analysis
This chapter presents the results of a benefit-cost analysis
of the safety edge treatment based on the results in this report. Section 6.1
presents the overall approach for determining benefit-cost estimates, section 6.2
documents the components of the analysis, and section 6.3 discusses the results
of the benefit-cost analysis.
6.1 Benefit-Cost Analysis Approach
The benefit-cost ratio for the safety edge treatment has been
determined according to equation 6:
 (6) (6)
Where:
B/C = benefit-cost ratio
NFI = number of fatal and injury crashes per mile per year before application of
the safety edge treatment
NPDO =
number of PDO crashes per mile per year before application of the safety edge
treatment
ESE = effectiveness (percent reduction in crashes) for
application of the safety edge treatment
CFI = cost savings per
crash for fatal and injury crashes reduced
CPDO = cost savings per
crash for PDO crashes reduced
(P/A, i, n) = uniform series present worth factor
i = minimum attractive rate of return
(discount rate), expressed as a proportion (i.e., i = 0.04, for a discount rate of 4 percent)
n = service life of safety edge treatment (years)
CCSE = cost for
application of the safety edge treatment (dollars per mile)
6.2 Components of the Benefit-Cost Analysis
The following sections document
the components of the benefit-cost computation, including crash
frequencies, treatment effectiveness, crash costs, service life, minimum
attractive rate of return, uniform series present worth factor, and treatment
cost.
6.2.1 Crash Frequencies
Crash frequencies per mile per year were estimated for the benefit-cost analysis using the SPFs presented in section 4.2. Only two-lane highway
sites were considered because no treatment effectiveness measure was found for multilane highway sites. Both Georgia
and Indiana SPFs were used because
each State has an SPF and because using the individual State SPFs constitutes
a sensitivity analysis of the
results. The location of the SPFs used in the benefit-cost analysis are shown
in table
33.
Table 33. SPFs used in benefit-cost analysis.
State |
Roadway type |
Shoulder type |
Crash type and security level |
Table |
Georgia |
Two-lane highway |
Paved |
All crashes |
10 |
Georgia |
Two-lane highway |
Paved |
F&I crashes |
10 |
Georgia |
Two-lane highway |
Paved |
PDO crashes |
10 |
Indiana |
Two-lane highway |
Paved |
All crashes |
11 |
Indiana |
Two-lane highway |
Paved |
F&I crashes |
11 |
Indiana |
Two-lane highway |
Paved |
PDO crashes |
11 |
Georgia |
Two-lane highway |
Unpaved |
All crashes |
10 |
Georgia |
Two-lane highway |
Unpaved |
F&I crashes |
10 |
Georgia |
Two-lane highway |
Unpaved |
PDO crashes |
10 |
Indiana |
Two-lane highway |
Unpaved |
All crashes |
11 |
Indiana |
Two-lane highway |
Unpaved |
F&I crashes |
11 |
Indiana |
Two-lane highway |
Unpaved |
PDO crashes |
11 |
F&I = Fatal and injury.
PDO =
Property-damage-only. |
The computation of crash frequencies was performed as
illustrated in the following example of Georgia two-lane highways with paved
shoulders. This example illustrates the computation of crash frequencies per mile
per year for highways with a traffic volume of 1,000 vehicles per day.
SPF for total crashes from table
10:
NTOT = exp (-8.921 +
1.108 ln (1,000)) = 0.282 crashes per mi per year
SPF for fatal and injury crashes from table 10:
NFI = exp (-7.818 +
0.853 ln (1,000)) = 0.146 crashes per mi per year
SPF for PDO crashes from table
10:
NPDO = exp (-11.414 +
1.349 ln (1,000)) = 0.123 crashes per mi per year
Since the sum of NFI (0.146) and NPDO (0.123) is less than NTOT (0.282), the values of NFI and
NPDO are adjusted so that this sum is equal to NTOT, as
follows:
NFI (adjusted) = 0.282  = 0.153 crashes per mi per year = 0.153 crashes per mi per year
NPDO (adjusted) = 0.282  = 0.129 crashes per mi per year = 0.129 crashes per mi per year
6.2.2 Treatment Effectiveness
Based on the results of
the EB evaluation presented in section 4.3.2, the crash reduction effectiveness
of the safety edge treatment is 5.7 percent. Continuing the computational
example for Georgia two-lane highways with
paved shoulders and a traffic volume of 1,000 vehicles per day, the crash
reduction from the safety edge treatment would be estimated as follows:
For fatal and
injury crashes:
0.153 (0.057) = 0.008721 crashes reduced per mi per year
For PDO
crashes:
0.129 (0.057) = 0.007353 crashes reduced per mi per year
6.2.3 Crash Costs
The estimated crash costs
used in this analysis are based on those currently used in SafetyAnalyst,
as follows:
-
Fatal crash = $5,800,000.
-
A injury crash = $402,000.
-
B injury crash = $80,000.
-
C injury crash = $42,000.
-
PDO crash = $4,000.(8)
The costs are based on the
latest published FHWA values.(10) The weighted average cost of a
fatal and injury crash (assuming 1 percent
fatal crashes, 9 percent A injury crashes, 50 percent B injury crashes,
and 40 percent C injury crashes) is $150,980 per crash. Based on these crash
costs, the estimated annual crash reduction benefits for the example presented
above are as follows:
0.008721 (150,980) + (.007353) (4,000) = $1,346 per mi
6.2.4 Service Life
The service life of the safety edge treatment is estimated to
be 7 years, the same as the service life of a typical pavement resurfacing
project.
6.2.5 Minimum Attractive Rate of Return
The minimum attractive rate of return for this analysis is
estimated to be 4 percent. This value is currently
used in SafetyAnalyst and is representative of the real, long-term cost of
capital (i.e., not including inflation).(8)
6.2.6 Uniform Series Present Worth Factor
The uniform series present worth factor is applied to convert
the annual crash reduction benefits to a present value. This factor is
determined as shown in equation 7:
 (7) (7)
The uniform series present worth factor for a minimum
attractive rate of return of 4 percent and a service life of 7 years is
determined as follows:
(P/A, 4%, 7) = = 6.002 = 6.002
6.2.7 Treatment Cost
The cost of the safety edge treatment is estimated as falling
in the range of $536 to 2,145 per mi for both sides of the road combined, as
explained in section 5.2.
6.2.8 Benefit Cost Ratio
The value of the benefit-cost ratio is computed using equation
6. For the computational example previously presented, the maximum benefit-cost
ratio (estimated for the minimum treatment cost of $536 per mi) is determined
as follows:
B/C =  = 15.07 = 15.07
The minimum benefit-cost ratio for the same case (estimated
for the maximum treatment cost of $2,145 per mi) is determined as follows:
B/C =  = 3.77 = 3.77
The result indicates that the safety edge treatment provides at
least $3 in benefits for each dollar spent
on the treatment and possibly as much as $15 in benefits for each dollar spent
on the treatment depending on the thickness of the safety edge treatment
provided. This example addresses sites with a traffic volume of 1,000 vehicles
per day. Larger benefit-cost ratios would be expected for sites with higher
traffic volumes.
6.3 Benefit-Cost Analysis Results
The results of the
benefit-cost analysis are summarized in table
34 through table
37 for application of the safety edge treatment to
four types of roadways.
Table 34. Benefit-cost analysis
for application of safety edge treatment
on Georgia two-lane roadways with paved shoulders.
AADT (vehicles/day) |
1,000 |
5,000 |
10,000 |
15,000 |
20,000 |
Crash Frequencies |
Total
crashes per mile per year |
0.282 |
1.675 |
3.611 |
5.659 |
7.784 |
F&I
crashes per mile per year |
0.146 |
0.575 |
1.039 |
1.469 |
1.877 |
PDO
crashes per mile per year |
0.123 |
1.079 |
2.748 |
4.748 |
6.999 |
F&I
crashes per mile per year (adjusted) |
0.153 |
0.583 |
0.991 |
1.337 |
1.646 |
PDO
crashes per mile per year (adjusted) |
0.129 |
1.093 |
2.620 |
4.322 |
6.138 |
Safety Benefits-Number of Crashes Reduced |
F&I
crashes reduced per mile per year |
0.009 |
0.033 |
0.056 |
0.076 |
0.094 |
PDO
crashes reduced per mile per year |
0.007 |
0.062 |
0.149 |
0.246 |
0.350 |
Safety Benefits-Dollars |
F&I
crash reduction benefits per year ($) |
1,314 |
5,015 |
8,528 |
11,505 |
14,165 |
PDO
crash reduction benefits per year ($) |
29 |
249 |
597 |
986 |
1,399 |
Total
crash reduction benefits per year ($) |
1,344 |
5,264 |
9,126 |
12,491 |
15,565 |
Present
value of total benefits per year ($) |
8,065 |
31,597 |
54,773 |
74,972 |
93,421 |
Treatment Cost |
Minimum cost
of safety edge treatment ($ per mile) |
536 |
536 |
536 |
536 |
536 |
Maximum cost
of safety edge treatment ($ per mile) |
2,145 |
2,145 |
2,145 |
2,145 |
2,145 |
Benefit-Cost Ratio |
Minimum benefit-cost
ratio |
3.8 |
14.7 |
25.5 |
35.0 |
43.6 |
Maximum benefit-cost
ratio |
15.0 |
59.0 |
102.2 |
139.9 |
174.3 |
F&I = Fatal and injury.
PDO =
Property-damage-only. |
Table 35. Benefit-cost analysis for application of safety edge treatment
on Indiana two-lane roadways with paved shoulders.
AADT (veh/day) |
1,000 |
5,000 |
10,000 |
15,000 |
20,000 |
Crash Frequencies |
Total
crashes per mile per year |
0.664 |
2.175 |
3.626 |
4.888 |
6.043 |
F&I
crashes per mile per year |
0.158 |
0.444 |
0.694 |
0.900 |
1.082 |
PDO
crashes per mile per year |
0.542 |
1.722 |
2.832 |
3.789 |
4.659 |
F&I
crashes per mile per year (adjusted) |
0.150 |
0.446 |
0.713 |
0.938 |
1.139 |
PDO
crashes per mile per year (adjusted) |
0.514 |
1.729 |
2.912 |
3.950 |
4.904 |
Safety Benefits-Number of Crashes Reduced |
F&I
crashes reduced per mile per year |
0.009 |
0.025 |
0.041 |
0.053 |
0.065 |
PDO
crashes reduced per mile per year |
0.029 |
0.099 |
0.166 |
0.225 |
0.280 |
Safety Benefits-Dollars |
F&I
crash reduction benefits ($) |
1,291 |
3,841 |
6,138 |
8,072 |
9,804 |
PDO
crash reduction benefits ($) |
117 |
394 |
664 |
901 |
1,118 |
Total
crash reduction benefits ($) |
1,408 |
4,235 |
6,802 |
8,973 |
10,922 |
Present
value of total benefits ($) |
8,453 |
25,419 |
40,824 |
53,856 |
65,553 |
Treatment Cost |
Minimum cost
of safety edge treatment (per mile) |
536 |
536 |
536 |
536 |
536 |
Maximum cost
of safety edge treatment (per mile) |
2,145 |
2,145 |
2,145 |
2,145 |
2,145 |
Benefit-Cost Ratio |
Minimum benefit-cost
ratio |
3.9 |
11.9 |
19.0 |
25.1 |
30.6 |
Maximum benefit-cost
ratio |
15.8 |
47.4 |
76.2 |
100.5 |
122.3 |
F&I = Fatal and injury.
PDO =
Property-damage-only. |
Table 36. Benefit-cost analysis
for application of safety edge treatment
on Georgia two-lane roadways with unpaved shoulders.
AADT (veh/day) |
1,000 |
5,000 |
10,000 |
15,000 |
20,000 |
Crash Frequencies |
Total
crashes per mile per year |
0.377 |
1.822 |
3.588 |
5.335 |
7.068 |
F&I
crashes per mile per year |
0.144 |
0.673 |
1.307 |
1.927 |
2.538 |
PDO
crashes per mile per year |
0.226 |
1.151 |
2.320 |
3.496 |
4.676 |
F&I
crashes per mile per year (adjusted) |
0.147 |
0.672 |
1.293 |
1.896 |
2.487 |
PDO
crashes per mile per year (adjusted) |
0.231 |
1.150 |
2.296 |
3.439 |
4.581 |
Safety Benefits-Number of Crashes Reduced |
F&I
crashes reduced per mile per year |
0.008 |
0.038 |
0.074 |
0.108 |
0.142 |
PDO
crashes reduced per mile per year |
0.013 |
0.066 |
0.131 |
0.196 |
0.261 |
Safety Benefits-Dollars |
F&I
crash reduction benefits ($) |
1,263 |
5,782 |
11,126 |
16,314 |
21,403 |
PDO
crash reduction benefits ($) |
53 |
262 |
523 |
784 |
1,045 |
Total
crash reduction benefits ($) |
1,316 |
6,044 |
11,649 |
17,098 |
22,447 |
Present
value of total benefits ($) |
7,898 |
36,277 |
69,920 |
102,624 |
134,730 |
Treatment Cost |
Minimum cost
of safety edge treatment (per mile) |
536 |
536 |
536 |
536 |
536 |
Maximum cost
of safety edge treatment (per mile) |
2,145 |
2,145 |
2,145 |
2,145 |
2,145 |
Benefit-Cost Ratio |
Minimum benefit-cost
ratio |
3.7 |
16.9 |
32.5 |
47.8 |
62.8 |
Maximum benefit-cost
ratio |
14.7 |
67.7 |
130.4 |
191.5 |
251.4 |
F&I = Fatal and injury.
PDO =
Property-damage-only. |
Table 37. Benefit-cost analysis for application of safety edge treatment
on Indiana two-lane roadways with unpaved shoulders.
AADT (veh/day) |
1,000 |
5,000 |
10,000 |
15,000 |
20,000 |
Crash Frequencies |
Total
crashes per mile per year |
0.409 |
1.263 |
2.053 |
2.728 |
3.338 |
F&I
crashes per mile per year |
0.118 |
0.235 |
0.317 |
0.376 |
0.426 |
PDO
crashes per mile per year |
0.336 |
1.027 |
1.662 |
2.202 |
2.689 |
F&I
crashes per mile per year (adjusted) |
0.106 |
0.236 |
0.329 |
0.398 |
0.456 |
PDO
crashes per mile per year (adjusted) |
0.302 |
1.028 |
1.725 |
2.330 |
2.882 |
Safety Benefits-Number of Crashes Reduced |
F&I
crashes reduced per mile per year |
0.006 |
0.013 |
0.019 |
0.023 |
0.026 |
PDO
crashes reduced per mile per year |
0.017 |
0.059 |
0.098 |
0.133 |
0.164 |
Safety Benefits-Dollars |
F&I
crash reduction benefits ($) |
916 |
2,027 |
2,827 |
3,428 |
3,926 |
PDO
crash reduction benefits ($) |
69 |
234 |
393 |
531 |
657 |
Total
crash reduction benefits ($) |
985 |
2,261 |
3,221 |
3,959 |
4,583 |
Present
value of total benefits ($) |
5,914 |
13,572 |
19,331 |
23,762 |
27,507 |
Treatment Cost |
Minimum cost
of safety edge treatment (per mile) |
536 |
536 |
536 |
536 |
536 |
Maximum cost
of safety edge treatment (per mile) |
2,145 |
2,145 |
2,145 |
2,145 |
2,145 |
Benefit-Cost Ratio |
Minimum benefit-cost
ratio |
2.8 |
6.3 |
9.0 |
11.1 |
12.8 |
Maximum benefit-cost
ratio |
11.0 |
25.3 |
36.1 |
44.3 |
51.3 |
F&I = Fatal and injury.
PDO = Property-damage-only.
For each State and roadway
type, benefit-cost analyses were performed for traffic volumes ranging
from 1,000 to 20,000 vehicles per day. The overall results of the benefit-cost
analysis are shown in figure
6 and figure
7.
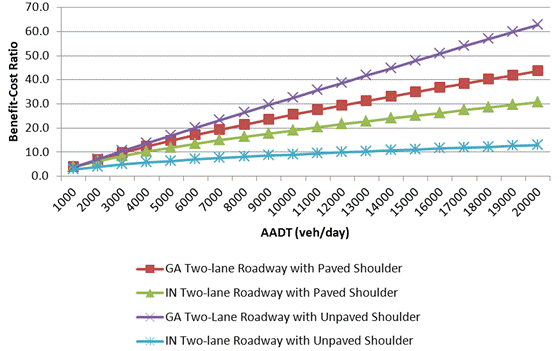
Figure 6. Graph. Minimum benefit-cost ratios for the safety edge treatment
as a function of AADT.
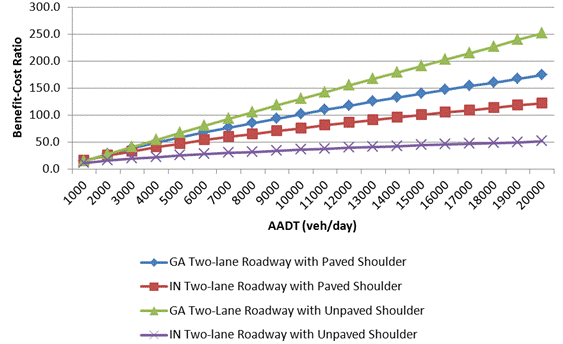
Figure 7. Graph. Maximum benefit-cost ratios for the safety edge treatment as a function of AADT.
For two-lane highways
with paved shoulders, application of the safety edge treatment has minimum
benefit-cost ratios ranging from 3.8 to 43.6
for Georgia conditions and from 3.9 to 30.6 for Indiana conditions. For
two-lane highways with unpaved shoulders, the minimum benefit-cost ratios for the safety edge treatment range from 3.7 to 62.8
for Georgia conditions and 2.8 to 12.8 for Indiana conditions. In all these cases, the maximum
benefit-cost ratios are at least four times the minimum benefit-cost
ratios.
These results suggest that the safety edge treatment is
highly cost-effective under a broad range of conditions. Even though there is
uncertainty in the treatment effectiveness estimate, the safety edge treatment is likely to be a good safety
investment in most situations, especially for roadways with higher
volume levels, where higher crash frequencies are expected.
|


