U.S. Department of Transportation
Federal Highway Administration
1200 New Jersey Avenue, SE
Washington, DC 20590
202-366-4000


Skip to content
Facebook iconYouTube iconTwitter iconFlickr iconLinkedInInstagram

Federal Highway Administration Research and Technology
Coordinating, Developing, and Delivering Highway Transportation Innovations

Report
This report is an archived publication and may contain dated technical, contact, and link information
Publication Number: FHWA-HRT-11-024
Date: April 2011

Safety Evaluation of the Safety Edge Treatment

Appendix C. Scatter Plots of Accidents and AADT

Figure 12 through figure 16 are scatter plots of crashes (per mile per year) and traffic volume (log basis) that were used to determine the appropriateness of modeling assumptions. In general, these plots show a positive relationship between crashes and traffic volume (i.e., crashes increase with increasing volume). Also, distributions for comparison, treatment, and reference sites appropriately overlap each other and do not contain extreme outliers.

This figure shows a scatter plot of total crashes per mile per year and logarithmic traffic volume for Georgia multilane roadways with paved shoulders. The x-axis has a range in logAADT of 6 to 10 while the y-axis has a range in total crashes per mile per year of 0 to 12. Separate symbols are used in the graph to represent treatment, comparison, and reference sites, which are all evenly distributed across the ranges in the graph. The plot shows an overall increasing trend with no outliers.

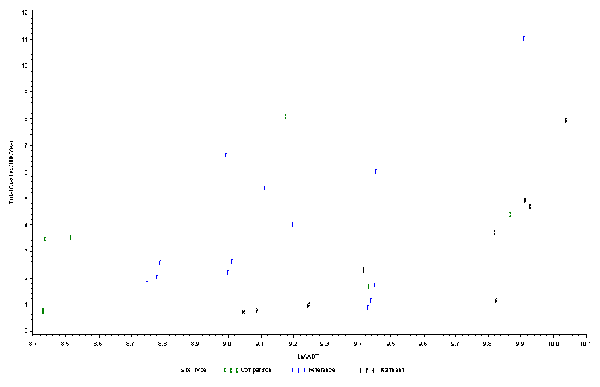
Figure 12. Graph. Georgia multilane roadway with paved shoulder.

This figure shows a scatter plot of total crashes per mile per year and logarithmic traffic volume for Georgia two-lane roadways with paved shoulders. The x-axis has a range in logAADT of 6 to 10 while the y-axis has a range in total crashes per mile per year of 0 to 17. Separate symbols are used in the graph to represent treatment, comparison, and reference sites, which are all evenly distributed across the ranges in the graph. The plot shows an overall increasing trend with no outliers.

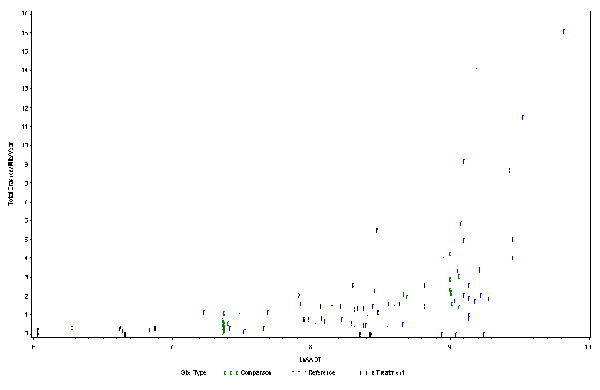
Figure 13. Graph. Georgia two-lane roadway with paved shoulder.

This figure shows a scatter plot of total crashes per mile per year and logarithmic traffic volume for Georgia two-lane roadways with unpaved shoulders. The x-axis has a range in logAADT of 6 to 10 while the y-axis has a range in total crashes per mile per year of 0 to 8. Separate  symbols are used in the graph to represent treatment, comparison, and reference sites, which are all evenly distributed across the ranges in the graph. The plot shows an overall increasing trend with no outliers.

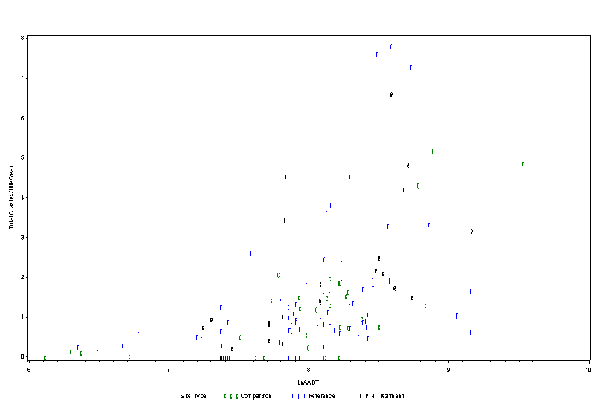
Figure 14. Graph. Georgia two-lane roadway with unpaved shoulder.

This figure shows a scatter plot of total crashes per mile per year and logarithmic traffic volume for Indiana two-lane roadways with paved shoulders. The x-axis has a range in logAADT of 7 to 10 while the y-axis has a range in total crashes per mile per year of 0 to 6. Separate symbols are used in the graph to represent treatment, comparison, and reference sites, which are all evenly distributed across the ranges in the graph. The plot shows an overall increasing trend with no outliers.

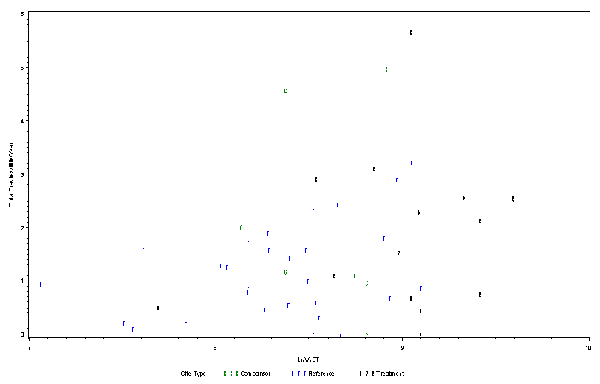
Figure 15. Graph. Indiana two-lane roadway with paved shoulder.

This figure shows a scatter plot of total crashes per mile per year and logarithmic traffic volume for Indiana two-lane roadways with unpaved shoulders. The x-axis has a range in logAADT of 5 to 10 while the y-axis has a range in total crashes per mile per year of 0 to 4. Separate symbols are used in the graph to represent treatment, comparison, and reference sites, which are all evenly distributed across the ranges in the graph. The plot shows an overall increasing trend with no outliers.

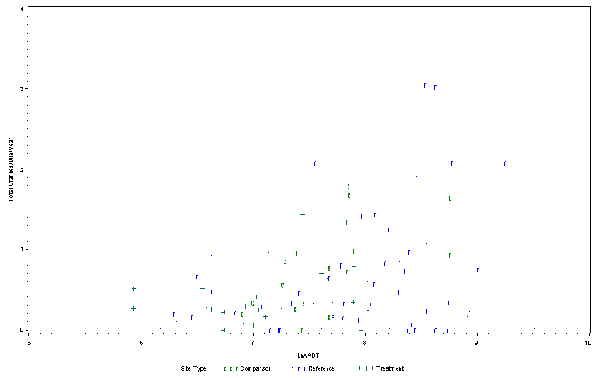
Figure 16. Graph. Indiana two-lane roadway with unpaved shoulder.

Federal Highway Administration | 1200 New Jersey Avenue, SE | Washington, DC 20590 | 202-366-4000
Turner-Fairbank Highway Research Center | 6300 Georgetown Pike | McLean, VA | 22101