Safety Evaluation of the Safety Edge Treatment
Chapter 5. Estimated Cost of the Safety Edge Treatment
This chapter presents the analysis results for the cost of
the safety edge treatment. Section 5.1 discusses an analysis of costs for both
treatment and comparison resurfacing contracts, and section 5.2 presents
another method for determining the cost of the safety edge.
5.1 Comparison of Overall Costs of Resurfacing Projects
Since the safety edge treatment adds a wedge of asphalt to each edge of
the roadway, it is expected to add
cost to a resurfacing project. Costs of resurfacing both treatment and
comparison sites were obtained
from each of the participating States after the resurfacing project was
completed and project accounts were finalized. The cost items obtained for each
project included the engineer's estimate, the contract cost or price bid for
the project by the winning bidder, and the cost per ton of the hot-mix asphalt (HMA) concrete used to resurface the roadway and
form the safety edge.
The Georgia data set included 28
resurfacing projects (15 treatment and 13 comparison sites) and 345 mi of roadway. A summary of the project
costs for Georgia is shown in table
29. Costs per mile of safety edge resurfacing versus
non-safety edge resurfacing were found to be $110,000 versus $140,000.
Table 29. Summary of Georgia resurfacing project costs (2005).
Cost item |
Weighted average
cost |
Nonweighted
average cost |
Safety edge sites |
Comparison sites |
Safety edge sites |
Comparison
sites |
Engineer's
estimate
($ million/mi) |
$2.650 |
$1.353 |
$3.222 |
$1.272 |
Contract
cost
($ million/mi) |
$1.306 |
$1.353 |
$1.183 |
$1.268 |
HMA
resurfacing cost ($/ton) |
$45.730 |
$43.050 |
$49.210 |
$42.970 |
HMA
resurfacing cost
($ million/mi) |
- |
- |
$0.110 |
$0.140 |
- Not applicable.
The Indiana data set included 16
resurfacing projects (8 treatment and 8 comparison sites) and 165 mi of roadway. A summary of the project costs
for Indiana is shown in table
30. Costs per mile of safety edge resurfacing versus non-safety edge resurfacing were found
to be $140,000 versus $150,000.
Table 30. Summary of Indiana resurfacing project costs (2005).
Cost
item |
Weighted average
cost |
Nonweighted
average cost |
Safety edge sites |
Comparison sites |
Safety edge sites |
Comparison sites |
Engineer's
estimate
($ million/mi) |
$1.878 |
$1.766 |
$1.748 |
$1.691 |
Contract
cost
($ million/mi) |
$1.505 |
$1.419 |
$1.407 |
$1.388 |
HMA
resurfacing cost ($/ton) |
$38.200 |
$35.510 |
$38.600 |
$35.650 |
HMA
resurfacing cost
($ million/mi) |
- |
- |
$0.140 |
$0.150 |
- Not applicable.
The New York data set included six resurfacing projects (three
treatment and three comparison sites) and 25 mi of roadway. A summary of
the project costs for New York is shown in table 31. Costs per mile of safety edge resurfacing versus non-safety
edge resurfacing were found to be $30,000 versus $40,000. Costs for New York projects are substantially less
than Indiana and Georgia. The HMA costs were generally higher in Indiana
and Georgia than in New York, but it is also possible that the New York
projects differed in scope from those in Indiana and Georgia.
Table 31. Summary of New York resurfacing project costs (2005).
Cost item |
Weighted average
cost |
Nonweighted
average cost |
Safety edge sites |
Comparison sites |
Safety edge sites |
Comparison sites |
Engineer's
estimate
($ million/mi) |
$0.368 |
$0.881 |
$0.354 |
$0.737 |
Contract
cost
($ million/mi) |
$0.106 |
$0.145 |
$0.108 |
$0.143 |
HMA
resurfacing cost ($/ton) |
$40.290 |
$49.180 |
$40.670 |
$51.710 |
HMA
resurfacing cost
($ million/mi) |
- |
- |
$0.030 |
$0.040 |
- Not applicable.
The cost analyses for resurfacing with the safety edge
treatment as compared to resurfacing projects on similar roads without the
safety edge treatment were reviewed collectively and individually. A summary of
the resurfacing costs for all three States combined is shown in table
32. Collectively, the cost of resurfacing with the
safety edge treatment was found to be slightly less than without the safety
edge treatment. Earlier analysis of the yield of coverage
on safety edge and non-safety edge sites in Georgia found only a very small difference
in the amount of area covered per ton of asphalt.
Table 32. Summary of combined Georgia, Indiana, and New York resurfacing project costs (2005).
Cost item |
Weighted average
cost |
Nonweighted average
cost |
Safety edge sites |
Comparison sites |
Safety edge sites |
Comparison sites |
Engineer's
estimate
($ million/mi) |
$1.632 |
$1.333 |
$1.775 |
$1.233 |
Contract
cost
($ million/mi) |
$0.973 |
$0.973 |
$0.899 |
$0.933 |
HMA
resurfacing cost ($/ton) |
$41.407 |
$42.578 |
$42.830 |
$43.445 |
HMA
resurfacing cost
($ million/mi) |
- |
- |
$0.096 |
$0.110 |
- Not applicable.
Some advocates of the
safety edge treatment maintain that incorporating the treatment in resurfacing
projects has little, if any, added cost
because the asphalt used is merely reformed to create the safety edge
treatment. The results summarized in table
32 can be interpreted as consistent with this
hypothesis. However, construction practices vary between contractors and highway agencies, and while the amount of asphalt
used for the safety edge treatment may be very small, it is unrealistic
to assume there is no additional cost to implement this treatment. The next
section presents an alternative approach to estimating the additional cost per
mile of the safety edge treatment.
5.2 Cost of Safety Edge Treatment Based on Amount of Asphalt Used
An alternative method to determine
the cost of the safety edge treatment is to compute the amount of
asphalt used to provide the treatment and multiply this quantity by a typical bid
cost per ton of HMA for that specific project.
Figure 5 shows a typical triangular cross section for the
safety edge treatment. The safety edge treatment is shown with a cross slope of
30 degrees, which is consistent with current practice. The cost per mile
for the safety edge treatment on both sides of the road based on the cross
section shown in figure 5 can be estimated using equation 5.
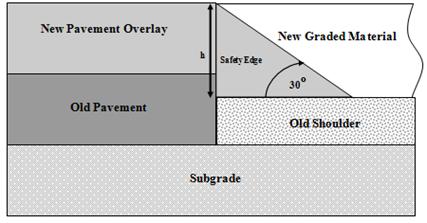
Figure 5. Diagram. Typical cross section for the safety edge treatment on one side of the road.
 (5) (5)
Where:
CCSE = cost for
application of the safety edge treatment ($ per mi)
A = area of the safety edge
treatment cross section (ft2) 
h = height of safety edge
treatment (inches)
L = length of safety edge
treatment (ft)
D = HMA density (1b/ft3)
C = HMA cost ($/ton)
The height of the safety edge treatment (h) is estimated to range from 1.5 to 3.0 inches, based on the assumption that a 1.5-inch overlay will be
placed and that the shoulder will be leveled between 0 and 1.5 inches
below the elevation of the pavement existing before resurfacing.
The length of the safety edge treatment for a 1.0-mi road
section would be 2.0 mi or 10,560 ft for both sides of the road combined.
The density of the HMA for the safety edge treatment is
estimated to be 100 1b/ft3. This is less than the maximum density of
compacted asphalt because the safety edge treatment is not compacted as an
overlay course would be.
The cost of HMA has increased since the 2005 costs shown in table
29 through table
32. HMA costs vary substantially between regions of the
United States. Based on discussions with several highway agencies, a
representative current price for HMA is $75 per ton.
Applying equation 5 to the
values discussed above, the cost for a safety edge treatment 1.5 inches
high would be $536 per mi. The cost for a
safety edge treatment 3.0 inches high would be $2,145 per mi. Thus, a
reasonable range of costs for the safety edge treatment is $536-2,145 per
mi.
|


