U.S. Department of Transportation
Federal Highway Administration
1200 New Jersey Avenue, SE
Washington, DC 20590
202-366-4000
Federal Highway Administration Research and Technology
Coordinating, Developing, and Delivering Highway Transportation Innovations
| REPORT |
| This report is an archived publication and may contain dated technical, contact, and link information |
|
| Publication Number: FHWA-HRT-11-056 Date: October 2012 |
Publication Number: FHWA-HRT-11-056 Date: October 2012 |
The proposed system consists of a stereo rig that is made of off-the-shelf monochrome cameras and a commercial stereo processing board that runs on multicore personal computer environments.(23) The cameras are of standard NTSC automotive grade with 720 × 480 image resolution with a 46-degree field of view. The stereo rig is mounted inside a vehicle (Toyota® Highlander) that also has a dual-quad-core processing unit and electronics to power the computer using the vehicle battery. This test platform allows the researchers to conduct live experiments and collect data for offline processing.
To evaluate system performance, the research team captured and ground truth-marked a number of data sequences in various urban driving scenarios. The testing data included sequences of pedestrians crossing the road, cluttered intersections, and pedestrians darting out from between parked vehicles. The research team also acquired data from publicly available datasets, which are particularly challenging because they have a large number of pedestrians and a crowded urban setting.(30) The research team compared the performance of this system against those of other state-of-the-art systems in the public dataset.(30)
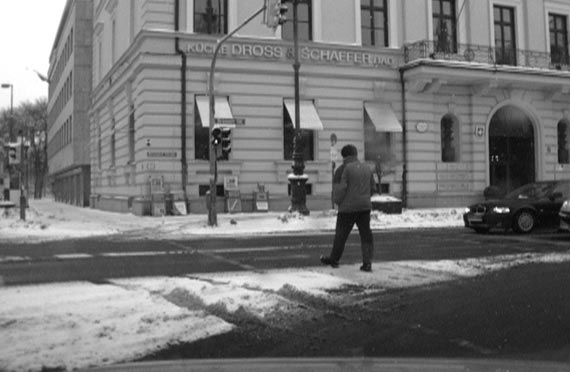
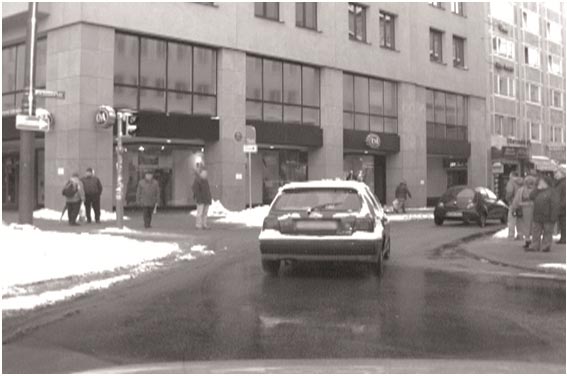
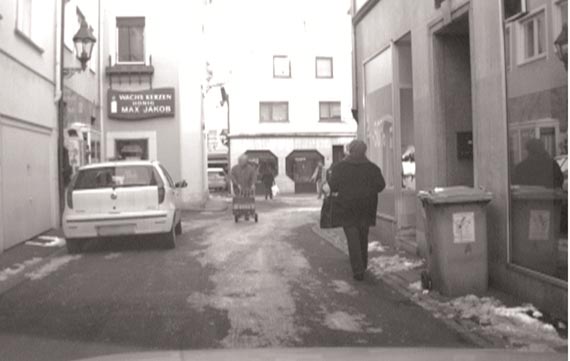
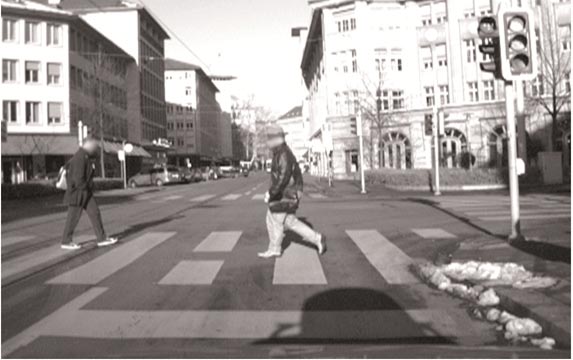
Several image examples of the data collected are provided in figure 39 through figure 51.
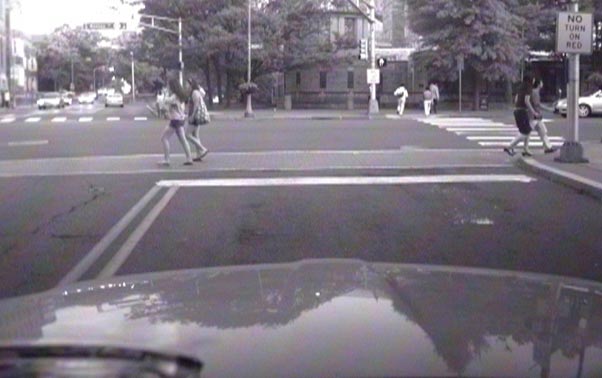
Figure 39. Photo. Pedestrians crossing at an intersection during the day under good lighting conditions.
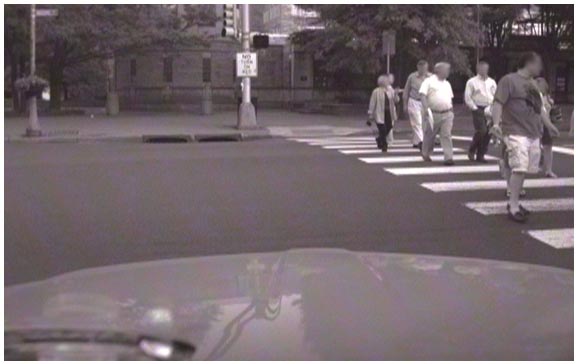
Figure 40. Photo. Pedestrians crossing at an intersection during the day while a vehicle turns right.
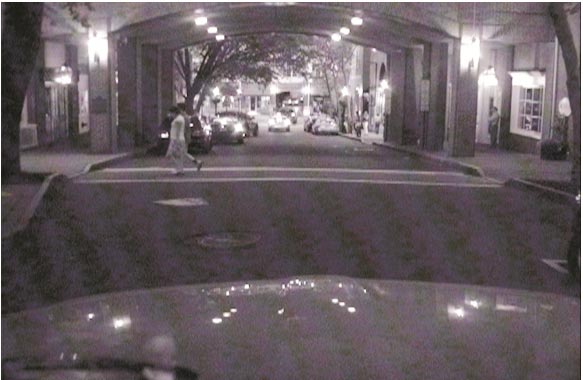
Figure 41. Photo. Pedestrians crossing an intersection at night.
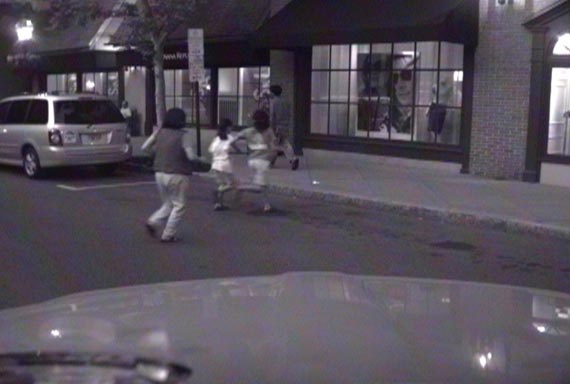
Figure 42. Photo. Pedestrians crossing a road at midblock during the evening.
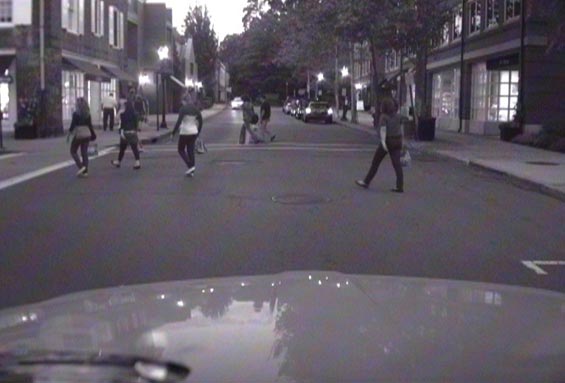
Figure 43. Photo. Pedestrians crossing a road at midblock during the early evening.
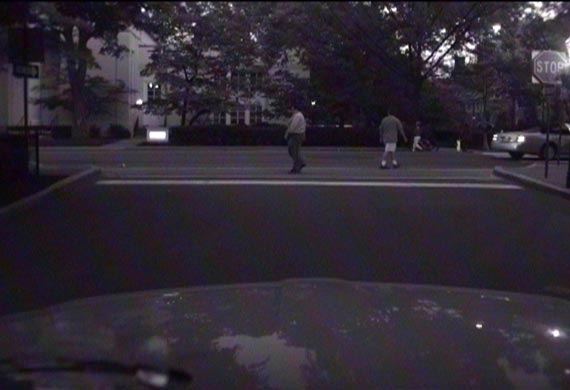
Figure 44. Photo. Pedestrians crossing a road at an intersection at night.
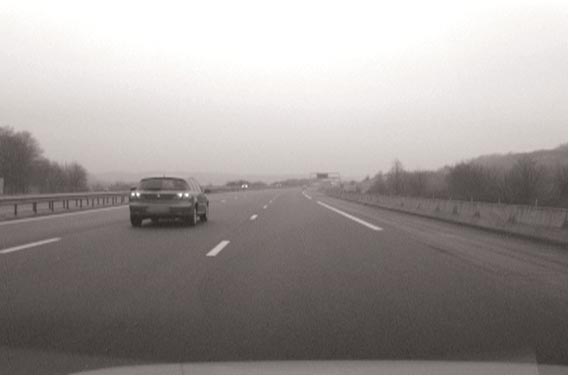
Figure 45. Photo. Vehicle driving on the highway.
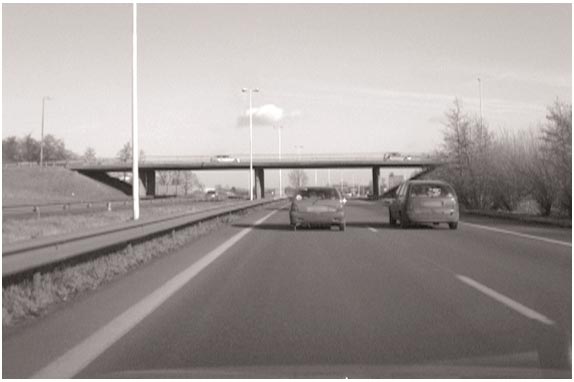
Figure 46. Photo. Second view of vehicles driving on the highway with tall vertical poles and overhang bridge in the field of view.
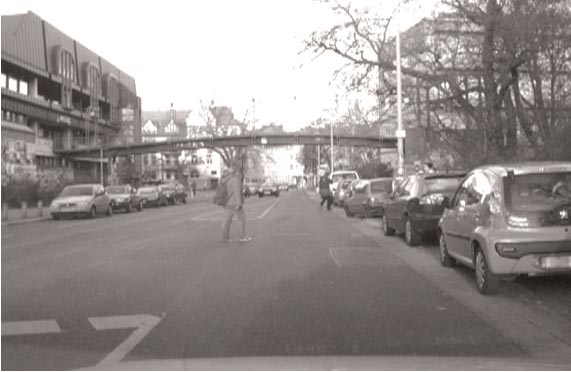
Figure 47. Photo. Pedestrians crossing midblock in a multilane urban street with overhang bridge as overlapping background.
|
©INRIA (See Acknowledgements section) |
Figure 48. Photo. Pedestrian crossing the street and right-turning vehicle in winter.
|
©INRIA (See Acknowledgements section) |
Figure 49. Photo. Pedestrians on the sidewalk in an urban environment during winter.
 |
©INRIA (See Acknowledgements section) |
Figure 50. Photo. Pedestrians walking in the roadway near parked vehicles in an urban environment.
|
©INRIA (See Acknowledgements section) |
Figure 51. Photo. Pedestrians at a crosswalk in front of a vehicle in bright conditions with saturated areas.
This section briefly discusses the experimental methodology and shows results on selected sequences. The system was evaluated by comparing it to hand-marked ground-truth marked data. For a detailed evaluation, the research team analyzed the performance under the following factors:
The results in this section are presented for typical sequences acquired at the research team’s campus, from a Europe dataset, and from a publicly available dataset.(31, 12) Overall, the research team captured over 2 h of video data using a vehicle owned by the research team and a vehicle maintained by the research team’s automotive tier 1 partner, Autoliv Electronics.
The results are representative of the developed system’s performance. It is important to note that for many of these sequences, the FPPF results are somewhat misleading in that the sequences are acquired for the purposes of pedestrian detection and do not have the empty roads that are typical of regular driving scenarios.
For each of the tables shown below, the performance of each key module of the developed system is shown including the stereo-based PD and the detector and classifiers as well as the detector, classifier, and tracker. Results are shown for both in-path pedestrians and all pedestrians in the field of view up to 131.2 ft (40 m).
Additionally, the research team tested the real-time system by driving the vehicle and qualitatively observing true detection and FP performance. The system was tested while driving at speeds of 15 and 30 mi/h (24.15 and 48.3 km/h). Researchers also demonstrated the system multiple times to FHWA personnel at the research team’s campus in Princeton, NJ, and at the Turner-Fairbank Highway Research Center in McLean, VA. The following main observations were made during live experiments:
Tabulated results are provided in table 3 through table 9. Table 3 results are as follows:
| Mode | Detection Rate (percent) | FPPF | Number of People |
| Detector only | 100 | 0.04 | 70 |
| Detector + classifier | 87.14 | 0 | 70 |
| Detector + classifier + tracker | 95.71 | 0 | 70 |
Table 4 results are as follows:
| Mode | Detection Rate (percent) | FPPF | Number of People |
| Detector only | 100 | 7.09 | 383 |
| Detector + classifier | 87.73 | 0.36 | 383 |
| Detector + classifier + tracker | 96.87 | 1.1 | 383 |
Table 5 results are as follows:
| Mode | Detection Rate (percent) | FPPF | Number of People |
| Detector-only | 95.73 | 10.06 | 234 |
| Detector + classifier | 90.60 | 0.54 | 234 |
| Detector + classifier + tracker | 98.29 | 1.55 | 234 |
Table 6 results are as follows:
| Mode | Detection Rate (percent) | FPPF | Number of People |
| Detector-only | 90.54 | 4.436 | 134 |
| Detector + classifier | 72.97 | 0.58 | 134 |
| Detector + classifier + tracker | 85.14 | 1.36 | 134 |
Table 7 results are as follows:
| Mode | Detection Rate (percent) | FPPF | Number of People |
| Detector-only | 86.43 | 5.35 | 161 |
| Detector + classifier | 70.54 | 0.98 | 161 |
| Detector + classifier + tracker | 74.03 | 2.5 | 161 |
Table 8 results are as follows:
| Mode | Detection Rate (percent) | FPPF | Number of People |
| Detector only | 94.56 | 0.82 | 584 |
| Detector + classifier | 66.61 | 0.16 | 584 |
| Detector + classifier + tracker | 92.81 | 0.45 | 584 |
Table 9 results are as follows:
| Mode | Detection Rate (percent) | FPPF | Number of People |
| Detector only | 91.91 | 10.78 | 1,816 |
| Detector + classifier | 66.13 | 1.56 | 1,816 |
| Detector + classifier + tracker | 89.21 | 3.55 | 1,816 |
Figure 52 through figure 55 show receiver operating characteristic (ROC) curves illustrating the developed system’s performance on four sequences (Seq00, Seq01, Seq02, and Seq03). The figures also show comparisons with another representative approach from literature.(31)
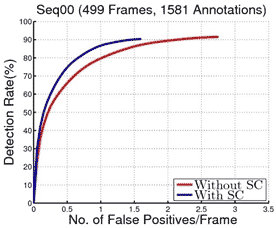
Figure 52. Graph. ROC curves for Seq00.
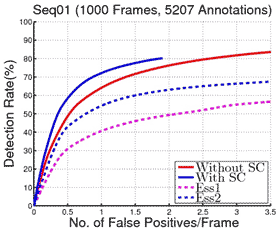
Figure 53. Graph. ROC curves for Seq01.
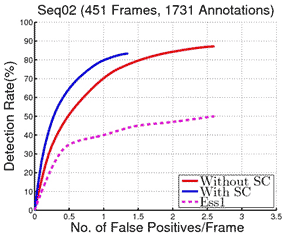
Figure 54. Graph. ROC curves for Seq02.
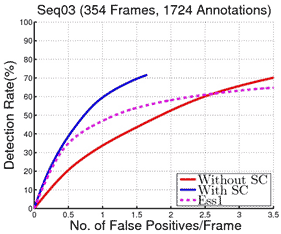
Figure 55. Graph. ROC curves for Seq03.
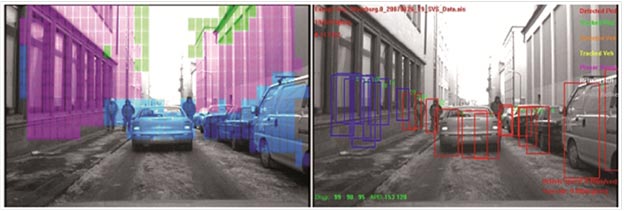
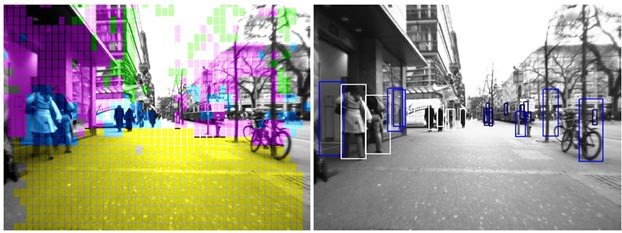
Example image outputs of the system are provided in figure 56 through figure 65. In the left image in figure 56, magenta and green pixels are detected by the SC as a tall, vertical structure. The image on the right shows the detections that were rejected by the SC in blue. The red rectangles indicate objects that were identified as pedestrians.
|
©INRIA (See Acknowledgements section) |
Figure 56. Photo. Sample output from SC in an alleyway.
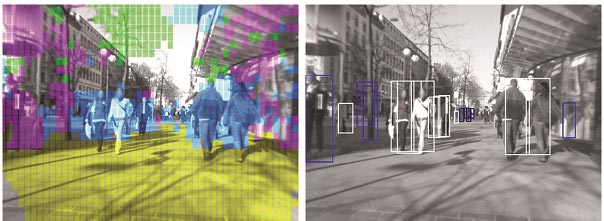
In the image on the left in figure 57, ground pixels are yellow, overhang/tree branch pixels are green, and buildings/tall vertical structure pixels are magenta. Blue pixels indicate regions containing objects that will be further processed by an appearance classifier. In the right image, blue boxes indicate objects rejected by the SC, and white boxes indicate potential pedestrians.
|
©INRIA (See Acknowledgements section) |
Figure 57. Photo. Sample output from SC in a dense urban scene with pedestrians in the vehicle path.
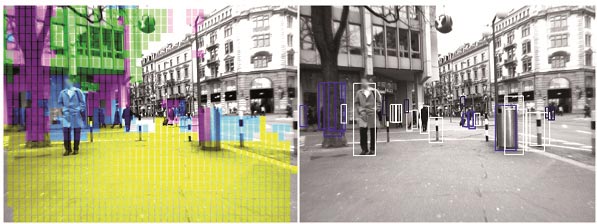
The image on the left in figure 58 shows ground pixels in yellow and tall vertical structure pixels in magenta and green. Pedestrian candidate regions are blue. In the right image, white boxes indicate detected pedestrian candidates, and blue boxes indicate rejected candidates.
|
©INRIA (See Acknowledgements section) |
Figure 58. Photo. Sample output from SC in an urban scene with pedestrians at varying distances from the vehicle.
In the image on the left in figure 59, the SC correctly rejects the poles and trees in the foreground, which are magenta and green. It also rejects portions of the bicycle parked near the sidewalk while validating the pedestrian detections. In the image on the right, pedestrian detections are shown in white boxes, while rejected candidates have blue boxes around them.
|
©INRIA (See Acknowledgements section) |
Figure 59. Photo. Sample output from SC in an urban scene with pedestrians entering a building and others in the distance ahead of the vehicle.
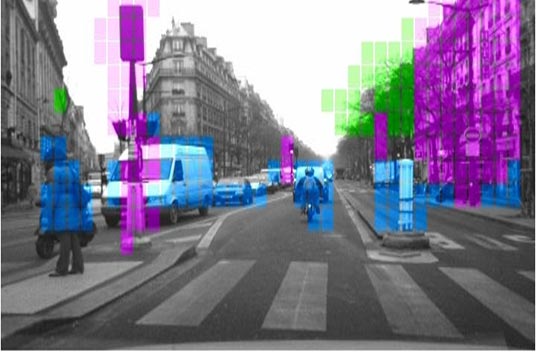
In figure 60, the SC did not reject the person on the motorcycle or the light post on the median. The image shows tall vertical structures in magenta, overhanging structures in green, and possible pedestrians in blue.
|
©INRIA (See Acknowledgements section) |
Figure 60. Photo. SC rejecting poles.
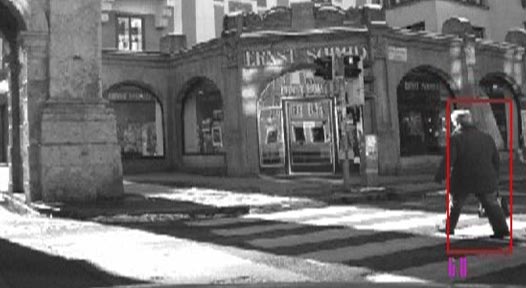
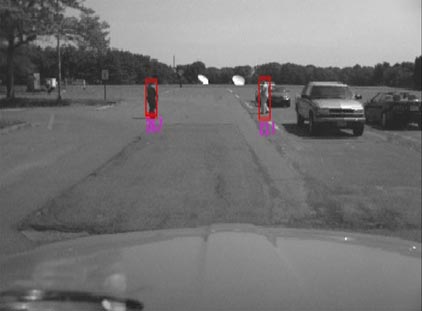
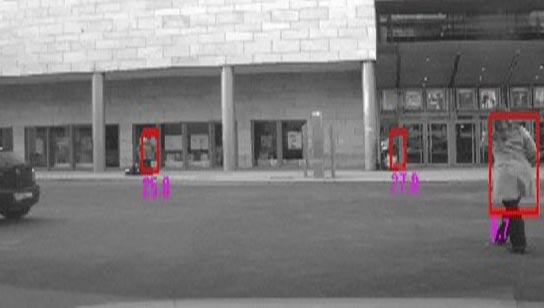
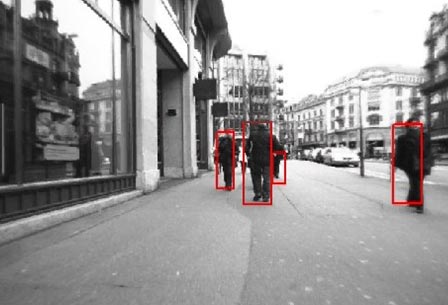
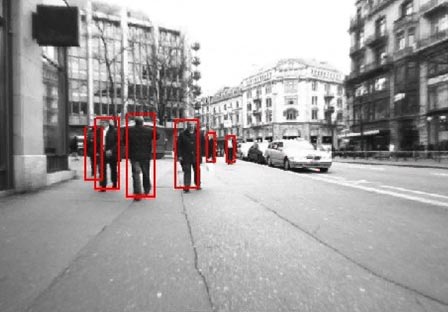
Figure 61 through figure 65 show pedestrians detected by the appearance classifier, which are shown by the red boxes.
|
©INRIA (See Acknowledgements section) |
Figure 61. Photo. Appearance classifier recognizing a pedestrian.(12)
|
©INRIA (See Acknowledgements section) |
Figure 62. Photo. Appearance classifier output recognizing pedestrians crossing in front of vehicles.
|
©INRIA (See Acknowledgements section) |
Figure 63. Photo. Appearance classifier output recognizing pedestrians while making a left turn.
|
©INRIA (See Acknowledgements section) |
Figure 64. Photo. Appearance classifier recognizing pedestrians in front of a vehicle in a busy urban street.
|
©INRIA (See Acknowledgements section) |
Figure 65. Photo. Appearance classifier recognizing pedestrians 98.4 ft (30 m) ahead of a vehicle in a busy street.