U.S. Department of Transportation
Federal Highway Administration
1200 New Jersey Avenue, SE
Washington, DC 20590
202-366-4000
Federal Highway Administration Research and Technology
Coordinating, Developing, and Delivering Highway Transportation Innovations
| REPORT |
| This report is an archived publication and may contain dated technical, contact, and link information |
|
| Publication Number: FHWA-HRT-11-056 Date: October 2012 |
Publication Number: FHWA-HRT-11-056 Date: October 2012 |
This appendix describes the user interface that was developed for the real-time layered object recognition system for pedestrian collision sensing software system.
The graphic user interface (GUI) consists of a main page in which subsequent modules can be customized and run. For each of these modules (i.e., PD, classification, etc.), tab pages are defined, which can be subsequently customized if users click the respective tab. A screenshot of the main page is shown in figure 66. It is the first interface that users see when operating the system.
 system for pedestrian detection (PD) and classification.")
Figure 66. Screenshot. Main screen of the GUI for PD and classification.
This appendix illustrates each of the options through captured screenshots. The two key properties exposed by GUI are controls for the stereo-based detection system and controls for PC. The controls for the stereo-based detection system help find ROIs in an input image. The controls for PC help prune the detections and reduce the number of false pedestrians returned by the system. The arrow in figure 67 indicates the selection option to display all of the pedestrian candidates detected by the system prior to classification.
 interface. There is a cursor arrow that indicates the selection option to display all the pedestrian candidates detected by the system prior to classification.")
Figure 67. Screenshot. PD interface—display all detected pedestrian candidates.
Figure 68 shows the PCS-Ped tab of the GUI interface. The arrow indicates the selection option to display all pedestrian candidates 82 ft (25 m) away from the vehicle detected by the system prior to classification.
 interface. There is a cursor arrow that indicates the selection option to display all the pedestrian candidates 82 ft (25 m) away from the vehicle detected by the system prior to classification.")
Figure 68. Screenshot. PD interface—PCS-Ped tab with option selected to display detected pedestrians.
Figure 69 also shows the PCS-Ped tab within the GUI interface. The arrow indicates the selection option to display the horizon line estimated by the system. This option is a byproduct of the ground plane estimator.
 interface. There is a cursor arrow that indicates the selection option to display the horizon line estimated by the system. This option is a byproduct of the ground plane estimator.")
Figure 69. Screenshot. PD interface—PCS-Ped tab with option selected to display horizon line estimated by the system.
Figure 70 shows the PCS-Ped tab of the GUI interface. The arrow indicates the selection option to display the SC output.
 interface. There is a cursor arrow that indicates the selection option to display the output of the structure classifier (SC).")
Figure 70. Screenshot. PD interface—PCS-Ped tab with option selected to display the SC output.
Figure 71 shows the PCS-Ped tab of the GUI interface. The arrow indicates the selection option to display an intermediate VSH output of SC.
 interface. There is a cursor arrow that indicates the selection option to display an intermediate vertical support histogram (VSH) output of the structure classifier (SC).")
Figure 71. Screenshot. PD interface—PCS-Ped tab with option selected to display an intermediate VSH output of SC.
Figure 72 shows the PCS-Ped tab of the GUI interface. The arrow indicates the selection option to display the depth/disparity map generated by the stereo algorithm.
 interface. There is a cursor arrow that indicates the selection option to display the depth/disparity map generated by the stereo algorithm.")
Figure 72. Screenshot. PD interface—PCS-Ped tab with option selected to display depth/disparity map.
Figure 73 shows the PCS-Ped tab of the GUI interface. The arrow indicates the selection option to capture stereo data for temporary storage in the personal computer.
 interface. There is a cursor arrow that indicates the selection option to capture stereo data for temporary storage in the personal computer.")
Figure 73. Screenshot. PD interface—PCS-Ped tab with option selected to capture stereo data for temporary storage.
Figure 74 shows the PCS-Ped tab of the GUI interface. The arrow indicates the selection option to cancel saving of stereo data and clear the temporary store in the personal computer.
 interface. There is a cursor arrow that indicates the selection option to cancel saving of stereo data and clear the temporary store in the personal computer.")
Figure 74. Screenshot. PD interface—PCS-Ped tab with option selected to cancel saving of stereo data and clear temporary store.
Figure 75 shows the PCS-Ped tab of the GUI interface. The arrow indicates the selection option to stop capture and store the captured stereo data to permanent storage on the disk.
 interface. There is a cursor arrow that indicates the selection option to stop capture and store captured stereo data to permanent storage on a disk.")
Figure 75. Screenshot. PD interface—PCS-Ped tab with option selected to stop capture and store captured stereo data to permanent storage.
Figure 76 shows the PCS-Ped tab of the GUI interface. The arrow indicates the selection option to automatically divert data to a file on disk whenever a pedestrian is detected.
 interface. There is a cursor arrow that indicates the selection option to automatically divert data to a file on disk whenever a pedestrian is detected.")
Figure 76. Screenshot. PD interface—PCS-Ped tab with option to automatically divert data to a file whenever a pedestrian is detected.
Figure 77 shows the PCS-Ped tab of the GUI interface. The arrow indicates the selection option to define the maximum number of frames that are maintained in temporary storage during the automatic divert of data to disk.
 interface. There is a cursor arrow that indicates the selection option to define the maximum number of frames that are maintained in temporary storage during the automatic divert of data to disk.")
Figure 77. Screenshot. PD interface—PCS-Ped tab with option selected to define maximum number of frames maintained in temporary storage during automatic divert of data.
Figure 78 shows the PCS-Ped tab of the GUI interface. The arrow indicates the selection option that specifies the number of additional video frames saved to disk after “Stop” is selected during data storage to the disk.
 interface. There is a cursor arrow that indicates the selection option that specifies the number of additional video frames saves to disk after “Stop” is selected during data storage to the disk.")
Figure 78. Screenshot. PD interface—PCS-Ped tab with option selected that specifies number of additional video frames saved to disk.
Figure 79 shows the PCS-Ped tab of the GUI interface. The arrow indicates the selection option that specifies whether the PD algorithms should operate while data are being stored to the disk.
 interface. There is a cursor arrow that indicates the selection option that specifies whether the PD algorithms should operate while data are being stored to disk.")
Figure 79. Screenshot. PD interface—PCS-Ped tab with option selected that specifies
whether PD algorithms should operate while data being stored.
Figure 80 shows the PCS-Ped tab of the GUI interface. The arrow indicates the selection option that enables the PD algorithm to run in the live system.
 interface. There is a cursor arrow that indicates the selection option that enables the PD algorithm to run in the live system.")
Figure 80. Screenshot. PD interface—PCS-Ped tab with option selected that enables PD algorithm to run in live system.
Figure 81 shows the PCS-Ped tab of the GUI interface. The arrow indicates the selection option that enables the PD algorithm to split wide object detections into multiple pedestrian candidates. This is turned on by default and used to resolve detections within groups of pedestrians observed together by the cameras.
 interface. There is a cursor arrow that indicates the selection option that enables the PD algorithm to split wide object detections into multiple pedestrian candidates. This is turned on by default and is used to resolve detections within groups of pedestrians observed together by the cameras.")
Figure 81. Screenshot. PD interface—PCS-Ped tab with option selected that enables PD algorithm to split wide object detections into multiple pedestrian candidates.
Figure 82 shows the PCS-Ped tab of the GUI interface. The arrow indicates the selection option that enables the PD algorithm to refine the horizontal placement of the initial detection box using depth and edge data.
 interface. There is a cursor arrow that indicates the selection option that enables the PD algorithm to refine the horizontal placement of the initial detection box using depth and edge data.")
Figure 82. Screenshot. PD interface—PCS-Ped tab with option selected that enables PD algorithm to refine horizontal placement of initial detection box.
Figure 83 shows the PCS-Ped tab of the GUI interface. The arrow indicates the selection option that enables the PD algorithm to refine the vertical placement of the initial detection box using depth and edge data.
 interface. There is a cursor arrow that indicates the selection option that enables the PD algorithm to refine the vertical placement of the initial detection box using depth and edge data.")
Figure 83. Screenshot. PD interface—PCS-Ped tab with option selected that enables PD algorithm to refine vertical placement of initial detection box.
Figure 84 shows the PCS-Ped tab of the GUI interface. The arrow indicates the selection option that enables the PD algorithm to use the ground plane estimate to better locate the foot location of a detected pedestrian candidate.
 interface. There is a cursor arrow that indicates the selection option that enables the PD algorithm to use the ground plane estimate to better locate the foot location of a detected pedestrian candidate.")
Figure 84. Screenshot. PD interface—PCS-Ped tab with option selected that enables PD algorithm to use ground plane estimate to better locate pedestrians.
Figure 85 shows the PCS-Ped tab of the GUI interface. The arrow indicates the selection option that enables the PD algorithm to maintain a fixed aspect ratio when detection boxes are refined.
 interface. There is a cursor arrow that indicates the selection option that enables the PD algorithm to maintain a fixed aspect ratio when detection boxes are refined.")
Figure 85. Screenshot. PD interface—PCS-Ped tab with option selected that enables PD algorithm to maintain a fixed aspect ratio when detection boxes are refined.
Figure 86 shows the PCS-Ped tab of the GUI interface. The arrow indicates the selection option that enables the PD algorithm to use image edge information to reject FPs.
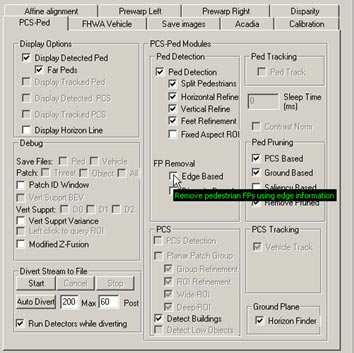
Figure 86. Screenshot. PD interface—PCS-Ped tab with option selected that enables PD algorithm to use image edge information to reject FPs.
Figure 87 shows the PCS-Ped tab of the GUI interface. The arrow indicates the selection option that enables the PD algorithm to use image depth information to reject FPs.
 interface. There is a cursor arrow that indicates the selection option that enables the algorithm to use image depth information to reject false positives (FPs).")
Figure 87. Screenshot. PD interface—PCS-Ped tab with option selected that enables PD algorithm to use image depth information to reject FPs.
Figure 88 shows the PCS-Ped tab of the GUI interface. The arrow indicates the selection option that enables the algorithm to use the SC algorithm to detect tall vertical structures (i.e., buildings, trees, and poles).
 interface. There is a cursor arrow that indicates the selection option that enables the PD algorithm to use the structure classifier (SC) algorithm to detect tall vertical structure (i.e., buildings, trees, and poles).")
Figure 88. Screenshot. PD interface—PCS-Ped tab with option selected that enables PD algorithm to use SC algorithm to detect tall vertical structures.
Figure 89 shows the PCS-Ped tab of the GUI interface. The arrow indicates the selection option that enables the PD algorithm to reject FPs as indicated by the SC algorithm.
 interface. There is a cursor arrow that indicates the selection option that enables the PD algorithm to reject false positives (FPs) as indicated by the structure classifier (SC) algorithm.")
Figure 89. Screenshot. PD interface—PCS-Ped tab with option selected that enables PD algorithm to reject FPs as indicated by SC algorithm.
Figure 90 shows the PCS-Ped tab of the GUI interface. The arrow indicates the selection option that enables the PD algorithm to use ground plane and horizon information to reject FPs.
 interface. There is a cursor arrow that indicates the selection option that enables the PD algorithm to use ground plane and horizon information to reject false positives (FPs).")
Figure 90. Screenshot. PD interface—PCS-Ped tab with option selected that enables PD algorithm to use ground plane and horizon information to reject FPs.
Figure 91 shows the PCS-Ped tab of the GUI interface. The arrow indicates the selection option that enables the PD algorithm to use image saliency information to reject FPs.
 interface. There is a cursor arrow that indicates the selection option that enables the PD algorithm to use image saliency information to reject false positives (FPs).")
Figure 91. Screenshot. PD interface—PCS-Ped tab with option selected that enables PD algorithm to use image saliency information to reject FPs.
Figure 92 shows the PCS-Ped tab of the GUI interface. The arrow indicates the selection option that enables the PD algorithm to reject FPs detected by the three previous rejection algorithms.
 interface. There is a cursor arrow that indicates the selection option that enables the PD algorithm to reject false positives (FPs) detected by the three previous rejection algorithms.")
Figure 92. Screenshot. PD interface—PCS-Ped tab with option selected that enables PD algorithm to reject FPs detected by three previous rejection algorithms.
Figure 93 shows the PCS-Ped tab of the GUI interface. The arrow indicates the selection option that enables the PD algorithm to compute the ground plane in the scene. It is used for ground-based FP rejection.
 interface. There is a cursor arrow that indicates the selection option that enables the PD algorithm that computes the ground plane in the scene. It is used for ground-based false positive rejection.")
Figure 93. Screenshot. PD interface—PCS-Ped tab with option selected that enables PD algorithm to compute the ground plane in the scene.
Figure 94 through figure 105 show the PC interface. The circled boxes indicate the options that specify the classifier search range around a detection box. It is computed by multiplying the box width and height by the ratios.
 interface. There are circled boxes that indicate the options that specify the classifier search range around a detection box. It is computed by multiplying the box width and height by the ratios.")
Figure 94. Screenshot. PC interface specifying search range for each ROI in the X and Y directions.
The circled boxes in figure 95 indicate the following selection options: (1) enable scale search, (2) minimum scale, (3) maximum scale, and (4) number of scales to search.
 interface. There are circled boxes that indicate the following selection options: (1) enable scale search, (2) minimum scale, (3) maximum scale, (4) number of scales to search.")
Figure 95. Screenshot. PC interface showing scale evaluation parameters.
The circled boxes in figure 96 indicate the following selection options: (1) classifier search step size in pixels and (2) classifier mode. The classifier mode option is not used in the developed system.
 interface. There are circled boxes that indicate the following selection options: (1) classifier search step size in pixels and (2) classifier mode.")
Figure 96. Screenshot. PC interface showing specifications at ROI classification.
The circled boxes in figure 97 indicate legacy classifier parameters that are used for debugging.
 interface. There are circled boxes that indicate legacy classifier parameters that are used for debugging.")
Figure 97. Screenshot. PC interface indicating legacy parameters for debugging.
The circled boxes in figure 98 indicate the selection options where the operator can specify the size of the window padding around a detection box. This is used to create a larger classifier ROI.
 interface. There are circled boxes that indicate the selection options where the operator can specify the size of window padding around a detection box. This is used to create a larger classifier region of interest.")
Figure 98. Screenshot. PC interface specifying size of padding around a detection box.
The circled options in figure 99 indicate the following filter operations: (1) limit pedestrian detection to 98.4 ft (30 m), (2) use contour-based ROI refinement, (3) use chamfer score-based filter, and (4) use texture filter. Note that (3) and (4) use additional filters for FP rejections.
 interface. There are circled options that indicate the following filtering options: (1) limit pedestrian detection to 98.4 ft (30 m), (2) use contour-based region of interest refinement, (3) use chamfer score-based filter, and (4) use additional filters for false positive ejection.")
Figure 99. Screenshot. PC interface showing filter options.
The circled options in figure 100 indicate the selection options for image enhancement prior to classification. The four options include (1) histogram equalization, (2) histogram stretch, (3) contrast normalization, and (4) no operation.
 interface. There are circled options that indicate selection options for image enhancement prior to classification. The options include the following: (1) histogram equalization, (2) histogram stretch, (3) contrast normalization, and (4) no operation.")
Figure 100. Screenshot. PC interface showing selection options for image enhancement prior to classification.
The circled options in figure 101 indicate selection options for classifier output display. The options are as follows: (1) show display window, (2) show distance, (3) show ID, (4) show overlay detection with classification boxes, (5) show detection boxes, and (6) show classified pedestrians.
 interface. There are circled options that indicate selection options for classifier output display. The options are as follows: (1) show display window, (2) show distance, (3) show ID, (4) show overlay detection with classification boxes, (5) show detection boxes, and (6) show classified pedestrians.")
Figure 101. Screenshot. PC interface showing options for classifier output display.
The circled options in figure 102 indicate the selection options to run the PC and a post-processing SVM classifier for bush rejection.
 interface. There are circled options that indicate selection options to run the pedestrian classifier and a post-processing support vector machine (SVM) classifier for bush rejection.")
Figure 102. Screenshot. PC interface showing selection options to run PC and a
post-processing SVM classifier for bush rejection.
The circled options in figure 103 indicate options to select a HOG AdaBoost classifier (Boost) or a contour plus HOG AdaBoost classifier (VS + Boost).
 interface. There are circled options that indicate options to select a histogram of oriented gradient (HOG) AdaBoost classifier (Boost) or a contour plus HOG AdaBoost classifier (vertical support (VS) + Boost).")
Figure 103. Screenshot. PC interface showing options to select a HOG AdaBoost classifier or contour plus HOG AdaBoost classifier.
The boxes circled in figure 104 indicate the selection options used to decide the distance ranges at which the contour + HOG classifier (0 to 32.8 ft (0 to 10 m)) and the basic HOG classifiers (32.8 to 65.6 ft (10 to 20 m) and over 65.6 ft (20 m)) are used.
 interface. There are circled boxes that indicate the selection options to decide the distance ranges at which the contour + histogram of oriented gradient (HOG) classifier (0 to 32.8 ft (0 to 10 m)) and the basic HOG classifiers (32.8 to 65.6 ft (10 to 20 m) and over 65.6 ft (20 m)) are used.")
Figure 104. Screenshot. PC interface showing selection options to decide distance ranges for three classifiers.
The circled options in figure 105 indicate the following classifier debugging options: (1) save detected image patches to a file, (2) save the current image with detection boxes, and (3) save detection statistics to a file.
 interface. There are circled options that indicate the following classifier debugging options: (1) save detected image patches to a file, (2) save the current image with detection boxes, and (3) save detection statistics to a file.")
Figure 105. Screenshot. PC interface showing classifier debugging options.
The options circled in figure 106 indicate the following tracker interface options: (1) enable the tracker, (2) apply a heuristic that looks for consistent defects in three out of five frames, (3) show debugging labels for the tracker, and (4) enable the egomotion estimator.
 interface tracker options. There are circled options that indicate the following tracker options: (1) enable the tracker; (2) apply a heuristic that looks for consistent defects in three out of five frames, (3) show debugging labels for the tracker, and (4) enable the egomotion estimator.")
Figure 106. Screenshot. PC interface showing tracker options.
The boxes circled in figure 107 show the following classifier threshold options: (1) multiplier for the classifier threshold (large value suppresses detection), (2) edge detect threshold, (3) HOG feature threshold, and (4) threshold for chamfer filter.
 interface. The circled boxes show the following classifier threshold options: (1) multiplier for the classifier threshold (large value suppresses detection), (2) edge detect threshold, (3) histogram of oriented gradient feature threshold, and (4) threshold for chamfer filter.")
Figure 107. Screenshot. PC interface showing classifier threshold options.
The boxes circled in figure 108 indicate the options to set the tracker search range as a multiplier to the detection box position in the X and Y directions.

Figure 108. Screenshot. Pedestrian tracker interface showing options to set tracker search range.
The options circled in figure 109 indicate the following options: (1) reset the tracker, (2) display the tracker window, and (3) display the tracked patches for debugging purposes.
 reset the tracker, (2) display the tracker window, and (3) display the tracked patches for debugging purposes.")
Figure 109. Screenshot. Pedestrian tracker interface showing tracker options.

