
A large amount of data will be generated in a variety of forms during the completion of the studies conducted under this Protocol. A comprehensive Data Management Plan must be implemented during each study to ensure that the data collected are properly maintained and accurate. This Data Management Plan should provide a process by which a documentation trail is established for all data generated during each study, including all mathematical operations and analyses performed on raw or processed data. Any procedures involving data collection or manipulation (i.e., data recording, validation, transformation, transmittal, reduction, analysis, management, storage) should be addressed in the Data Management Plan. The Plan should include internal verification and validation checks that will be used to ensure data quality. The Data Management Plan should be incorporated into the study-specific QAPP for each study conducted under this Protocol.
The data generated during each study must be reviewed and validated in a timely fashion. Data validation must take place at various stages in the development of the final ambient air concentration data. In the field, those responsible for collection of the samples and the shipment of the samples to the respective analytical laboratories must ensure that appropriate documentation is being maintained, including completed chain of custody (COC) forms and sample collection records. The site operators should periodically contact laboratory support staff to ensure that valid samples are being collected and that the completeness goals for the monitoring study are being met. Site operators should also be responsible for validation and review of data from the gas analyzers, continuous aerosol monitors, and meteorological sensors.
Validation of data generated in the laboratory, including review, is primarily a function of the laboratory staff. Data validation should include the review of results from QC activities including daily calibration samples, ongoing precision and recovery samples, as well as system and field blank samples. Review of these data will allow the technical staff to determine whether established acceptance specifications are being met. If acceptance criteria are not being met, appropriate corrective actions can be undertaken to resolve problems that may exist.
It is recommended that data generated during each study be reviewed by a technical staff member at least within 2 weeks of generation of the data. The reviewer should be familiar with the technical aspects of the monitoring. This process will serve both as the data review and the data verification, and will ensure that the data have been recorded, transmitted, and processed properly.
All of the field and laboratory data should be validated by a data reviewer prior to assembly of periodic reports of sample results. An independent staff member familiar with quality assurance procedures should conduct a final data review on a predetermined percentage of the data (e.g., at least 10%). The final evaluation and validation of the data must compare the QC results directly to the measurement quality objectives developed for the project.
The data analyses recommended below focus on the most basic issues of roadway emission impacts:
Additional data analyses are suggested that may address additional questions such as the respective impacts of meteorological conditions, traffic volume, vehicle type, etc.
This section discusses how the data collected during each monitoring study are to be analyzed and describes statistical approaches to be used on those data. The data of interest include PM2.5, MSAT, and surrogate species concentrations, meteorological data, and traffic data. The latter three types of data are to be monitored continuously and for the subsequent discussion are assumed to be aggregated to one-hour average or integrated data.
Given the complexity of the data set, multivariate analysis approaches using statistical analysis software such as SAS may be necessary to assess the impact of various parameters of interest on the pollutant dispersion. However, emphasis must be placed on reporting clear and understandable results from the statistical analysis. The field studies are being conducted to understand the relation of mobile source emissions to key air contaminants. Since this issue is of public interest, the agencies interested in the study results will require relatively simple findings that can be explained to a wide audience. At a minimum, the data should be analyzed to determine if there is a statistically significant difference between the pollutant concentration measured at each site and the background concentration. The following calculations should be conducted for each monitoring study.
For each site, the hourly, daily, monthly, quarterly, and annual average concentrations for each MSAT and surrogate species should be calculated. Because the objective of the monitoring study is characterization of the dispersion of the MSAT and surrogate species from the road, these calculations should be conducted using only those data collected during periods when the average wind direction would result in dispersion of the roadway pollutants in the direction of the monitoring stations. Consequently, the average wind direction during each sampling period should be determined, and periods during which the average wind direction was not within an arc of suitable size (e.g.,120o) centered on a line perpendicular to the road in the direction of the monitoring stations should be excluded from this statistical evaluation. The size of that acceptable arc of wind direction should be chosen based on the geometry, roadway dimensions, and presence of obstacles in each study location, however it is recommended that an arc of approximately 120° is a reasonable maximum arc size for most study locations. An example of a suitable arc is illustrated in Figure 7-1, showing acceptable wind directions (a), and unacceptable wind directions (b). In general, only those wind directions that fall within the 120° arc shown in this figure (i.e., from the road) should be accepted for determination of the pollutant dispersion. Consequently, data collected during periods when the winds were outside the 120° arc (i.e., toward the road and parallel to the road) should not be included in the determination of the pollutant dispersion. Data excluded these calculations should remain available for alternate calculations that may be conducted at a later time.
Once the data have been evaluated based on wind direction, the mean and peak concentrations for each MSAT and surrogate species should be determined for each sampling period. In determining the mean concentrations, one half the detection limit should be used for those sample analyses resulting in non detectable concentrations. Although the mean concentration values will be used to determine pollutant dispersion, the peak concentration should be determined to illustrate the "worst case" conditions that were encountered during the study period. The standard deviations should also be calculated and reported to illustrate the variability of the concentrations.
Time sequence plots should be generated to illustrate the temporal patterns (both diurnal and seasonal) in pollutant concentrations during the study period. Appropriate meteorological parameters (e.g., temperature, solar radiation, etc.) or traffic related parameters (e.g., traffic count, vehicle mix, etc.) may be included on these time sequence plots to help illustrate any apparent metrological or traffic dependence on pollutant concentrations. For example, Figure 7-2 is a time sequence plot showing an illustration of the variation in traffic patterns and changes in pollutant concentration over the course of a 24-hour period. Monthly, quarterly, and annual wind roses should also be generated to illustrate the prevailing wind direction during the study period.
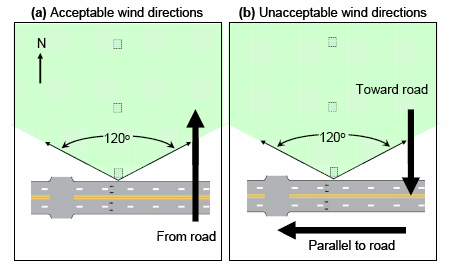
Figure 8. Example of acceptable and unacceptable wind directions.
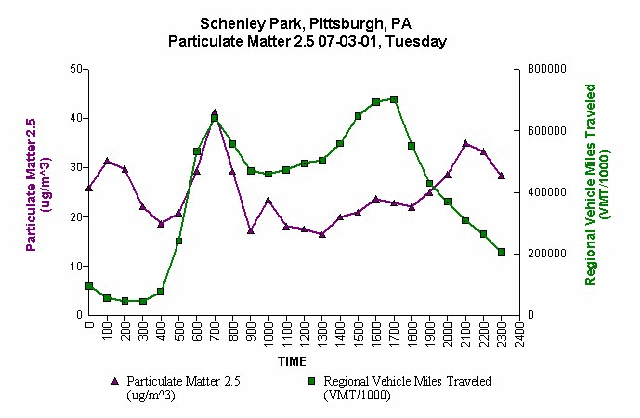
Figure 9. Example of Diurnal Variations in Traffic Patterns and Pollutant Concentrations.
The average concentration of MSATs or surrogate compounds in each of the 24 hours of the day (e.g., 1:00 - 2:00 am, 2:00 - 3:00 am, etc.) should be calculated over extended time periods, to evaluate the respective diurnal concentration pattern of each species at each site. The average concentration over a single hour of the day will simply be the mean of the results from all samples collected during that hour. For example, for the continuously monitored surrogate chemicals, if calculated for an entire year of sampling, the average within each hour of the day will be based on up to 365 hourly values recorded for that hour of the day over the course of a year. On the other hand, hourly values for the MSATs will be based on relatively fewer data points, because of the 1-in-12-day and 9-samples-per-day schedule (see Section 2.1). Specifically, when averaging over one year, the hourly average for the peak hour in the morning traffic period will be based on at most 30 samples, the hourly average of the hour preceding and the hour following that peak hour will be based on at most 15 samples, and the average for all other hours of the day will be based on 10 samples. These differences in the number of data points must be kept in mind if comparisons are made between average concentrations at different times of day. For all measured species, the number of samples available for calculation of hourly averages will be proportionally reduced if calculations address shorter time periods (e.g., quarterly, monthly), but such calculations may still be useful if marked seasonal changes in measured concentrations are observed.
The average concentrations of surrogate and MSAT species over each sampling day may be calculated both before and after removal of data based on the wind direction sector, though the procedures used are different for these species.
For the continuously monitored species, the daily average measured concentration ideally is just the average of 24 hourly data points over the day. However, even if all valid data are included in the average (i.e., the data are not screened by wind direction) the number of valid data points may still be less than 24, due (e.g. due to calibration periods, instrument malfunction, data loss, etc.). In such cases, substitution for the missing data may be made based on reasonable assumptions, or the average may be calculated based on less than 24 hourly values if the number of data points is noted. A reasonable basis for substitution may be that the missing data are in a stable or low concentration regime, as in overnight hours, and thus a neighboring hourly value may be substituted, or that the diurnal pattern in the study location is reproducible and thus a long-term hourly average (see above) may be substituted for the missing value. Such substitution approaches may be implemented based on the observed characteristics of the data from a study location.
Calculation of daily averages from continuously monitored data screened to exclude unwanted wind directions should be conducted with care if the number of remaining data points in a day is relatively small, or if peak traffic periods are under-represented among the remaining hours. As an example general recommendation, a daily average should not be calculated if fewer than 16 hours of data are available for the 24-hour period, or if fewer than 10 hours of data are available from the 6 a.m. to 7 p.m. time period. Any daily averages calculated from incomplete continuous monitoring data should be so indicated.
Calculation of daily averages for MSATs necessarily involves at most nine samples, due to the selected sampling schedule. Furthermore, because of the rotating of sample times from one sampling day to the next, a weighting procedure is recommended that treats each collected sample as representing part of a three-hour section of the day. Specifically, the three-hour morning rush hour period is represented both by the peak hourly sample, and by the sample taken either immediately before or immediately after that peak hour. All other three-hour periods are represented by the one hourly sample taken in that period. As a result, the calculation of daily average MSAT concentrations should be done as follows:
Equation 3
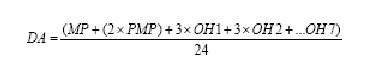
where DA is the MSAT daily average, MP is the hourly value from the morning peak traffic time, PMP is the value from the hour immediately pre- or post-MP, and OH1 through OH7 are the other hourly samples collected the rest of the day. This approach implicitly assumes that the hourly concentration immediately before the morning peak is equivalent to that immediately after, i.e., that the two "shoulders" of the morning peak are equal. In the event that fewer than nine samples per day are available, the calculation should be carried out with the available data, but not with less than seven samples per day, and not unless both the MP and PMP samples are available. Substitution for missing values may be considered, as described above for the continuous data, but should be used with caution due to the relatively smaller number of data points obtained for the MSATs.
Averages for MSATs, surrogate species, and other measured parameters may be calculated for longer time periods, such as monthly, quarterly, or annually, based on the data compiled in those time periods. Such averages calculated from all valid data are most applicable to characterization of the study location, estimation of local exposures, and evaluation of seasonal differences in air pollutant levels from all sources in the area. The same averages calculated from data screened by wind direction are most suitable for evaluating the impact of roadway emissions on exposures, and seasonal differences in roadway impact. In comparing longer term averages, the difference between the number of measurements underlying averages for continuously monitored species and the MSATs must be kept in mind.
For assessing the spatial scale and concentration impact of roadway emissions, the primary measured response for statistical evaluation will be the mean measured pollutant levels for each roadside location minus the mean level for the same time period at the background location. This calculation should be conducted only with those data collected during periods when the average wind direction would result in dispersion of the roadway pollutants in the direction of the monitoring stations. Consequently, the average wind direction during each sampling period should be determined, and as described above, periods during which the average wind direction was not within an acceptable arc of centered on a line perpendicular to the road in the direction of the monitoring stations should be excluded from this statistical evaluation. Once the data have been evaluated based on wind direction, the averaged difference should be calculated for the subject period, according to Equation 7-2:
Equation 4
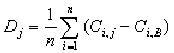
where Dj is the average concentration difference of a given MSAT, at monitoring site j, Ci,j and Ci,B are the concentrations of the MSAT during sampling period i, at monitoring site j and the background monitoring site, respectively. This calculation may be applied to any subset of the data, e.g., a single day, all data from a single time period on multiple days, or all data from an extended time period.
The three sets of differences (0 m vs. background, 150 m vs. background, and 300 m vs. background) for each MSAT should then be fit to Analysis of Variance (ANOVA) models. Model diagnostics should be examined to assess if there are any issues associated with outliers or the model assumptions of constant variance and normality of the residuals. If the data are not found to be adequate for the model, appropriate transformations or more general statistical models (e.g., nonparametric) should be considered. Once final statistical models have been fit, comparisons should be performed for each of the mean differences compared to zero, controlling the possible error rate at 5%. From this analysis, it is possible to assess whether statistically significant differences exist between pollutant concentrations at each site as compared to the background site.
This evaluation will be the primary comparison used to address the first two issues bulleted under Section 7.2 above. The extent to which MSAT and other vehicle-related pollutant concentrations exceed background levels will be determined by the individual and overall concentration differences relative to the background site. The spatial scale of roadway impact will be assessed based on the reduced exceedances of background concentrations at sites more distant from the roadway.
An extension of this analysis can be used to assess diurnal, day-of-the-week, or seasonal patterns in MSAT concentrations and dispersion by evaluating the corresponding temporal data sets.
The study design calls for the continuous measurement of surrogate species with the expectation that measured concentrations of these surrogates are correlated with concentrations of the measured MSATs. To assess whether this expectation is correct, the average concentrations should be calculated for the surrogate species for each of the time periods corresponding to each of the MSAT sampling times (i.e., each one-hour sampling period). A regression analysis should then be conducted to assess the correlation between the one-hour average concentrations for the MSATs and the corresponding average concentrations for the surrogates at each monitoring site. A strong correlation between concentration levels of MSATs and surrogates will also imply that the average concentration differences between each monitoring site and the background will also be highly correlated for MSATs and the surrogates.
A strong correlation supports the use of surrogates in additional analysis of the collected surrogate data. Equation 7-3 shows a regression model that could be used to determine the strength of the relationships between the relative concentration differences for each of the MSATs and the surrogates:
Equation 5
Yi = β0 + β1Xi1 + β2Xi2 εi
where Yi represents the concentration of an MSAT for measurement period i, Xi1 represents the surrogate concentration measurement for measurement i, and Xi2 represents the effect of the specific monitoring site. β0 is the intercept parameter, and β1 and β2 are parameters associated with surrogate concentration and monitoring site, respectively while εi represents the random error term.
By appropriate segregation of the data, this analysis can be used to assess temporal dependencies in the correlation between integrated and continuous surrogate measurements.
After determining whether significant MSAT and surrogate concentration differences exist between each of the monitoring sites and the background site, the influence of meteorological conditions and traffic patterns on the measured pollutant concentrations should be evaluated. Analyses should be performed on each of the meteorological and traffic parameters to determine their statistical significance on the pollutant concentrations. For these analyses, the collected meteorological data (e.g., temperature, humidity, etc.) and the corresponding traffic data (e.g., traffic count, vehicle classification data, etc.) should be used as parameters in a regression model with the MSAT pollution concentration as the response variable of interest. Both the meteorological data and the traffic data collected during each MSAT monitoring period should be averaged for those periods and used to assess the influence of each parameter on the corresponding pollutant concentration differences.
Equation 7-4 shows an example multivariate model that could be used to assess meteorological and traffic related influences on pollutant concentrations:
Equation 6
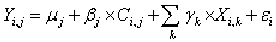
where the µj, and βjj are intercept and slope parameters specific to each monitoring site, Xi,k is the measurement of the kth meteorological or traffic parameter during the ith measurement period, the γk are the associated slope parameters, εi is error unexplained by the model, and other notation is as before.
This model should first be used to test which specific meteorological and/or traffic measurements have a statistically significant impact on pollutant concentrations. This should be done using an ANOVA within the regression model. For those factors found significant, relationships between the variables can be investigated and statements made describing the nature of this relationship between pollutant concentration and the significant factors.
If the surrogates have been shown to be suitable indicators of the MSAT concentrations, the measured surrogate concentrations can be used in this model to increase the number of measurements and enhance the statistical power of analyses.
Furthermore, this approach can be used to assess the influence of meteorological and traffic related parameters on MSAT concentrations on both a temporal and spatial basis.
Although not directly a part of the monitoring studies to be conducted under this Protocol, the Settlement Agreement calls for the development of an emission inventory from data collected during these studies. The emission inventories will be developed for baseline conditions and for two time horizons in the future - one at 10 years and one at 20 years. To undertake the emission inventory requirement, Appendix A, Section B, in the Settlement Agreement stated that emission inventories should be developed using the MOBILE6 model, and potentially, an updated version of this model referred to as the "MOVES". Appendix C of this Protocol provides supplemental information regarding the required inventories and outlines the procedures to be used to develop the inventories.

