
To view PDF files, you need the Acrobat® Reader®.
This appendix provides two examples of the study location selection process using the U.S. 95 widening project in Las Vegas, Nevada, and Interstate 25 (I-25) in Denver, Colorado. Each example location was examined for potential study sites based on the following criteria:
The following sections examine each of these criteria with respect to U.S. 95 and I-25. Text in italics represents additional evaluations that must be conducted through acquisition of more detailed data or physical evaluations.
The U.S. 95 project includes approximately 10 miles of potential study segments. Figure B-1 presents an aerial photograph of the U.S. 95 project area. As shown in this figure, the stretch of highway included in the U.S. 95 project is bounded by residential neighborhoods, commercial and industrial properties, schools, and parks.
Traffic data were obtained for the potential study locations from the Nevada Department of Transportation 2004 Annual Traffic Report. Traffic volumes as average annual daily traffic (AADT) values were obtained for eight highway segments from the U.S. 95 project. Figure B-1 presents the AADT values derived at each available segment within the U.S. 95 project. As shown in this figure, the AADT values for the U.S. 95 project range from 104,000 to 201,000 AADT. Only the segments with AADT values greater than 150,000 AADT will be considered as potential monitoring study sites.
Based on the depth of this example evaluation, only AADT data were obtained. If available, additional traffic data should be evaluated to assess variations in hourly, daily, and seasonal traffic patterns by vehicle type. Locations with large temporal variations in traffic patterns of one or more vehicle type should be considered more attractive than locations with more consistent patterns. Variations in directional flow should also be evaluated. Since the monitoring stations for these studies will likely be placed only (or predominantly) on one side of the road, large variations in directional flow may influence measured pollutant concentrations.
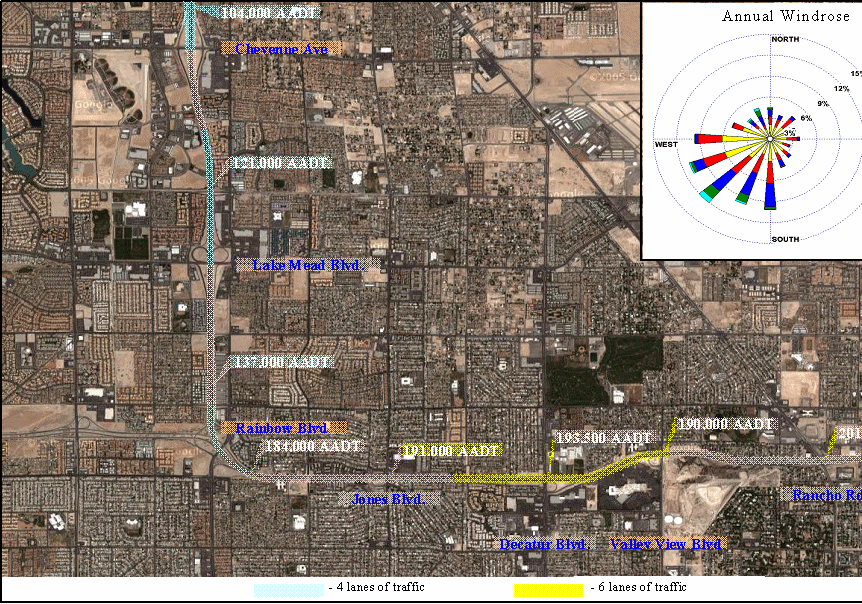
Figure 10. Overview of U.S. 95 Project Area.
The physical layout of the U.S. 95 widening project was examined to determine potential study locations. The widening project will increase the highway from six to 10 lanes from Martin Luther King Boulevard to Rainbow Boulevard, and from four to six lanes from Rainbow Boulevard to Craig Road. One lane in each direction will be dedicated as a high-occupancy vehicle (HOV) lane. As identified in Figure B 1, the current configuration of U.S. 95 includes six lanes of traffic along the east/west portion of the US95 project and four lanes of traffic along the north/south portions of the project.
A total of three ramps are located along the six lanes of traffic, as well as one underpass. At Rainbow Boulevard a large complex, multi-directional ramp is present that provides the transition from six lanes to four lanes of traffic on U.S. 95. A total of two ramps are located north of Rainbow Boulevard to Craig Road, as well as three underpasses. All of these geometric considerations must be evaluated during the selection process for potential study locations. For example, locating a study site near ramps, underpasses, or overpasses may result in impacts at the monitoring sites due to the arterial roadway associated with the ramp, underpass, or overpass.
The study location should be selected to provide relatively easy interpretation of source contributions. Study locations should not be selected for which other major sources are within one kilometer of any of the monitoring sites. Other major sources included but are not limited to:
Furthermore, it is important to have appropriate candidate locations for the installation of the monitoring stations. Placement of semi-permanent (i.e., at least 1 year) monitoring stations is likely to be feasible only on public land.
The U.S. 95 project was examined to find segments of highway located at least 300 m away from arterial roadways with greater than 25,000 AADT, large industrial operations, or combustion sources. As discussed above, the north/south section of U.S. 95 from Rainbow Boulevard to Craig Road can be excluded from the evaluation, as the traffic volume north of Rainbow Boulevard is less than 150,000 AADT.
The topography of the east/west portion of the U.S. 95 project is relatively flat with a slight down gradient slope running west to east. Figure B-2 presents a topographical map of the U.S. 95 project area. As shown in this figure, the elevation contours basically run north/south across the study area with a slope of approximately 10 feet per 250 meters. Therefore, no specific study location can be determined from the overall topography of the area, as there are no significant differences in topography along the entire east/west section of the U.S. 95 project. However, a more in-depth evaluation of roadway topography will have to be conducted to identify any segments unsuitable or better suited for inclusion in the study. For example, segments of the highway located significantly below or above ground level elevation may be excluded due to the localized dispersion characteristics associated with below grade or elevated roadways. In addition, other road-side structures, such as noise walls, large buildings, and wood lots, must be identified that could act as wind blocks or down wash structures.
This factor refers not only to the broad meteorological regime characteristic of each location, which is applicable to the Geographic Location criterion above, but also to local meteorology. The local meteorological effects are important in determining suitable study locations from the overall project area. As previously discussed, the suitable segments of the U.S. 95 project include those located along the east/west portion of U.S. 95. Therefore, the prevailing wind direction will result in dispersion of highway pollutants in the same direction for any potential study segments. The prevailing wind direction and diurnal wind patterns are critical in selecting potential sites based on locations to other pollutant sources, as discussed under the geometric considerations.
An annual windrose constructed from meteorological data collected at the Las Vegas McCarran International Airport from 1990 through 1992 is included as an inset to Figures B-1 and B-2. Figures B-3 and B-4 present seasonal windroses and diurnal windroses, respectively. As indicated in Figure B-3, the prevailing wind direction during the winter is from the west-southwest and rotates to the south-southwest during the summer months. The diurnal windroses indicate that the wind direction is predominately from the southwest during nighttime hours and is more sporadic during daytime hours with the south-southwest as the predominant daytime wind direction. In addition, the wind speeds during the nighttime hours are much lower than during daytime hours. These factors must be evaluated for each potential study location based on interferences from other pollutant sources, effects of plume dispersion interferences (i.e., buildings, wood lots, topography), and highway geometric design.
The USEPA's AirData Website provides access to air pollution data for the entire United States. Within the AirData Website, the Air Quality System (AQS) database provides air monitoring data for ambient concentrations of criteria air pollutants and HAPs at monitoring sites located in primarily urban areas. The AirData Website contains PM2.5 monitoring data collected at two monitoring stations in Las Vegas (2801 East Charleston Avenue and 2501 Sunrise Avenue). Both monitors are located approximately 4 km southeast of the US-95/I-15 interchange. The East Charleston monitoring site is located approximately 700 m south of US-95, and the Sunrise monitoring site is approximately 400 m south of US-95. The traffic volume of US-95 in this area is approximately 137,000 AADT. The traffic volume on East Charleston is approximately 32,000 AADT and the largest traffic volume on an arterial street near the Sunrise monitoring station is approximately 34,500 AADT. No ambient air monitoring data were obtained for MSATs in the Las Vegas area from the readily available monitoring data.
The 2004 annual mean PM2.5 concentrations for the East Charleston and Sunrise monitoring stations are 8.8 and 8.9 µg/m3, respectively. The 2004 maximum 24-hour PM2.5 concentrations for the East Charleston and Sunrise monitoring stations are 31 and 43 µg/m3, respectively. Due to the distances from the monitoring stations to US-95 and the amount of traffic estimated for the arterial roads adjacent to the monitors, these ambient PM2.5 concentrations should be higher than PM2.5 values measured at a background monitoring site used for this study.
Based on the annual traffic volume data, geometric layout of the U.S. 95 project area, topography, and meteorological data available for Las Vegas, potential study segments were identified and evaluated to determine the best available study location. The potential study segments were identified based on the available traffic volume data and include the following:
The Rainbow segment has the lowest traffic volume (184,000 AADT) of the potential segments. Based on review of aerial photographs, the area north of U.S. 95 includes dense residential neighborhoods and multi-family housing; the area south of U.S. 95 includes dense residential neighborhoods, multi-family housing, commercial properties, and potentially an industrial facility. East of the Rainbow segment is the north/south stretch of U.S. 95 with approximately 133,000 AADT traffic volume, as well as numerous ramps to Rainbow Blvd and East Summerlin Parkway.
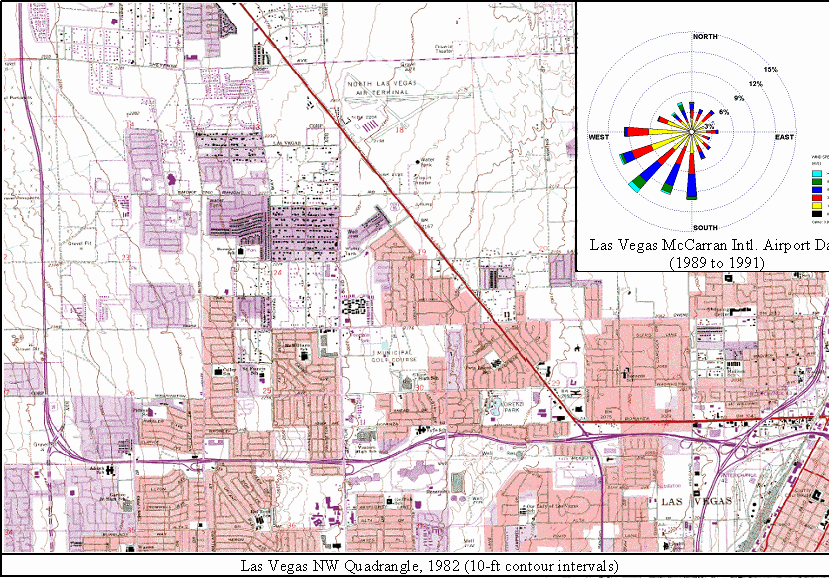
Figure 11. USGS topographical map of U.S. 95 Project Area.
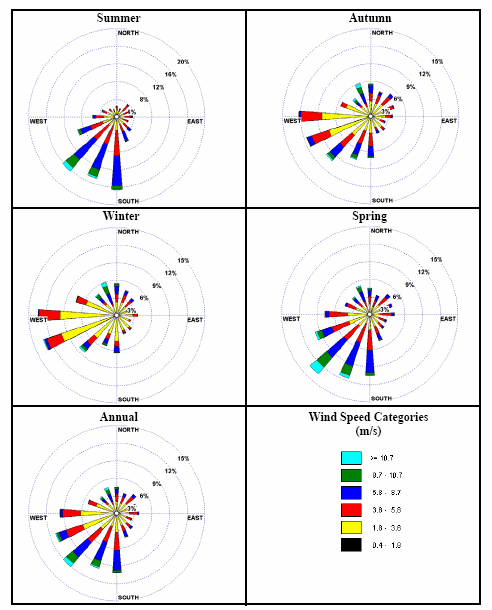
Figure 12. Seasonal and annual windroses of 1990 through 1992 Las Vegas McCarran International Airport meteorological data.
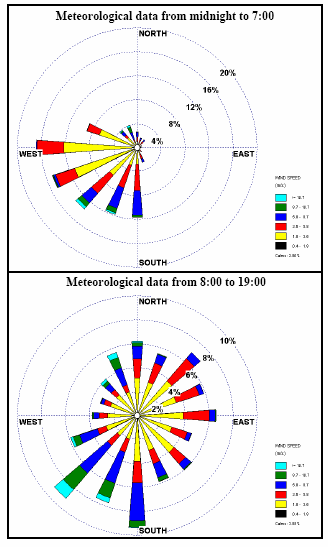
Figure 13. Diurnal windroses of 1990 through 1992 Las Vegas McCarran International Airport meteorological data.
The Jones segment has a traffic volume of 191,000 AADT. The area north and south of U.S. 95 includes predominately dense residential neighborhoods, as well as industrial or commercial facilities located north of U.S. 95 on the western edge of this segment and south of US95 on the eastern edge of the segment. A thin strip of undeveloped land is located in the center of this segment and north of U.S. 95. This area may potentially be suitable as a study location; however, locating monitors with in this thin stretch of vacant land may be difficult due to the proximately of the residential neighborhoods located east and west of this area. In addition, locating a suitable site for a background monitor approximately 1,000 m from this segment of the highway may not be possible.
The Decatur segment has a traffic volume of 193,500 AADT. The area north of U.S. 95 in this segment includes a high school, dense residential neighborhoods, and commercial properties; the area south of U.S. 95 includes a large shopping mall and a large commercial or industrial property. This segment has the greatest potential for a candidate study location due to the large open areas associated with the high school property. Located on the high school property immediately north of U.S. 95 are athletic facilities, such as tennis courts, practice fields, and baseball fields. Based on the predominate wind direction, these open areas provide for the least amount of potential interferences in comparison to the other potential segments. In addition, the east edge of the baseball fields are located more than 300 m from any potentially secondary pollutant sources, such as Decatur Blvd. and Valley View Blvd. Figure B-5 presents an aerial photograph of the Decatur segment and identifies potential monitoring sites locations. A review of the local topography for this area indicates that the elevations for these potential monitoring sites are all within 5 feet of each other (Figure B-6). The only potential interferences associated with this study location are the parking lot of the large shopping mall and the commercial or industrial property south of U.S. 95. However, the large parking lot for the shopping mall is not within the predominate wind direction of the monitoring sites and is beyond 300 m of the closest monitoring site. A more detailed evaluation would have to be conducted to determine if the commercial/industrial facilities, school parking lot, or other potential secondary emission sources could impact the monitoring locations.
Both the Valley View and Rancho segments are potential study segments with annual traffic volumes of 190,000 and 201,000 AADT, respectively. Based on review of aerial photographs of these segments, it appears that the properties adjacent to U.S. 95 in these segments contain numerous industrial facilities. A park is located within the Valley View segment north of U.S. 95; however, a dense residential neighborhood lies between the park and U.S. 95. Based on aerial photographs, a large construction project or industrial property consumes approximately 75 percent of the land south of U.S. 95 within the Valley View segment. This area within the Valley View segment should be further evaluated to determine the current land use with respect to potential secondary sources of emissions prior to excluding the segment as a potential study area.
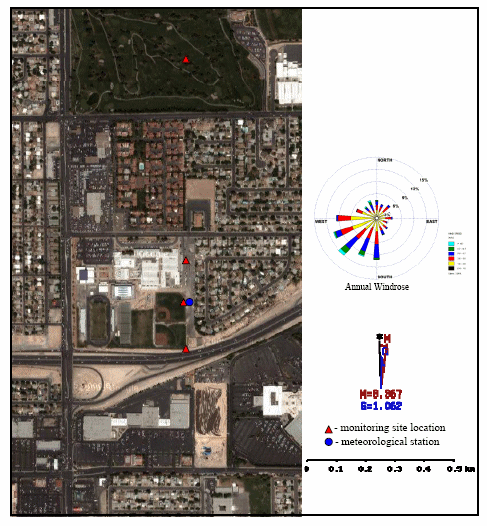
Figure 14. Aerial photograph of example monitoring site locations along U.S. 95.
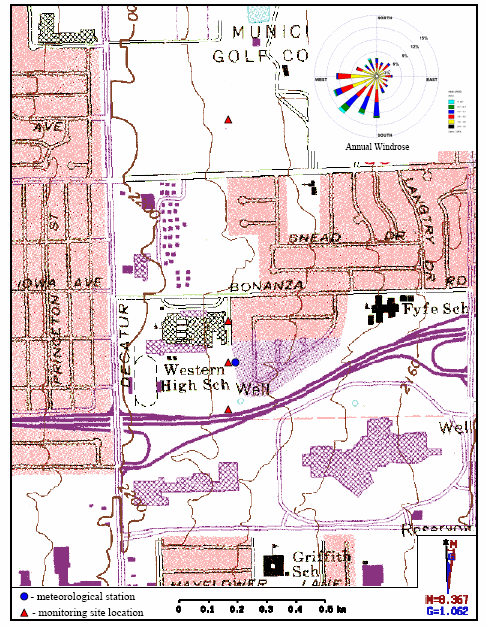
Figure 15. Local topography of example monitoring site locations along U.S. 95.
Interstate 25 (I-25) runs north to south for about 300 miles in Colorado from the Wyoming state line to the New Mexico state line. Denver's southeast corridor of I 25 provides the major travel route between two major business districts: the central business district located in the upper end of downtown Denver and the southeast business district located near the interchange of I-25 and I-225. Figure B-7 presents an overview of I 25 from SR 36 (Boulder Turnpike) south through the southeast corridor to Arapahoe Road.
Current transportation projects along I-25 in the Denver area include the Transportation Expansion Project (TREX), the Valley Highway Project, and the Downtown Multimodal Access Plan (DMAP). The TREX project began construction in 2001 and will be completed in 2006. The project is located in the southeast corridor. TREX is a multimodal project that includes widening of I-25 and a light rail line.
The Valley Highway Project includes the reconstruction of I-25 and reconfiguration of interchanges from Logan Street to 6th Avenue, 6th Avenue from I-25 to Federal Boulevard, and the Santa Fe/Kalamath/Consolidated Main Line railroad intersection. The Federal Highway Administration (FHWA) and the Colorado Department of Transportation (CDOT) are in the process of preparing an Environmental Impact Statement (EIS) for the Valley Highway Project.
The Downtown Multimodal Access Plan is a new project of the Department of Public Works. The 25-year plan will include proposals for vehicular, pedestrian, bicycle and rail access into and throughout Downtown Denver. It will also include long-term land-use planning, infrastructure and other elements that will connect downtown Denver to the adjacent communities.
Segments of I-25 in the Denver area that contain greater than 150,000 AADT include approximately 20 miles of highway located from Arapahoe Road north to SR 36 (Boulder Turnpike). These segments include an average AADT of approximately 191,000 and a range of 147,400 to 243,300 AADTs. Figure B-8 presents the 2004 AADT values for segments along I-25 between SR 36 and Arapahoe Road.
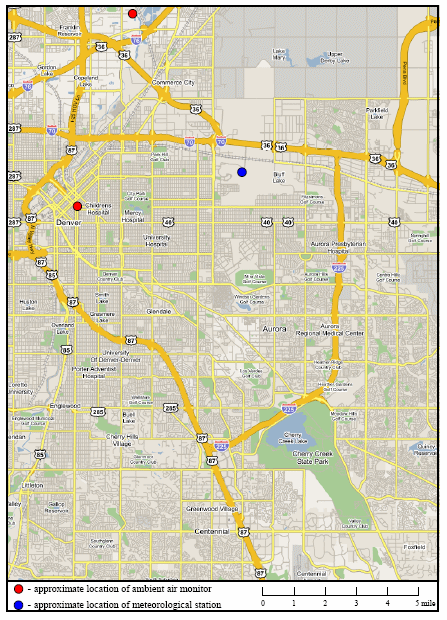
Figure 16. Overview of I-25 (SR 87) in Denver, Colorado.
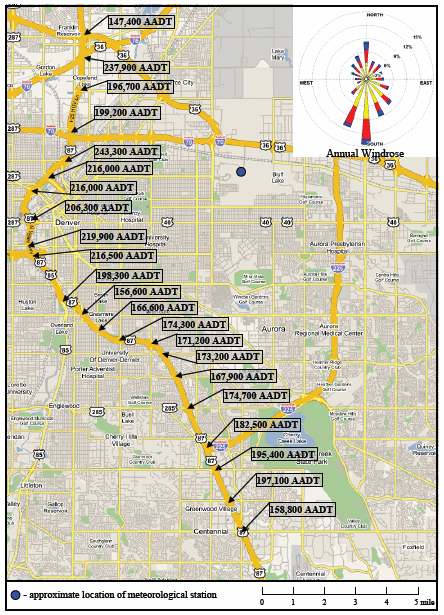
Figure 17. Map of potential study segments on I-25 in Denver, Colorado.
Based on review of aerial photographs and USGS topographic maps, the following land uses within the I-25 corridor were determined:
Based on potential contributions of MSATs and PM2.5 from industrial sources, the section of I 25 from SR 35 south to Lincoln Street should be avoided when selecting potential monitoring sites. Similarly, the traffic volume on arterial roadways during the morning and evening traffic peaks due to the large commercial office buildings limits the number of suitable study locations from I 225 south to Arapahoe Road. Therefore, the stretch of I-25 from Lincoln Street south to I-225 should be further evaluated to determine traffic volumes on arterial roadways in order to find study areas with the least potential impacts from other major sources of MSATs and PM2.5.
As previously discussed, potential study sites also will need to be evaluated for potential dispersion interferences along I-25, such as ramps, underpasses, overpasses, noise walls, and below-grade or elevated traffic lanes.
Figure B-9 presents annual, daytime, and nighttime windroses for meteorological data collected from the Denver Stapleton International Airport from 1990 to 1992. As shown in this figure, the predominant wind direction in the Denver area is from the south. However, there is a significant difference in the diurnal wind pattern with a daytime wind pattern predominantly out of the north and a nighttime wind pattern predominantly out of the south. This change in the daily wind pattern presents difficulty in determining the most representative monitoring site locations. Placing monitoring sites north of I-25 will potentially result in the monitors being upwind of I-25 for the majority of the day, but could be downwind or crosswind from I-25 during a significant portion of the day when the daily traffic volume is at its highest. Placing the monitoring sites south of I-25 will potentially result in the monitors being upwind of I-25 during the highest traffic conditions, but will certainly be downwind of the monitors during the nighttime hours. In addition, based on the predominantly north-south direction of I-25, there are only a few sections of I-25 that would allow for monitors to be placed perpendicular to the highway in the north or south direction. Based on these findings, it can be concluded that identifying potential study locations along I-25 in the Denver area that meet the local meteorological criteria will be difficult.
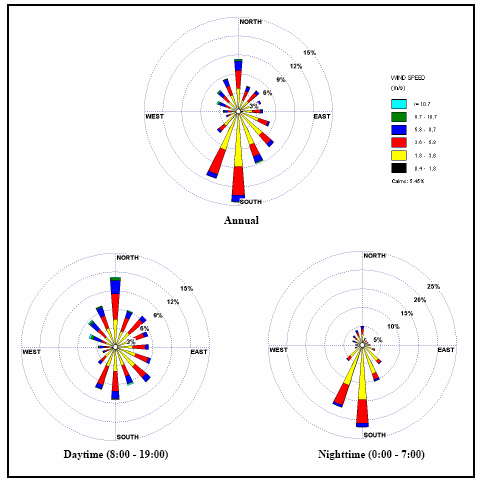
Figure 18. Annual, daytime, and nighttime windroses from 1900 to 1992 Denver Stapleton International Airport meteorological data.
Denver is located at the along the transition of the great plains of eastern Colorado with the north-south trending front range of the Rocky Mountains. The topography of the along I-25 in the Denver area is relatively flat with a majority of land within 300 m of I-25 at less than a 5% slope. The topography around the I-25 corridor is influenced by the South Platte River and the Clear Creek. The topography between US 36 and I-70 is relatively flat due to the convergence of the South Platte River and Clear Creek. From approximately I-70 south to US 85, I-25 is located adjacent to the South Platte River, which results in a steady increase in elevation westward from the South Platte River basin. As I-25 runs eastward from the South Platter River, the topography of the land surrounding I-25 flattens out to an average slope of approximately 2% within 300 m of the interstate. Prior to identifying potential study areas, a more in-depth evaluation of the highway specific topography associated with I-25 will have to be conducted. For example, segments of the highway located significantly below or above ground level elevation may be excluded due to the localized dispersion characteristics associated with these types of roadways. In addition, other road-side structures, such as noise walls, large buildings, and wood lots, must be identified that could act as wind blocks or down wash structures.
The USEPA's AirData Website contains monitoring data for acetaldehyde, benzene, 1,3-butadiene, formaldehyde, and PM2.5 from two monitoring sites in the Denver area (78th Avenue/Steele Street and 2105 Broadway). The Broadway monitoring site is located in the downtown area of Denver approximately 2 km east of I-25. The 78th Avenue/Steele Street monitoring site is located north of SR36 and I-76 approximately 2.8 km east of I-25 and 1.1 km northwest of I-76. Figure B-7 indicates the approximate location of the monitoring sites. Table B-2 presents the 2003 annual average 24-hour concentrations and maximum 24-hour concentrations of acetaldehyde, benzene, 1,3-butadiene, and formaldehydes, and presents the annual mean and maximum 24-hour PM2.5 concentrations measured at the monitoring sites.
As shown in Figure B-7, the 78th Avenue monitoring site is located in an area that can be categorized as a background site in respect to the distance to I-25 or I-76, to major arterial roads, or other potential sources of MSATs or PM2.5. The Broadway monitoring site is located in downtown Denver in proximity to I 25, major arterial roads, and other potential emission sources such as several railroad lines. The ambient concentrations of acetaldehyde, benzene, 1,3-butadiene, and formaldehyde at the Broadway monitoring site are approximately 41%, 22%, 19%, and 119% higher than the 78th Avenue site, respectively. These values indicate that the siting location for the background monitor is critical in order to obtain concentrations representative of the background conditions of the study area.
| Pollutant | Broadway Monitoring Site Annual 24 hour Average Concentration |
Broadway Monitoring Site Maximum 24-hour Concentration |
78th Ave/Steele St Monitoring Site Annual 24 hour Average Concentration |
78th Ave/Steele St Monitoring Site Maximum 24-hour Concentration |
|---|---|---|---|---|
| Acetaldehyde | 3.48 | 5.49 | 2.47 | 3.42 |
| Benzene | 2.73 | 5.21 | 2.24 | 4.57 |
| 1,3-butadiene | 0.25 | 0.55 | 0.21 | 0.55 |
| formaldehyde | 6.22 | 10.09 | 2.84 | 3.94 |
| PM2.5 | 10.5a | 33 | NAb | NA |
a. Value represents the mean annual concentration for PM2.5.
b. NA indicates data not available.
Based on the annual traffic volume data, geometric layout of the I-25 corridor, topography, and meteorological data, three potential study segments were identified and evaluated to determine the best available study location. The potential study segments were identified based on the varying land use types along the I-25 corridor and include the following:
As previously indicated, the northern segment passes through numerous industrial facilities in addition to dense residential neighborhoods and commercial properties. This segment of I-25 runs predominantly north/south, while the predominant wind direction is from the south. The northern half of this segment is relatively flat, but the southern half of this segment that runs adjacent to the South Platte River and has an upward slope of approximately 6% along the eastern side of I-25. Based on the site selection criteria, this segment is the least desirable due to the number of other potential emission sources, the predominant wind direction in line with I-25, and the topographic features along the southern portion of the segment.
The middle segment is surrounded by predominantly dense residential neighborhoods with some commercial properties. This segment of I-25 runs mainly northwest/southeast with a small section that runs directly east/west. The topography perpendicular to I-25 in this segment is relatively flat, as the slope contours run north/south throughout this segment. This segment provides the most potential for selecting suitable monitoring locations for this study. Figure B-10 presents an example of a potential study location within this segment. As shown in this figure, the potential study location is north of I-25, which provides monitors located downwind of I-25. This location provides sufficient area to locate the monitors more than 300 m from other potentially significant emission sources, such as major arterial roads. In addition, all of the monitors, except of possibly the background monitor, would be located at approximately the same elevation, and no significant obstructions are located within this area.
The southern segment is located in an area that consists mainly of large commercial office buildings with some industrial facilities and dense residential neighborhoods. This segment runs mainly northwest/southeast. The topography of this area is relatively flat with less than 5% slope within 300 m of the I-25. Based on the site selection criteria, this segment is less desirable than the middle segment due to the proximity of major arterial roads, the predominant wind direction, and limited areas of unobscured open spaces within 300 m of I-25.
It should be noted that even though it may be possible to locate a suitable study area along I-25 based on the traffic volume, geometric design, topography, and predominant wind direction, the distinct change in daytime and nighttime wind directions does not make this area the most desirable study location. Obtaining sufficient data from this area to distinguish the diurnal dispersion patterns of the MSATs and PM2.5 may not be achievable. A more detailed review of the local meteorological conditions should be conducted in order to determine if a study location (i.e., downwind) is available that would allow for collection of the diurnal traffic pattern emissions from I-25.
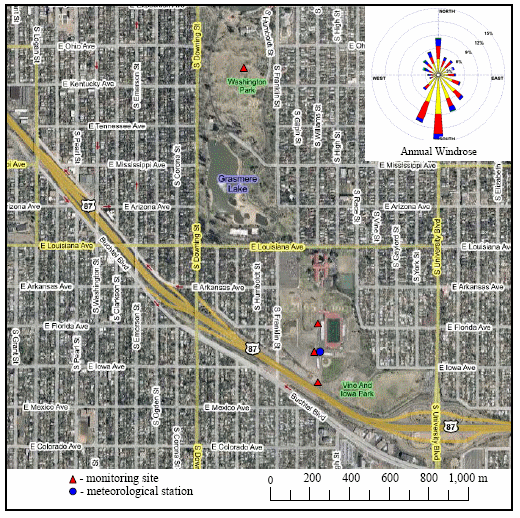
Figure 19. Aerial photograph of example monitoring site locations along I-25.

