
In the development of on-road mobile source emission inventories, reliable data on vehicle fleet characteristics such as age distribution and alternative vehicle fuels and technologies fraction are as important as accurate data concerning vehicle activity and emission rates. For example, fleets with a higher percentage of older vehicles will have higher emissions for two reasons. First, older vehicles have typically been driven more miles and have experienced more deterioration in emission control systems. Second, a higher percentage of older vehicles also means that there are more vehicles in the fleet that do not meet newer, more stringent emissions standards. Studies have shown that the class and age distributions of vehicle fleets can vary significantly from area to area, e.g., [Malcolm et al., 2003]. Therefore, for state implementation plan (SIP) and transportation conformity purposes, the U.S. Environmental Protection Agency (EPA) recommends that agencies develop local vehicle class and age distributions [U.S. Environmental Protection Agency, 2004; U.S. Environmental Protection Agency, 2009].
The current practice in developing vehicle fleet data relies heavily on the use of vehicle registration database. This practice is sufficient for creating base vehicle fleet characteristics for an area, but it also has certain limitations. For instance, a significant fraction of vehicle miles traveled (VMT), and thus emissions, for an area could be attributable to vehicles registered outside the area (e.g., [Lutsey, 2009]). This is usually the case for, for instance, tourist areas and areas with major transportation hubs such as international airports and seaports. Applying inaccurate vehicle fleet characteristics could have significant impacts on the resulting emission inventories.
Furthermore, some vehicle emission and air quality studies may benefit from careful characterization of vehicle fleet at a more refined scale. For example, a project-level analysis of vehicle emissions may be performed using vehicle fleet data localized to the project. In another example, a modeling of regional air quality during ozone episodes may be based on emissions estimated using vehicle fleet data specific to the modeling period. Yet, in another example, a measurement of pollutant concentration near roadways for dispersion model development or validation may be conducted in conjunction with vehicle fleet characterization during the measurement in order to reduce biases in the emission estimates.
Therefore, there is a need for a tool or method that will enable the collection and development of highly-resolved and area-specific vehicle fleet data. An example is the use of license plate survey to capture vehicle license plate numbers and then apply these license plate numbers to a vehicle registration database to extract vehicle information. The remaining of this chapter describes a method for using license plate survey to obtain local vehicle fleet data, and presents a case study on this method.
The need for better vehicle fleet data mentioned earlier can be met by conducting vehicle license plate survey. The survey is aimed at collecting the license plate numbers of vehicles that are present at the location of interest during the survey period. License plate survey has been used for a variety of purposes including trip origin and destination study, travel time study, automatic vehicle identification, etc. It has also been used for vehicle fleet characterization [Malcolm et al., 2003; Boriboonsomsin et al., 2009]. One advantage of license plate survey is that it does not interrupt traffic flow. Another advantage is that the license plate numbers obtained can be used to identify the vehicles and their information such as vehicle type, model year, and registration address.
There are two types of license plate survey that may be conducted.
1.On-road survey: This type of license plate survey is performed on the road of interest. It is appropriate for a vehicle fleet characteristic study of a large area (i.e., conducting the survey at cordon locations), a corridor, or a roadway segment. The survey can be conducted on any type of road as long as a safe and feasible survey spot can be identified. This type of survey is typically performed by using video cameras to capture license plate numbers of moving vehicles on the road. This can be challenging in the case of freeways and highways where vehicles are traveling at relatively high speeds, and during low lighting or visibility such as nighttime. Guidance on conducting on-road license plate survey using video cameras is provided in Appendix B.
Systems consisting of specialized video cameras and automatic license plate recognition (ALPR) software are available that can be used for conducting the license plate survey. These systems can result in a high capture rate of license plate numbers even at high traveling speeds. They are also claimed to provide high accuracy of license plate number reading. However, the costs of such systems can be very high and may not be justifiable if they will not be used regularly. Alternatively, these systems may be rent or a contractor may be hired to perform the survey on an as-needed basis.
2. Parking lot survey: This type of license plate survey is performed in a parking lot where the license plate numbers of the parked vehicles are recorded. It is suitable for a vehicle fleet characteristic study of a small area (i.e., conducting the survey at major trip attractions) or a specific location (e.g., ports, terminals). For parking lot survey, the capture of the license plate number is much easier than the on-road survey. It can be done manually or with the aid of an ALPR system on a vehicle driven around the parking lot, of which the capture rate and the accuracy can be very high.
For the license plate survey with video cameras, the recorded videos are normally processed by human. The processing involves playing back the videos and extracting from each vehicle its license plate number, and if desirable, its vehicle class, as shown in the diagram in Figure 3-1. The extracted license plate numbers can then be matched up with vehicle registration databases in order to extract vehicle information. Vehicle registration databases for different states contain a different amount of vehicle information, but basic vehicle information such as VIN and model year should be available in most vehicle registration databases. The obtained VINs can be run through a VIN decoder to extract detailed vehicle information such as body type, fuel type, gross vehicle weight, etc.
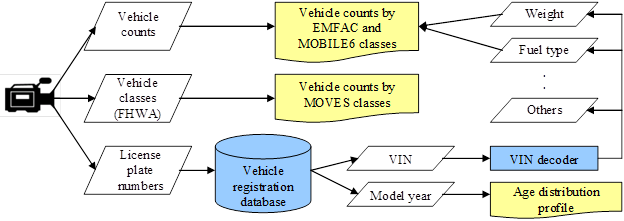
Figure 3-1. Method for collecting local fleet data through license plate survey
The extracted vehicle model year information can be used to derive vehicle age distribution. The fuel type information can be used to develop alternative fuel vehicle fraction. In the past when MOBILE6 was used, the gross vehicle weight information in conjunction with the body type information can be used to determine vehicle class faction. In MOVES, the vehicle classification is no longer based on vehicle weight, but rather tied directly to the HPMS classification system, which are based mainly on the body type and the number of axles. Nevertheless, the MOVES vehicle classes (or "source types") can also be determined visually from the videos.
Note that ALPR systems only return license plate number, but not vehicle class. Another set of camera and vehicle classification software can be added to the system to generate vehicle counts by vehicle class simultaneously. However, this will be at an additional cost.
In this research, one subtask was devoted to validating the accuracy of vehicle information obtained from VIN decoder. A sample of 100 light-duty vehicles and 50 heavy-duty vehicles was selected and their attributes including VIN were gathered from local vehicle dealers. The attributes of these sample vehicles are given in Appendix A.
The VINs of these vehicles were run through a commercial VIN decoder to obtain vehicle attributes, and comparisons were made between the two datasets for model year, body type, and fuel type as these are key data attributes for developing vehicle fleet data inputs for MOVES. The comparison results show that the model year and fuel type obtained from the VIN decoder match the actual information for all the vehicles. The comparison of the body type could not be made directly as the two body type datasets use different body type categorization. However, they are in general agreement with each other.
The license plate survey was used to evaluate the impact of out-of-state vehicles on local vehicle fleet characteristics as a case study. In the study, license plate surveys were conducted at multiple locations in two metropolitan areas (1) Los Angeles and (2) Las Vegas. These two metropolitan areas were chosen because they are in relatively close proximity to each other and are nonattainment areas for multiple criteria pollutants, as shown in Figure 3-2.
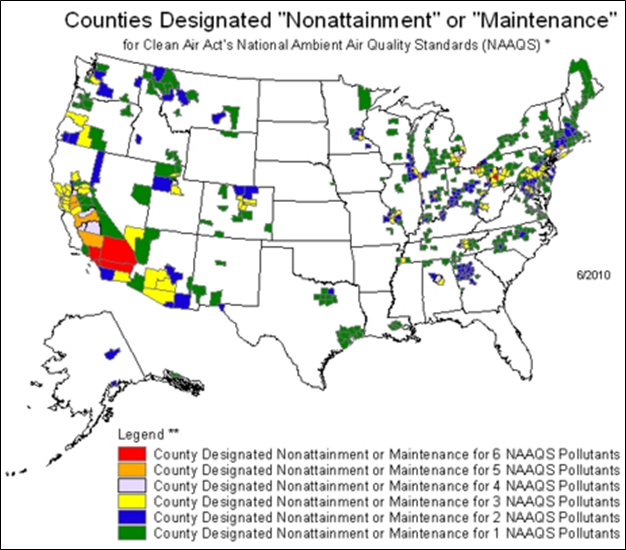
Figure 3-2. Nonattainment and maintenance areas in the U.S. as of June 2010
Figure 3-3 and Figure 3-4 show the survey locations in the Los Angeles and Las Vegas metros, respectively. Three survey locations were selected for each metro to capture the major freeways that lead traffic into the areas. Then, for each freeway a bridge overcrossing the freeway that provided safe working area was selected.
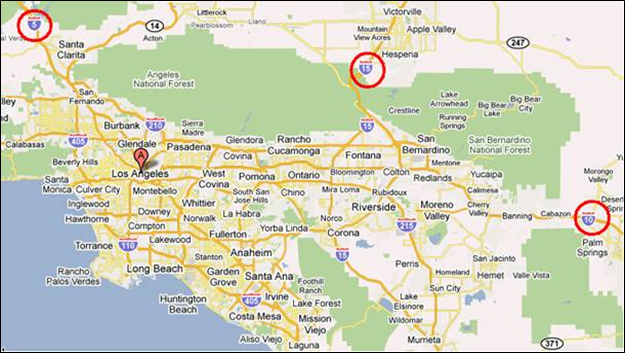
Figure 3-3. Locations of license plate survey in the Los Angeles metro
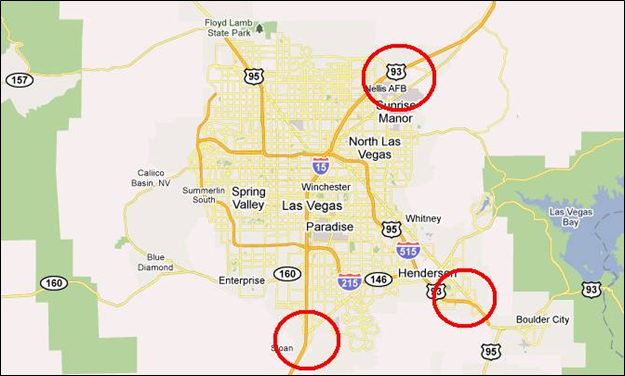
Figure 3-4. Locations of license plate survey in the Las Vegas metro
The surveys were conducted in July 2010, which represents the ozone season for the year. It was decided that the survey should be conducted on both weekday and weekend as business trips usually occur on weekdays and recreational trips on weekends. In addition, it was desirable to collect as many video hours as possible in a day in order to get the most return on the costs (i.e., traveling to the sites, setting up equipment, etc.) for the day. Thus, the surveys were conducted for eight hours a day using two video cameras simultaneously at each location. In summary, the license plate survey program was set us as follows:
Figure 3-5 shows the setup of the survey at one location.
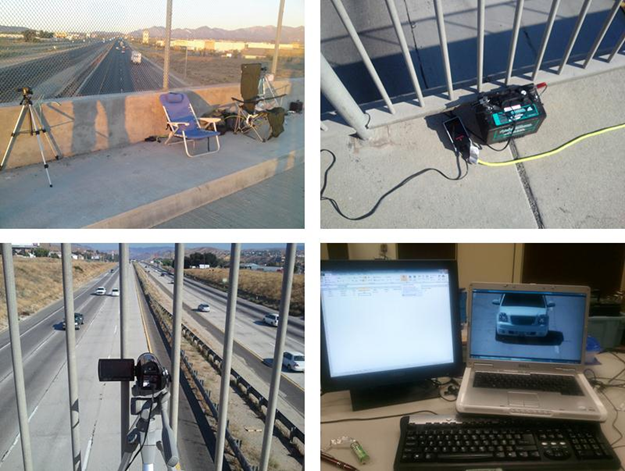
Figure3-5. License plate survey setup
The equipment consists of two high-definition video cameras, two tripods, two 12-Volt marine batteries, a power converter, and necessary power cables. The video cameras were attached to the tripods, which were set up on a sidewalk on the bridge.
At the end of the survey program, a total of 480 video hours were collected. These videos were checked for quality in terms of the clarity of the images and the readability of the license plate numbers. The bottom right picture in Figure 3-5 shows an example video image of a vehicle. Based on this image, the license plate number of the vehicle was read and the vehicle class was identified according to the HPMS and MOVES vehicle classes as shown in Figure 3-6 and Table 3-1, respectively. Typically, the manual processing of the videos to extract the license plate number and identify the vehicle classes took approximately four hours per one hour of video. The videos with poor quality will cause the processing time to be much longer, and thus, not cost-effective. Therefore, only selected video hours were fully processed.
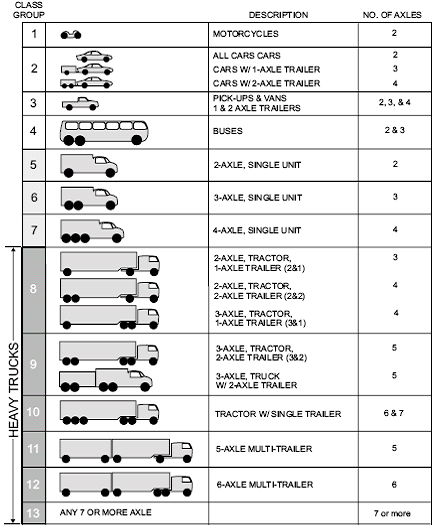
Figure3-6. HPMS vehicle classes
| SourceType ID |
SourceType |
HPMS Vehicle Class |
|---|---|---|
11 |
Motorcycles |
Motorcycles |
21 |
Passenger Cars |
Passenger Cars |
31 |
Passenger Trucks (primarily personal use) |
Other Two-Axle/Four Tire, Single Unit |
32 |
Light Commercial Trucks (other use) |
Other Two-Axle/Four Tire, Single Unit |
41 |
Intercity Buses (non-school, non-transit) |
Buses |
42 |
Transit Buses |
Buses |
43 |
School Buses |
Buses |
51 |
Refuse Trucks |
Single Unit |
52 |
Single Unit Short-haul Trucks |
Single Unit |
53 |
Single Unit Long-haul Trucks |
Single Unit |
54 |
Motor Homes |
Single Unit |
61 |
Combination Short-haul Trucks |
Combination |
62 |
Combination Long-haul Trucks |
Combination |
The state of registration and MOVES source type of the vehicles captured in the Los Angeles license plate surveys are presented in Figure 3-7 and Figure 3-9, respectively. In each figure, the results are given separately for weekday and weekend. Similarly, the state of registration and MOVES source type of the vehicles captured in the Las Vegas license plate surveys are presented in Figure 3-9 and Figure 3-10. The same types of plots for each of the six survey locations are provided in Appendix C.
According to these figures, the majority of vehicles entering the Los Angeles metropolitan area on weekdays are registered in California (82.1%). The same is true for weekends (also 82.1%). On the other hand, only 58.2% of vehicles entering the Las Vegas metropolitan area on weekdays are registered in Nevada. This is even less so on weekends (46.6%). As expected, the majority of the vehicles are passenger cars and trucks (more than 90% in the case of Los Angeles and more than 85% in the case of Las Vegas).
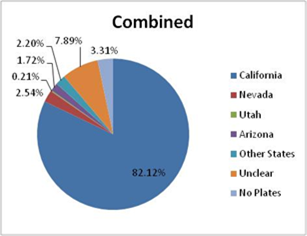
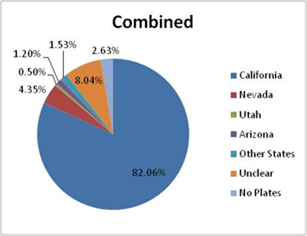
Figure 3-7. State of registration - Los Angeles locations combined, (left) weekday and (right) weekend
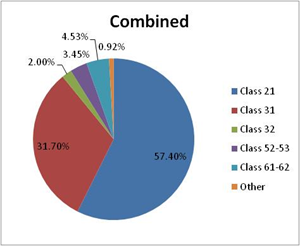
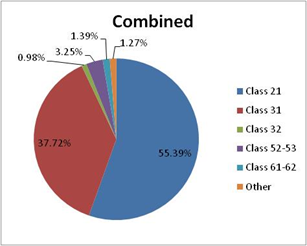
Figure 3-8. MOVES SourceType - Los Angeles locations combined, (left) weekday and (right) weekend
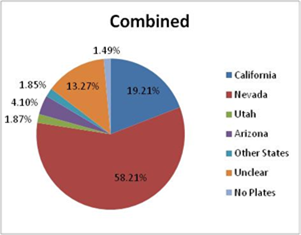
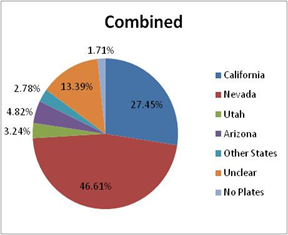
Figure 3-9. State of registration - Las Vegas locations combined, (left) weekday and (right) weekend
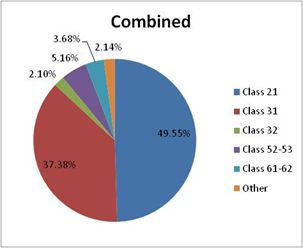
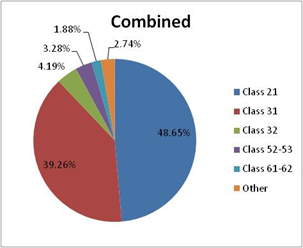
Figure 3-10. MOVES SourceType - Las Vegas locations combined, (left) weekday and (right) weekend
It is interesting to find that approximately 40% of the vehicles entering the Las Vegas metropolitan area on weekdays and 55% on weekends are not registered in Nevada. About a half of these vehicles are from California (19.2% on weekdays and 27.5% on weekends). This finding implies that many Californians travel to Las Vegas throughout the week, especially so on weekend. In the current practice that uses vehicle registration database to develop vehicle fleet characteristic data, these non-Nevada vehicles would not be accounted for.
To examine the possible biases, Figure 3-11 through Figure 3-15 plots the vehicle model year distributions of California and Nevada-registered vehicles that were captured in the Las Vegas license plate surveys during weekdays. According to these figures, there are several differences. For passenger cars and trucks, the California vehicles are relatively newer with the majority being less than one year old (note that the surveys were conducted in July 2010). For light commercial trucks, the shape of the two distributions looks similar, but the peak of the California distribution is three years newer. For single-unit trucks, the overall shape and position of the two distributions are comparable. Lastly, for combination trucks, the Nevada vehicles are newer.
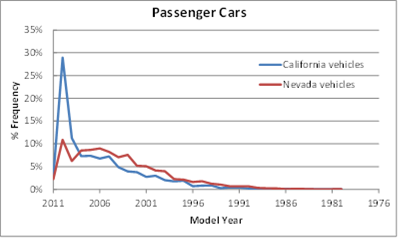
Figure 3-11. Model year distributions of passenger cars
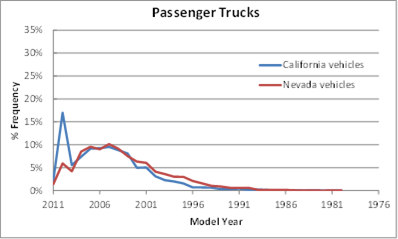
Figure 3-12. Model year distributions of passenger trucks
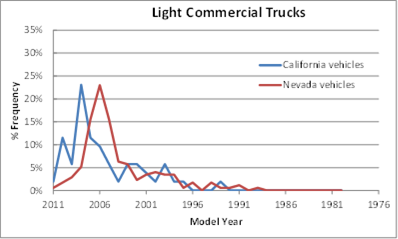
Figure 3-13. Model year distributions of light commercial trucks
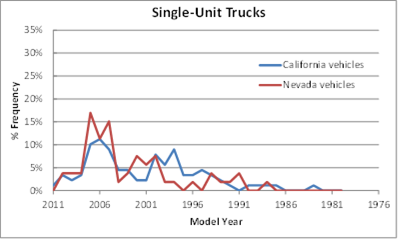
Figure 3-14. Model year distributions of single-unit trucks
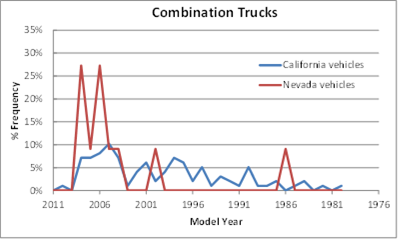
Figure 3-15. Model year distributions of combination trucks
In the development of on-road mobile source emission inventories, reliable data on vehicle fleet characteristics such as age distribution and alternative vehicle fuels and technologies fraction are as important as accurate data concerning vehicle activity and emission rates. In many emission and air quality analyses, there is a need for of highly-resolved and area-specific vehicle fleet data. This need can be met by using the vehicle license plate survey technique in conjunction with vehicle registration database and VIN decoder. The commercial VIN decoder evaluated in this study is found to provide accurate vehicle information. Depending on the vehicle attributes available in the individual states' vehicle registration database, a VIN decoder may or may not be necessary in the development of vehicle fleet data inputs for MOVES.
The license plate survey can be conducted in different ways. It may be done on-road or in parking lots, depending on the area type (e.g., area-wide, corridor, or terminal). It may also be done manually or with an ALPR system, depending on the need and the availability of resources.
The case study of using license plate survey to evaluate the impact of out-of-state vehicles reveals a striking finding that approximately 40% of the vehicles entering the Las Vegas metro on weekdays and 55% on weekends are not registered in Nevada. In addition, about a half of these vehicles are from California (19.2% on weekdays and 27.5% on weekends), which have significantly different model year distributions from the Nevada vehicles. In the current practice that relies heavily on vehicle registration database alone, these non-Nevada vehicles would not be accounted for.
These findings imply that care should be exercised when estimating emissions from vehicles in tourist areas and areas with major transportation hubs. License plate surveys may be conducted to determine the fraction of out-of-state, or even out-of-region, vehicles. Based on the finding, the vehicle fleet characteristic profiles may be adjusted accordingly. For example, in the case of the Las Vegas metropolitan area, the emission calculation could take into account the significant fraction of vehicles from California.

