
Introduction
In the development of on-road mobile source emission inventories, reliable data on vehicle fleet characteristics such as age distribution and alternative vehicle fuels and technologies fraction are as important as accurate data concerning vehicle activity and emission rates. For example, fleets with a higher percentage of older vehicles will have higher emissions for two reasons. First, older vehicles have typically been driven more miles and have experienced more deterioration in emission control systems. Second, a higher percentage of older vehicles also means that there are more vehicles in the fleet that do not meet newer, more stringent emissions standards. Studies have shown that the class and age distributions of vehicle fleets can vary significantly from area to area[1]. Therefore, for state implementation plan (SIP) and transportation conformity purposes, the U.S. Environmental Protection Agency (EPA) recommends that agencies develop local vehicle class and age distributions[2].
The current practice in developing vehicle fleet data relies heavily on the use of vehicle registration database. This practice is sufficient for creating base vehicle fleet characteristics for an area, but it also has certain limitations. For instance, a significant fraction of vehicle miles traveled (VMT), and thus emissions, for an area could be attributable to vehicles registered outside the area[3]. This is usually the case for, for instance, tourist areas and areas with major transportation hubs such as international airports and seaports. Applying inaccurate vehicle fleet characteristics could have significant impacts on the resulting emission inventories.
Furthermore, some vehicle emission and air quality studies may benefit from careful characterization of vehicle fleet at a more refined scale. For example, a project-level analysis of vehicle emissions may be performed using vehicle fleet data localized to the project. In another example, a modeling of regional air quality during ozone episodes may be based on emissions estimated using vehicle fleet data specific to the modeling period. Yet, in another example, a measurement of pollutant concentration near roadways for dispersion model development or validation may be conducted in conjunction with vehicle fleet characterization during the measurement in order to reduce biases in the emission estimates.
The need for better vehicle fleet data mentioned above can be met by conducting vehicle license plate survey. The survey is aimed at collecting the license plate numbers of vehicles that are present at the location of interest during the survey period. There are two types of license plate survey that may be conducted--on-road survey and parking lot survey. This guidance is focused on the on-road survey. It provides guidelines for selecting survey sites, videotaping vehicular traffic in the field, and extracting license plate numbers from videos.
Selecting Survey Sites
There are two aspects to the selection of license plate survey sites the general area where the survey will be conducted and the location of the camera set up and videotaping. These two aspects should be considered together. The considerations include:
The general area where the survey will be conducted should be selected according to the purpose of the study. For example, for a project-level emission analysis the survey sites should be at or within the vicinity of the project. For a regional emission inventorying purpose, the survey sites should be on major roadways in the region. Figure B-1 shows an example of survey sites that are appropriate for a study to examine the characteristics of out-of-region vehicles. In this example, areas on major highways that carry traffic into and out of the region around the boundary of the region are selected.
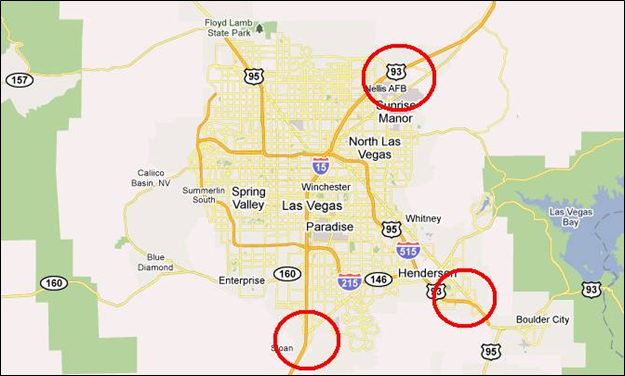
Figure B-1. Survey sites for out-of-region vehicles study
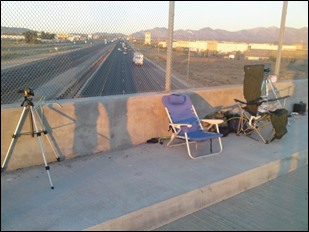
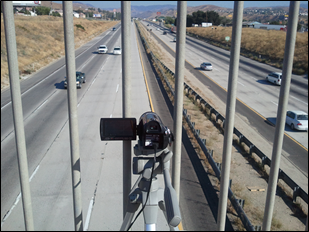
Figure 2. Location of camera set up and videotaping
Videotaping Vehicular Traffic
Equipment
The equipment required to perform a successful on-road license plate survey can vary by survey site, but the necessary items are listed below:
In addition to the necessary items above, the following optional items may also be useful:
Procedures
The procedures for videotaping vehicular traffic vary by circumstances. Below are some basic procedures and considerations that may be used as a general guideline.
Another critical aspect is the camera's zoom level. Adjust the camera such that the lane markers of one lane are on the edges of the screen (use maximum zoom if necessary). The license plate must be visible in the camera view for at least two full seconds to be properly processed. It is recommended that a trial-and-error approach be used to find an optimal shooting angle and zoom level.
During a survey session, cameras should be checked every 15-30 minutes for shooting angle, zoom level, as well as power. As the lens is set to near its maximum zoom, any slight adjustment can take the focus completely off of the license plates. In some cases, the surveyor may contact the camera or the tripod accidentally, which can make the shooting angle and zoom level no longer optimal.
4 Hours of Survey with 2 Video Cameras |
|
For 3-Lane Highways |
For 4-lane Highways |
First 80 minutes - Lanes 1 and 2 |
First 2 hours - Lanes 1 and 3 |
Next 80 minutes - Lanes 2 and 3 |
Last 2 hours - Lanes 2 and 4 |
Last 80 minutes - Lanes 3 and 1 |
|
After each survey session, there are a few routines that should be performed to prepare for the next day of survey. It is important that these routines are performed immediately after each session, especially if multiple sessions are planned for the same day.
Extracting License Plate Numbers
Due to the high costs of automated license plate recognition systems, manual extraction of license plate numbers can prove to be a viable alternative. A typical setup involves a team of data technicians; each assigned a set of videos from the survey. The process is straightforward; going through the tape, pausing at each vehicle, and recording the vehicle information on a spreadsheet. If possible, a dual-computer or dual-monitor setup such as that shown in Figure B-3 is desirable as it will help make the processing faster.
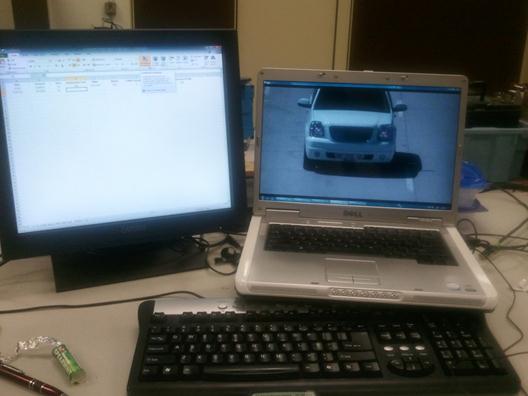
Figure B-3. Dual-computer setup for license plate number extraction
The main advantage of manual extraction is the interpretation ability of the data technician. Due to the relatively ad hoc nature of the data collection process, the size of a license plate number, the amount of lighting on the plate, and the amount of time the plate is captured on film can vary greatly from one video to another. The human eye, however, is quick to adjust and able to interpret license plates. Moreover, the manual extraction technique allows for the collection of more vehicle attributes than just the license plate number, for example, state of registration, vehicle class, or even vehicle make and model in some cases.
On the other hand, manual extraction takes time. Even with a dual-monitor setup, the amount of time to process one hour of video can take between two and four hours depending on the traffic volume and the quality of the video images.
[1] Malcolm, C., Younglove, T., Barth, M., and Davis, N. (2003). Mobile-source emissions: analysis of spatial variability in vehicle activity patterns and vehicle fleet distributions. Transportation Research Record, 1842, 91-98.
[2] U.S. Environmental Protection Agency (2009). Technical Guidance on the Use of MOVES2010 for Emission Inventory Preparation in State Implementation Plans and Transportation Conformity. Report No. EPA-420-B-09-042, December.
[3] Lutsey, N. (2009). Assessment of out-of-state truck activity in California. Transport Policy, 16(1), 12-18.

