
Heavy-Duty Diesel Truck (HDDT) emission rates in MOVES were developed using several data sources. For NOx emission rates, the data sources consist of the Rover Portable Emission Measurement System (PEMS) dataset collected by the U.S. Army and the Consent Decree testing dataset collected by West Virginia University. Together these two datasets cover HDDT model years 1994-2006. Data for the development of PM2.5 emission rates are from the Coordinated Research Council (CRC) E-55/59 program and cover model years 1974-2004. Emission data for the development of CO and HC emission rates are from several data sources including the CRC E-55/59 program, and cover vehicle model years 1969-2005.
Nevertheless, there are still approximately 50% data "holes", which are filled using several hole filling methods [U.S. EPA, 2005]. For instance, at the time that MOVES was developed, emission data was not available for HDDT model years 2007 and newer. Thus, the U.S. EPA estimated the HDDT emission rates of newer model years based on the 2003-2006 emission rates and the ratio between the emission standards for 2003-2006 and those for newer diesel engines. For example, the basic emission standards for NOx decrease from 2.4 g/bhp-hr for 2003-2006 to 1.2 g/bhp-hr for 2007-2009 to 0.2 g/bhp-hr for 2010 and onward. Therefore, the NOx emission rate in MOVES for the 2007-2009 model years decreases 50% from the one for the 2003-2006 model years. Similarly, the NOx emission rate in MOVES for the 2010 and newer model years decreases 90% from the one for the 2003-2006 model years.
The HDDT emission standard for PM2.5 is 0.10 g/bhp-hr for 1994-2006 and 0.01 g/bhp-hr for 2007 and onward. Therefore, the PM2.5 emission rates in MOVES for 2007 and newer model years are estimated based on the age corrected 1998-2006 emission rates and a 90% emission reduction due to the decrease in the PM2.5 emission standard. For HDDTs with engine model years 2007 and newer, meeting the lower PM2.5 standard requires the use of a diesel particulate filter (DPF).
It is assumed that as more emissions data from vehicles are collected, the emissions rates in MOVES can be updated and thus the fidelity of the model should improve. Hence, there is a need to continue measuring vehicle emissions in order to fill in the emission data holes in MOVES. These emission measurement programs should be prioritized so that critical data holes are addressed first. One of the gaps in understanding HDDT emissions is the effect of loaded vehicle weight. HDDT emission rates in emission models are typically developed from emission data measured at a specific truck weight. Although emission measurement programs are usually designed to measure emissions at various driving patterns, they are rarely designed to measure emissions at different loaded vehicle weights. The effect of loaded vehicle weight on emissions is particularly important for HDTs that carry goods in their trailers. The truck operating weight could vary highly depending on the type of goods being carried and whether the container is empty or full.
In this research, the Mobile Emissions Laboratory (MEL) at the Center for Environmental Research and Technology (CERT) at the University of California, Riverside, was used in conjunction with CERT's heavy-duty chassis dynamometer to measure truck emissions at various weights and driving patterns. MEL is a unique laboratory containing all of the instrumentation normally found in a conventional vehicle emissions laboratory, but the equipment is mounted inside a 53-foot over-the-road truck trailer. With the chassis dynamometer, truck driving patterns can be simulated for various road grades, container weights, and other conditions while the truck is driven on the computer-controlled testing platform.
MEL, pictured in Figure 5-1, is a complete emission laboratory enclosed in a 53 foot class-8 trailer, with the ability to measure HDT emissions in-tow. MEL measures on-road and real-world emissions from engines at the quality level specified by the U.S. Congress Code of Federal Regulations. The laboratory contains a full dilution tunnel, analyzers for gaseous emissions, and ports for particulate measurements.
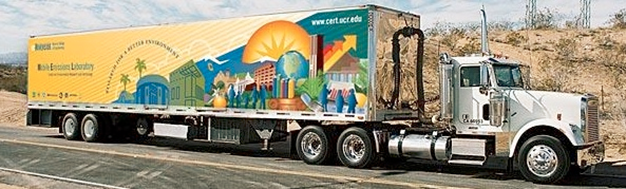
Figure 5-1. CERT's Mobile Emissions Laboratory (MEL)
Vehicle exhaust gases are diluted with conditioned and purified ambient air. Significant mixing occurs as the dilution air and diesel exhaust pass through an orifice plate. The primary dilution system is configured as a full-flow constant volume sampling (CVS) system with a smooth approach orifice (SAO) venturi and dynamic flow controller. The SAO venturi has the advantage of no moving parts and repeatable accuracy at high throughput with low pressure drop. As opposed to traditional dilution tunnels with a positive displacement pump or a critical flow orifice, the SAO system with dynamic flow control eliminates the need for a heat exchanger. The system is capable of total exhaust capture for engines up to 550 kW.
MEL includes an extensive analytical sampling system. Heated probes, heated filters, and sample conditioning are used to prevent condensation and remove moisture in the system. Sample probes can be attached to any of 10 access ports to the primary tunnel, which are located 10 tunnel diameters from the mixing orifice. The mobile laboratory contains a suite of gas-phase analyzers on shock-mounted benches. The gas-phase analytical devices measure NO, methane (CH4), total hydrocarbons (THC), CO, and CO2 at a frequency of 10 Hz and were selected based on optimum response time and on-road stability. Each modal analyzer is time-corrected for tunnel, sample line, and analyzer delay time. MEL is also equipped with a wide range of measurement techniques for full characterization of the diesel exhaust PM composition, real-time PM, and semi-volatile and PM PAHs, C1-C12 gaseous hydrocarbon species and carbonyls.
Figure 5-2 shows a basic schematic of the MEL trailer. The various instruments are powered by an on-board generator making the entire lab mobile. The laboratory can measure emissions in a stationary position, such as is required when sampling from a Back-Up Generator (BUG) or engine dynamometer, or it can be towed by a class 8 tractor, measuring the tractor's emissions in traffic under real-world operating conditions. In the latter setup, the truck's exhaust system is connected to the dilution system and the entire exhaust stream is captured. A driver's aid was developed, which allows the truck operator to follow prescribed driving cycle if the road conditions permit.
Data collected by MEL also includes information from the vehicle's Engine Control Unit (ECU) as well as additional sensors. The ECU provides, among other things, engine speed, percent engine load, and fuel. Emission concentrations and mass flow rates are recorded second-by-second during the testing and are stored in a database. The raw emission gas concentrations are then converted from concentrations in parts-per-million (ppm) to mass emission rates in grams per second, using algorithms for the gas analyzers which account for parameters such as emission densities, exhaust flow rates, and differences in dry and wet gas measurements. This is carried out for CO2, CO, HC, NOx and PM.
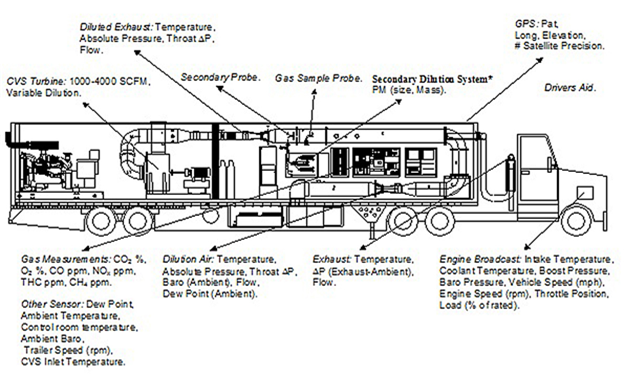
Figure 5-2. Schematic of CE-CERT's Mobile Emission Research Lab
An important part of post-processing is to time align all of the necessary second-by-second emission data. This step is necessary since there is a time delay inherent in each of the gas analyzer response times and between data from the analyzer, the vehicle's ECU and GPS data. Time alignment of the data is crucial in order to establish correlations among various parameters.
The proper time shift for the emission data is determined through several steps. An initial time shift for each pollutant emission is provided by MEL as part of the validation and calibration of the emission benches. The second step is to analyze the time shifts for each pollutant emission relative to the ECU data.Since the ECU fuel data shows a strong relationship with the emission data and is the basis for much of the later work, it is used to determine alignment between the ECU and emission data sets. Alignment of these two data sets is done via a cross correlation analysis to calculate lag times between vehicle emissions, vehicle ECU and GPS data.
CERT has installed a heavy-duty tandem axle truck chassis dynamometer in conjunction with Mustang Dynamometer. The development of the chassis dynamometer design was based on target vehicles in the medium to heavy-duty diesel vehicle range. This high performance 48" Electric Chassis Dynamometer has Dual Direct Connected, 300 Hp AC Motors individually attached to each roll set (model MD-AC/AC-300.48/300.48-45,000lb-HD-TANDEM). The dynamometer is capable of simulating exacting road load & inertia forces to a vehicle operating over a range of different driving conditions including highway cruise, urban driving, and other typical on road driving conditions, with the designed based on 17 different drive cycles. The robust dynamometer can continuously absorb/motor loads in excess of 600 HP from 45 to 80 mph and intermittently absorb/motor loads in the range of 1,200Hp. The dynamometer is able perform vehicle inertia simulation across a vehicle weight range of 10,000 to 80,000 lb. MEL is used directly in conjunction with this facility for certification type emissions measurements.
Given the increasing proportion of the 2007 and newer model year HDDTs in the current and future HDDT populations, it is of interest to evaluate and possibly update emission rates associated with these model years. Therefore, it was initially designed that one of the two trucks to be tested would have engine model year between 2007 and 2009 (i.e., meeting 2007 emission standards), and the other truck would have engine model year of 2010 or newer (i.e., meeting 2010 emission standards). However, at the time of truck recruitment (in August 2010), it was not possible to find a 2010 model year truck locally. Therefore, two 2007-2009 model year trucks were tested. Their characteristics are given in Table 5-1 and their pictures are shown in Figure 5-4. Although Truck 1 is heavier, it has a more aerodynamic design than Truck 2.
Table 5-1. Two targeted HDDTs for emission testing
Truck |
Make |
Engine Make/Model |
Model Year |
Tractor Weight (lbs) |
|---|---|---|---|---|
1 |
International |
Cummins/ISX-400 |
2009 |
17,480 |
2 |
Kenworth |
Cummins/ISM-400 |
2008 |
15,260 |
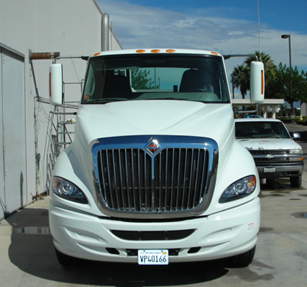
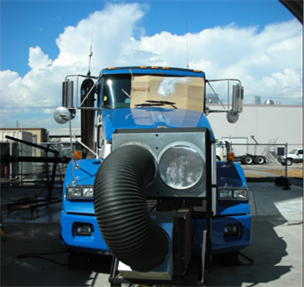
Figure 5-4. (Left) Truck 1 and (right) Truck 2
The chassis dynamometer, with proper road-load coefficient settings, can realistically simulate load on the truck due to vehicle and cargo weight. The road-load coefficients for any given truck and weight can be determined by performing road-load coast down testing. In the coast down testing, the trucks were run by themselves. In addition, they were equipped with a flatbed trailer, which was loaded with K-rail barriers at two test weights as listed in Table 5-2. In summary, these weight scenarios represented a bobtail, a half loaded, and a fully loaded truck. The maximum allowable combined vehicle weight in California without exemption is 80,000 lbs.
Table 5-2. Three weight scenarios for road-load coast down testing
Weight Scenario |
No. of 20' K-Rail Barriers |
K-Rail Weight (lbs) |
Flat Bed Weight (lbs) |
Truck 1 Total Weight (lbs) |
Truck 2 Total Weight (lbs) |
|---|---|---|---|---|---|
Bobtail |
0 |
0 |
0 |
17,480 |
15,260 |
Half |
3 |
23,400 |
17,000 |
52,760 |
50,540 |
Full |
6 |
46,800 |
17,000 |
74,300 |
72,080 |
Each coast down testing included six coast down runs, three in one direction of the freeway and the other three on the opposite direction. Each coast down run measured the time in seconds it took for the truck to reduce speed from 65 to 15 mph in 5 mph intervals. The data from the six runs were averaged to obtain the road-load coast down coefficients for a truck at a given weight.
The driving cycles for emission testing on the chassis dynamometer include the Urban Dynamometer Driving Schedule (UDDS; see Figure 5-5) and the California Air Resources Board (CARB)'s Heavy-Heavy-Duty Diesel Truck (HHDDT) schedule, which includes four modes (i.e., idle, creep, transient, and cruise; see Figure 5-6). Together, both driving cycles are considered to provide a wide range of operating conditions that represent typical truck driving activity on roads.
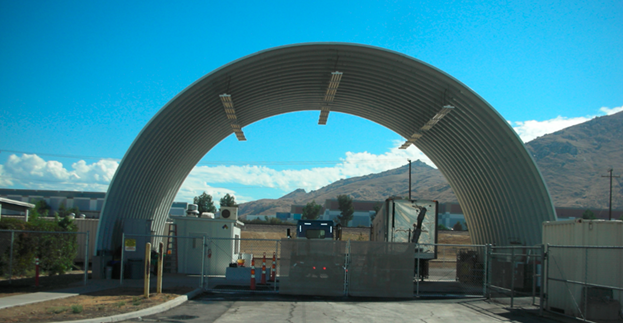
Before the test, the truck was set on the dynamometer and its exhaust pipe was connected to the exhaust flow inlet of the MEL as shown in Figure 5-7. Then, the road-load coast down coefficients were programmed into the dynamometer controller. After all the preparation steps were complete, the driver would start to drive the truck following the prescribed driving cycles. The measured emission data were cleaned up and time aligned before being used in the analyses.
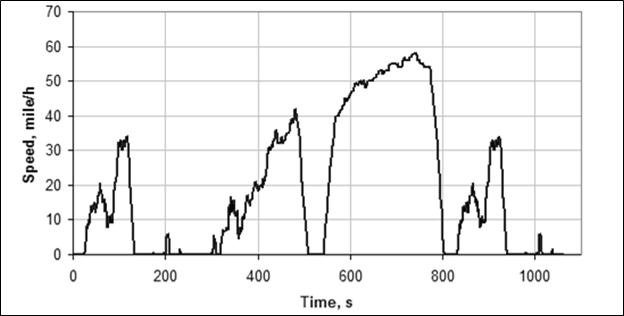
Figure 5-5. Urban Dynamometer Driving Schedule
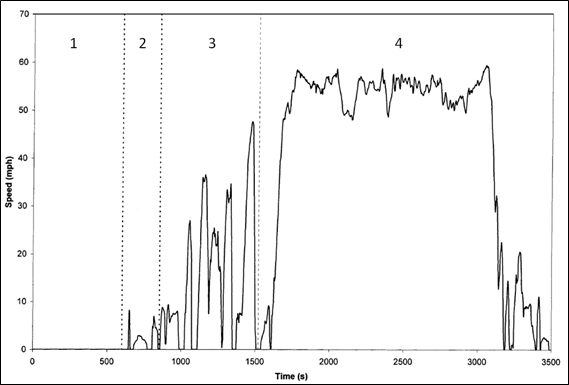
Figure 5-6. CARB's HHDDT schedule
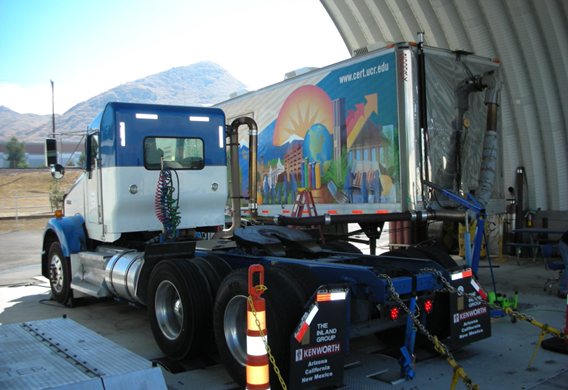
Figure 5-7. Truck being tested on the chassis dynamometer
The major pollutant emissions from HDDTs are NOx and PM. However, upon initial review of the emission data, it was found that the PM emissions were very low. In fact, most of them were lower than the detection limit of the measurement instrument. Therefore, PM emissions were not further investigated. Figure 5-8 and Figure 5-9 show the NOx emission results (in grams per mile) for Truck 1 and Truck 2, respectively.
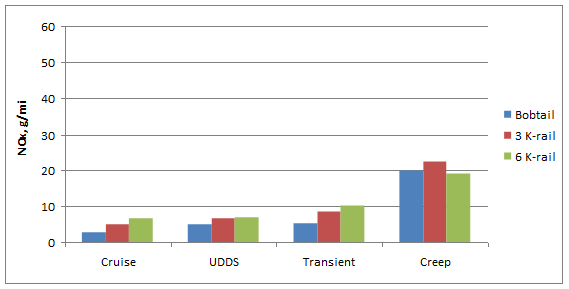
Figure 5-8. NOx emission rates for Truck 1
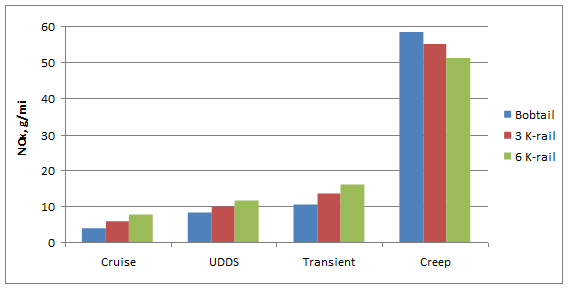
Figure 5-9. NOx emission rates for Truck 2
According to these figures, it is observed that the increasing weight also increases NOx emissions proportionally as expected. This is true for all the driving cycles, except the creep cycle. The creep cycle is very short and is at very low speed. Thus, the presence of a few emission outliers could easily change the trend of the total emissions. By comparing between the two trucks, Truck 2 has higher NOx emissions than Truck 1 in all the cases. By comparing across the driving cycles, the emission rates of the transient cycle are higher than those for the UDDS cycle, which are higher than those for the cruise cycle, respectively. This is expected as the more transient the driving pattern, the higher emissions due to the more frequent acceleration.
Figure 5-10 and Figure 5-11 show the CO2 emission results (in grams per mile) for Truck 1 and Truck 2, respectively.
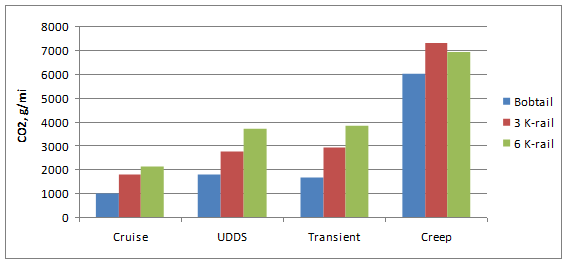
Figure 5-10. CO2 emission rates for Truck 1
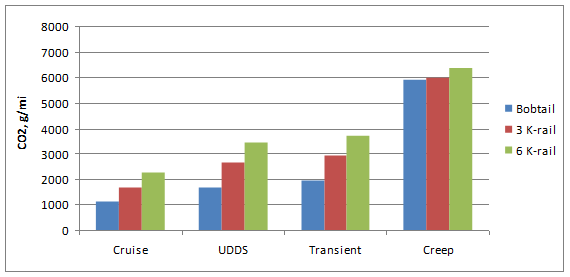
Figure 5-11. CO2 emission rates for Truck 2
Similar to the trend of NOx emissions, it is observed that the increasing weight also increases CO2 emissions proportionally for all the driving cycles, except the creep cycle. By comparing between the two trucks, Truck 1 has slightly higher CO2 emissions than Truck 2 in most cases. This is partly due to the tradeoff between CO2 and NOx emissions. By comparing across the driving cycles, the CO2 emission rates increase from the cruise cycle to the UDDS cycle to the transient cycle as expected.
Since HDDTs produce very little CO and HC emissions compared to NOx, these emission data are quite noisy and no trend can be observed.
Using the measured emission data, the mean emission rate (in grams per second) and its standard deviation for each MOVES vehicle operating mode (OpMode) bin were calculated. Then, they were compared against the base emission rates in MOVES that were developed based on the hole filling method described earlier. Specifically, the MOVES base emission rates were obtained for the following two SourceBinIDs:
1020147290000000000
1020147280000000000
The description for the first SourceBinID is as follows:
| Digit 1 | 1 | leading digit |
|---|---|---|
| Digits 2-3 | 02 | fuel type (2 = diesel) |
| Digits 4-5 | 01 | engine techcology (1 = conventional) |
| Digits 6-7 | 47 | regulatory class (47 = Heavy Heavy Duty (GVWR > 33K lbs)) |
| 29 | model year group (29 = 2009); |
For the second SourceBinID, digits 8-9 are 28, which is for the model year group of 2008.
Figure 5-12 and Figure 5-13 show the comparison results of NOx emission rates for Truck 1 and Truck 2, respectively. For both trucks, there are no measured data for the OpMode bins 28, 29, 30, 38, 39, and 40. In general, the measured mean NOx emission rates are higher than those in MOVES for almost every OpMode bins. The differences are significantly greater in OpMode bins 13, 14, 15, 24, and 25 for Truck 1, and in OpMode bins 13, 14, 15, 24, 25, 27, and 37 for Truck 2.
Figure 5-14 and Figure 5-15 show the comparison results of CO2 emission rates for Truck 1 and Truck 2, respectively. Again, there are no measured data for the OpMode bins 28, 29, 30, 38, 39, and 40 for both trucks. In general, the measured mean CO2 emission rates are higher than those in MOVES for every OpMode bins. The differences are significantly greater in OpMode bins 13, 14, 15, 24, 25, 26, and 37 for Truck 1, and in OpMode bins 13, 14, 15, 24, and 25 for Truck 2. Compared to the measured NOx emission rates, the measured CO2 emission rates have less variation as indicated by smaller standard deviations.
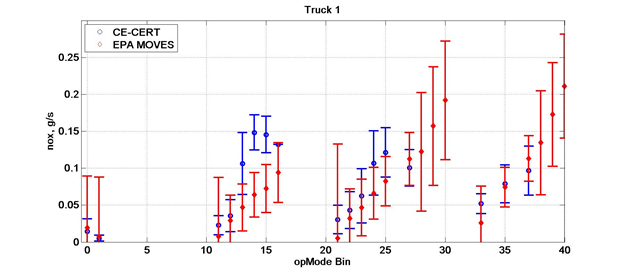
Figure 5-12. NOx emission rates for Truck 1 versus MOVES' rates
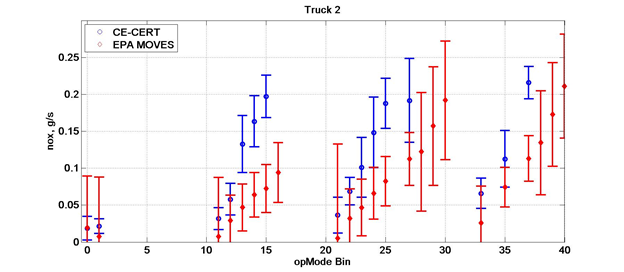
Figure 5-13. NOx emission rates for Truck 2 versus MOVES' rates
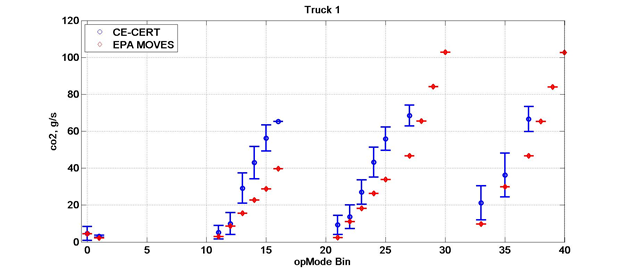
Figure 5-14. CO2 emission rates for Truck 1 versus MOVES' rates
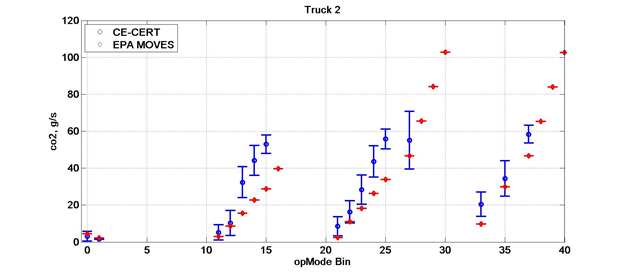
Figure 5-15. CO2 emission rates for Truck 2 versus MOVES' rates
To date, the effect of loaded weight on HDT emissions has not received much attention. However, it is an important topic, especially for areas with freight terminals or freight corridors. For example, some seaports may have unbalanced import and export freight traffic. Therefore, the average weight of HDTs traveling around those seaports may deviate from the typical HDT weight at which emissions are measured.
In this research, HDDT emissions were measured from two trucks at three different weight scenarios that represent a bobtail, a half loaded, and a fully loaded truck. It is observed that the increasing weight increases NOx and CO2 emissions proportionally. For HC and CO, the measured emission data are so noisy that no trend can be observed. This is not too surprising as HDDTs generally produce low HC and CO emissions, which makes them more prone to measurement errors and noise. In addition, it is found that PM emissions from these trucks cannot be confidently measured as most of them are lower than the detection limit of the measurement instrument. This finding attests the effectiveness of the DPF at reducing PM emissions from HDDTs.
The two trucks tested are of model years 2008 and 2009, which means they meet the 2007 emission standards. These trucks were purposefully selected because they were not available by the time MOVES was developed. In the current version of MOVES, these emission data "holes" are filled with placeholder emission values that are determined by factoring two emission standards. The measured NOx and CO2 emissions in this study show that the placeholder emission values for HDDTs meeting the 2007 emission standards are underestimated in most of the vehicle operating mode bins. These measured emission data may be used to update the emission tables in MOVES.

