

Asphalt Binder Cracking Device to reduce Low Temperature Asphalt Pavement Cracking
TASK 2. FIELD VALIDATION
In addition to the originally proposed asphalt binders from National Pooled Fund Study 776 and four Ohio DOT paving projects, eight SHRP binders were included in this Task. These SHRP binders were extensively studied during and after SHRP and their low temperature characteristics are well known. The results of ABCD testing with 10°C/hour cooling rate results are given in Tables 9, 10, and 11. The strength of asphalt binders as measured by Direct Tension Tester (DTT) and ABCD are also compared as shown in Table 12 and Figure 4. As shown in Figure 4, there is a moderate relationship between ABCD strain jump and DTT failure stress for unaged SHRP binders but no statistically significant relationship for PAV aged binders. There is a significant difference in strength measurement between DTT and ABCD. While test temperature is fixed in DTT determination of strength, the temperature cannot be fixed in ABCD test due to ABCD's direct means for determining the cracking temperature. For comparison purposes, DTT strength measured at the lowest temperatures are presented.
Field performance of the Ohio DOT binders are not available. Binder and mixture samples of test roads constructed for Pooled Fund Study 776 Phase II will be tested as they becomes available.
| ID | Aging | ABCD Cracking Temperature, °C | Average | StDev | |||
|---|---|---|---|---|---|---|---|
| 1 | 2 | 3 | 4 | °C | °C | ||
| MN 1 | PAV | –53.4 | –53.9 | ND | –54.7 | –54.0 | 0.66 |
| MN 2 | PAV | –39.1 | –39.6 | ND | –40.7 | –39.8 | 0.82 |
| MN 3 | PAV | –42.5 | –41.8 | ND | –42.5 | –42.3 | 0.40 |
| MN 4 | PAV | –37.3 | –35.2 | ND | –35.4 | –36.0 | 1.16 |
| MN 5 | PAV | –35.6 | –34.4 | ND | –34.6 | –34.9 | 0.64 |
| MN 6 | PAV | –40.4 | –39.0 | ND | –40.7 | –40.0 | 0.91 |
| MN 7 | PAV | –42.1 | –43.9 | ND | –43.7 | –43.2 | 0.99 |
| MN 8 | PAV | –36.3 | –36.7 | ND | –35.9 | –36.3 | 0.40 |
| MN 9 | PAV | –40.3 | –43.0 | –41.3 | –41.6 | –41.6 | 1.12 |
| MN 10 | PAV | ND | ND | ND | ND | ND | ND |
ND: not determined
| ID | Aging | ABCD Cracking Temperature, °C | Average | StDev | |||
|---|---|---|---|---|---|---|---|
| 1 | 2 | 3 | 4 | °C | °C | ||
| AAA–1 | PAV | –36.4 | –37.3 | –36.1 | –36.0 | –36.5 | 0.59 |
| AAB–1 | PAV | –31.3 | –32.4 | –31.7 | –32.2 | –31.9 | 0.50 |
| AAC–1 | PAV | –32.2 | –31.7 | –32.3 | –32.8 | –32.3 | 0.45 |
| AAD–1 | PAV | –32.3 | –32.7 | –31.6 | –31.8 | –32.1 | 0.50 |
| AAF–1 | PAV | –23.4 | –24.0 | –25.2 | –25.6 | –24.6 | 1.02 |
| ABM–1 | PAV | –16.9 | –17.2 | ND | –19.0 | –17.7 | 1.14 |
| AAK–1 | PAV | –27.7 | –28.7 | ND | –29.6 | –28.7 | 0.95 |
| AAM–1 | PAV | –27.6 | –29.2 | ND | –30.4 | –29.1 | 1.40 |
| AAA–1 | RTFO | –38.4 | –34.7 | ND | –37.7 | –36.9 | 1.97 |
| AAB–1 | RTFO | –32.6 | –32.2 | ND | –33.5 | –32.8 | 0.67 |
| AAC–1 | RTFO | –32.2 | –31.8 | ND | –31.6 | –31.9 | 0.31 |
| AAD–1 | RTFO | –35.2 | –36.0 | ND | –34.4 | –35.2 | 0.80 |
| AAF–1 | RTFO | –30.0 | –31.3 | ND | –31.7 | –31.0 | 0.89 |
| ABM–1 | RTFO | –18.6 | –17.3 | ND | –18.4 | –18.1 | 0.70 |
| AAA–1 | Unaged1 | –37.2 | –39.3 | –38.6 | –37.0 | ||
| Unaged2 | –38.4 | –37.4 | –37.0 | –39.3 | –38.0 | 0.99 | |
| AAB–1 | Unaged1 | –34.4 | –34.5 | –33.3 | –36.0 | ||
| Unaged2 | –34.8 | –34.4 | –35.4 | –34.9 | –34.7 | 0.79 | |
| AAC–1 | Unaged | –34.4 | –36.8 | –36.6 | –35.6 | –35.9 | 1.10 |
| AAD–1 | Unaged1 | –38.9 | –40.2 | –38.7 | |||
| Unaged2 | –39.8 | –36.9 | –37.4 | –39.3 | –38.7 | 1.21 | |
| AAF–1 | Unaged1 | –27.4 | –29.0 | –29.1 | –27.8 | ||
| Unaged2 | –29.9 | –29.4 | –30.4 | –29.2 | –29.0 | 1.00 | |
| ABM–1 | Unaged1 | –19.0 | –21.7 | –21.0 | –23.0 | ||
| Unaged2 | –21.5 | –22.5 | –23.6 | –20.6 | –21.6 | 1.46 | |
| AAK–1 | Unaged1 | –34.0 | –33.3 | –33.3 | –36.4 | ||
| Unaged2 | –36.1 | –32.2 | ND | –34.9 | –34.3 | 1.56 | |
| AAM–1 | Unaged | –31.3 | –31.0 | ND | –31.1 | –31.1 | 0.15 |
ND: not determined
| ID | Aging | ABCD Cracking Temperature, °C | Average | StDev | |||
|---|---|---|---|---|---|---|---|
| 1 | 2 | 3 | 4 | °C | °C | ||
| OD1 | Unaged | –33.1 | –32.8 | –33.0 | –32.9 | –33.0 | 0.13 |
| OD2 | Unaged | –29.0 | –30.1 | –30.4 | –29.6 | –29.8 | 0.61 |
| OD3 | Unaged | –35.9 | –38.2 | –37.1 | –37.5 | –37.2 | 0.96 |
| OD4 | Unaged | –40.0 | –40.0 | –39.2 | –39.7 | –39.7 | 0.38 |
| DTT | ABCD | ||||
|---|---|---|---|---|---|
| Temp | Fail Stress | Strain Jump | St. Dev. | ||
| C | MPa | µå | µå | ||
| Unaged Binders | AAA–1 | –20 | 1.02 | 23.2 | 4.87 |
| AAB–1 | –20 | 1.57 | 24.1 | 3.19 | |
| AAC–1 | –20 | 1.95 | 39.2 | 8.46 | |
| AAD–1 | –20 | 0.97 | 28.3 | 8.29 | |
| AAF–1 | –17 | 1.99 | 24.9 | 4.92 | |
| AAG–1 /ABM–1 | –10 | 1.14 | 21.4 | 7.29 | |
| AAK–I | –20 | 1.48 | 25.8 | 8.11 | |
| AAM–1 | –20 | 3.23 | 37.2 | 8.80 | |
| PAV binders | AAA–1 | –15 | 1.18 | 22.3 | 5.09 |
| AAB–1 | –15 | 1.44 | 25.0 | 1.06 | |
| AAC–1 | –15 | 2.28 | 31.6 | 7.85 | |
| AAD–1 | –15 | 1.71 | 23.6 | 4.44 | |
| AAF–1 | –5 | 1.72 | 24.2 | 4.82 | |
| AAG–1 /ABM–1 | –5 | 2.55 | 27.8 | 5.86 | |
| AAK–I | –10 | 0.99 | 27.0 | 4.81 | |
| AAM–1 | –15 | 3.84 | 27.2 | 5.55 | |
DTT data from SHRP A 369 report, Tables 4–10 & 4–12.
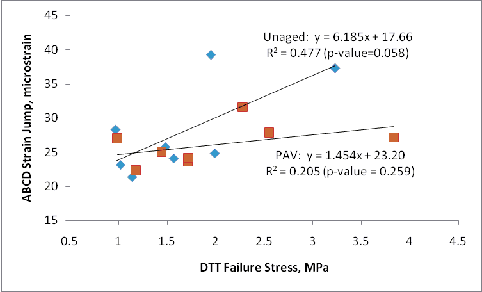
Figure 4. Comparison of strength measured by DTT and ABCD
Task 3. Refinement of Equipment and Analysis Software
3A. Free Piston Sterling Cooler (FPSC)
In collaboration with Global Cooling, Inc., the manufacturer of the Free Piston Sterling Cooler (FPSC), a prototype environmental chamber using the FPSC was developed specifically for ABCD testing. The prototype FPSC chamber is light–weight, quiet, and free of vibration. The FPSC chamber was tested for use with the ABCD. In all trials, the FPSC chamber could not maintain the desired cooling rate (20°C/hr) as shown in Figure 5. At temperatures warmer than –30°C, the cooling rate was larger than 20°C/hr and at temperature colder than –30°C, the rate was lower than 20°C/hr. Some of the problems may be due to insufficient air circulation and low cooling capacity. Even though new fans and modifications to the FPSC may solve the problem, further use of the FPSC–based chamber was put on hold. The Cincinnati Sub–Zero Products, Inc., cooling chamber that has been used for the majority of ABCD development has proven to be durable with consistent cooling rates.
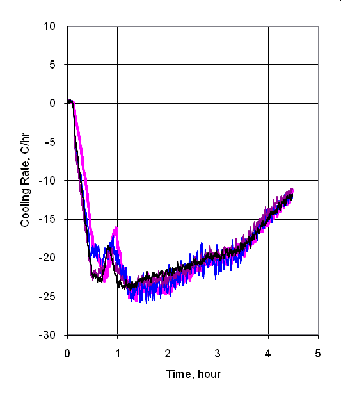
Figure 5. Temperature profile of the fist FPSC chamber with 4 ABCD samples (target cooling rate after 1 hour = 20°C/hr).
3B. ABCD Ring
During the extensive testing of ABCD, it has been noticed that if the cooling chamber is opened while still at low temperature, condensation collects on the ring materials. The ABCD software instructs the cooling chamber to warm–up to room temperature upon completion of the cooling cycle – to avoid condensation. However, an operator could interrupt the test and open the chamber door while the chamber is still cold. The continuous use of the ABCD ring under such conditions leads to excessive moisture accumulation inside the ring, causing strain gage failure. To eliminate the moisture problem, sensors inside new rings were coated with water proofing materials. The water proofing consisted of two coats of flexible water proofing material. The water proofing material was commercially available solvent–thinned silicone rubber which cured to a tough rubbery non–corrosive film. The film thickness of each coat was approximately 0.015 to 0.02 in. thick (per manufacturer literature). After applying water proofing, the rings were tested under water for 24 hours. The results (Figure 6) show that the water proofing was effective. The problem caused by moisture is believed to be minimal for the water proofed ABCD rings.
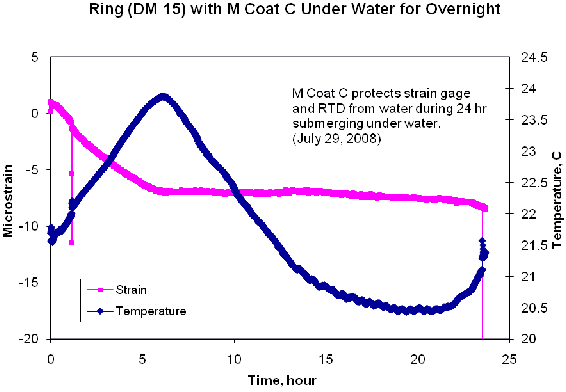
Figure 6. ABCD ring measurements under water after water–proofing (strain spikes at beginning and end were intentionally caused by operator to check the sensors' response).
3C. ABCD Data Analysis Software
The ABCD test data (time, temperature, and strain measurement from each ABCD ring) are recorded by National Instrument's LabVIEW program which displays real–time graphs of strain and temperature versus elapsed time. The program has been upgraded so that it can be used for both Microsoft Windows XP and Vista operating systems. Further, the software now provides direct control of the temperature within the environmental chamber allowing the user to control the rate that the temperature drops within the chamber. The program is now linked to the data analysis program. At the end of the each run, the just–completed data files open automatically. Then, the operator simply clicks on the data analysis menu to run the data analysis program to obtain ABCD test results (cracking temperatures, strength, cooling rate, etc.).