

Precast Bent System for High Seismic Regions: Laboratory Tests of Column-to-Footing Socket Connections
CHAPTER 4. DAMAGE PROGRESSION
Damage progression during the test was recorded in detail with sketches, crack measurements, photography, video, and notes of observations. This chapter defines the damage states and summarizes the damage progression for all three specimens. Additional images of the observed damage can be found in appendix C.
Definitions of Damage States
The performance of the subassemblies was followed carefully to identify key damage states, as defined for the University of Washington Pacific Earthquake Engineering Research (PEER) Center Structural Performance Database.(21) This approach facilitated comparison of damage progression among specimens. The key damage states are defined in table 3.
Preliminary Test Cycles
Small-deformation test cycles were imposed on all three specimens to verify the functioning of the instrumentation. The columns were loaded axially with 90 kips and then cycled laterally to drift ratios of ± 0.05 percent (0.03-inch displacement at actuator level). Only hairline cracks were detected during these preliminary cycles, and all of these cracks closed upon unloading.
Factored Axial-Load Tests
Before any lateral deformations were imposed on specimen SF-1, it was subjected to a vertical load of 918 kips. This load corresponded to 3.8 times the scaled maximum factored dead load plus live load (1.25DL+1.75LL) for the column. Deformations were not measured during this test, but the column and footing were inspected for damage. None was detected.
On the days that lateral loads were applied, the first two specimens (SF-1 and SF-2) were subjected to a vertical load of 240 kips, which corresponded to a scaled-down maximum factored dead load plus live load (1.25DL+1.75LL). The specimens were loaded at an average rate of 8 kips/sec, and the maximum load was held constant for about 5 minutes. Specimens SF-1 and SF-2 withstood this level of axial load without forming any new cracks.
Specimen SF-3, with a thinner footing, was loaded axially with a load of 342 kips, corresponding to 1.4 times the factored load. No damage was observed to the column or to the footing at this level of axial load, demonstrating that the capacity of the shallower spread footing exceeded 140 percent of the factored axial design load.
| Damage Event | Description |
|---|---|
| First significant horizontal crack | Crack width ≥ 0.02 inches |
| First significant diagonal crack | Diagonal crack extends of column diameter. Crack width ≥ 0.02 inches |
| First open residual crack | Residual crack width ≥ 0.01 inches |
| First yield of longitudinal reinforcement | First strain gauge that reaches yield strain (SF-1 & SF-2: 0.00212; SF-3: 0.00204) |
| First yield of transverse reinforcement | First strain gauge that reaches yield strain (0.00204) |
| First spalling in footing | Observed spalling on surface |
| First spalling in column | Observed flaking, minor spalling |
| Significant spalling in column | Spalled height ≥ of column diameter |
| Fully spalled | Spalling height no longer increases with increasing deformation |
| Exposure of longitudinal reinforcement | First observation of column longitudinal reinforcement. |
| Buckling of longitudinal reinforcement | First observation of column longitudinal bar buckling. |
| Large cracks in concrete core | Crack width ≥ 0.08 inches |
| Fracture of transverse reinforcement | Observation or sound |
| Fracture of longitudinal reinforcement | Observation or sound |
| Loss of axial capacity | Instability of member |
Lateral-Load Tests (up to yielding)
For the lateral-load tests, the axial load was reduced to 159 kips, which corresponded to the scaled-down, unfactored dead load plus the influence of overturning on the subassembly. The displacement history consisted of sets of four cycles. In general, the cyclic loading was paused at peak displacements (both at "peaks," or positive drifts, and "valleys," or negative drifts) in the first two cycles of each cycle set to observe and record cracks. Between cycles, at zero displacement, residual crack widths were measured for selected cracks. Subsequent cycles in each set were imposed continuously during which the testing was not stopped to mark or record cracks. All three specimens were subjected to 39 cycles of deformation. Table 4 lists the cycle and drift ratio at which each specimen reached each damage state defined in table 3.
| Damage Event | Specimen SF-1 | Specimen SF-2 | Specimen SF-3 | ||||||
|---|---|---|---|---|---|---|---|---|---|
| Set | Cycle | Drift (%) | Set | Cycle | Drift (%) | Set | Cycle | Drift (%) | |
| First significant horizontal crack | 4 | 1 | 0.69 | 3 | 2 | 0.56 | 3 | 1 | 0.49 |
| First significant diagonal crack | 6 | 1 | 1.68/-1.80 | 6 | 1 | 1.74 | 6 | 1 | 1.71 |
| First open residual crack | 6 | 1 | 1.68/-1.80 | 4 | 3 | 0.88/-0.95 | 5 | 1 | 1.13/-1.23 |
| First yield of longitudinal reinforcement | 3 | 2 | 0.55 | 3 | 2 | 0.47 | 3 | 1 | -0.51 |
| First yield of transverse reinforcement | 8 | 2 | -4.63 | 9 | 1 | -4.93 | 8 | 2 | -4.77 |
| First spalling in footing | N/A | N/A | N/A | N/A | N/A | N/A | 9 | 2 | 7.11/-6.92 |
| First spalling in column | 5 | 1 | 1.07/-1.21 | 5 | 1 | 1.10/-1.19 | 5 | 3 | 1.41/-1.49 |
| Significant spalling in column | 6 | 2 | -2.25 | 7 | 1 | 2.64 | 6 | 2 | 2.13/-2.21 |
| Full spalling in column | 9 | 3 | 7.08/-6.90 | 8 | 1 | 3.98 | 9 | 1 | 5.84/-5.76 |
| Exposure of longitudinal reinforcement | 9 | 1 | -5.68 | 9 | 2 | -6.85 | 9 | 3 | 7.15/-6.93 |
| Buckling of longitudinal reinforcement | 9 | 2 | 7.09/-6.88 | 9 | 3 | 7.19/-6.88 | 9 | 3 | 7.15/-6.93 |
| Large cracks in concrete core | 10 | 2 | 10.61 | 10 | 2 | -9.95 | 10 | 2 | 10.58/-9.97 |
| Fracture of transverse reinforcement | 9 | 2 | -6.88 | 10 | 1 | -8.29 | 10 | 1 | 8.72 |
| Fracture of longitudinal reinforcement | 10 | 2 | 10.61 | 10 | 2 | 10.65 | N/A | N/A | N/A |
| Loss of axial capacity | N/A | N/A | N/A | N/A | N/A | N/A | 10 | 3 | 10.7 |
As shown in figure 16, the damage progression was similar for all specimens. Horizontal hairline cracks were observed on both sides of the columns during the first cycle. In subsequent cycles, the cracks propagated and widened, but they closed after each cycle. The first significant horizontal crack (crack width of at least 0.02 inches) for specimen SF-1 was observed at a drift ratio of 0.69 percent, which slightly exceeded the drift ratios for this state for SF-2 (0.56 percent) and SF-3 (0.49 percent).
Figure 16. Chart. Comparison of specimens' drift ratios for the major damage states.
The nomenclature for identifying the longitudinal bars is shown in figure 17. First yield in the column longitudinal bars was detected at the level of the column-to-footing interface. It occurred at nearly the same drift for all three specimens. The S-SW bar in specimen SF-1 yielded at 0.55 percent drift, the N-NE bar in specimen SF-2 yielded at +0.47 percent drift, and the S-SW bar in specimen SF-3 yielded at a drift ratio of -0.51 percent (valley in cycle 3-2).
Figure 17. Diagram. Column vertical bar naming convention.
Lateral-Load Tests (after yielding)
As the specimens were cycled, a horizontal crack formed at interface between the precast column and the cast-in-place footing. The first open residual crack was observed in specimen SF-1 at a drift ratio of 1.7 percent, which greatly exceeded the corresponding drift ratio for specimen SF-2 (+0.88/-0.95 percent drift) and specimen SF-3 (1.13/-1.23 percent drift). The reason for these differences in behavior is unknown.
The spalling patterns among the three specimens were similar but not identical. Minor spalling first appeared in specimens SF-1 and SF-2 at drift ratios of approximately 1.1-1.2 percent. Specimen SF-3 reached this level of damage slightly later, at a drift ratio of 1.4 percent. All three specimens reached the level of "significant spalling" (spalled height ≥ ¼ of column diameter) at about 2.2 to 2.6 percent drift. The fully spalled state (above which point spalling no longer progressed) varied both in terms of drift ratio and extent of spalling. This state was reached for specimens SF-1, SF-2, and SF-3 at drift ratios of 7 percent, 4 percent, and 6 percent, respectively. The spalling in SF-1 and SF-2 extended over the bottom 10 to 12 inches, whereas in SF-3, the spalling extended up only to a height of 7 inches (to the top of the second curvature rod). Figure 18 compares spalling of the three columns at a drift ratio of 4.28 percent (cycle 8-1).
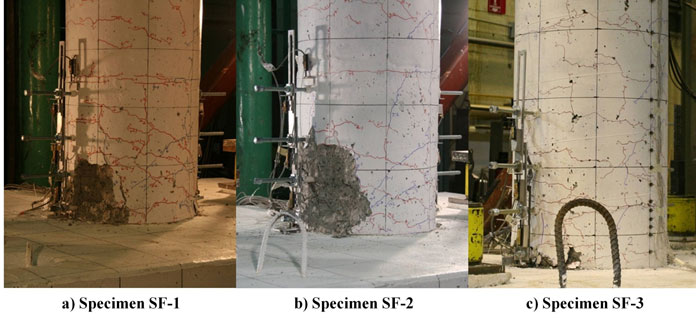
Figure 18. Photos. Test specimens after a cycle of maximum drift ratio of 4.28 percent.
Spiral yielding occurred late in the tests and was associated with the longitudinal bars necking on the north side of the columns (N-NW and N-NE bars). The spiral yielded in cycle set 8 for both specimens SF-1 and SF-3 (cycle 8-2, maximum drift ratio = 5.14 percent). In specimen SF-2, the spiral yielded in cycle set 9 (cycle 9-1, maximum drift ratio = 6.16 percent). In all cases, the yielding occurred after the peak displacement as the specimen was pushed to the valley (SF-1: -4.63 percent drift, SF-2: -4.93 percent drift, SF-3: -4.77 percent drift).
As spalling in the column increased, the longitudinal bars became visible. Bar buckling became visible in all specimens at approximately 7 percent drift (cycle set 9). The spirals fractured at approximately the same time, apparently as a result of buckling of the longitudinal bars.
In subsequent cycles, those bars at extreme tension and compression (N-NE, N-NW, S-SW, and S-SE) underwent alternating axial shortening and elongation, and cyclic bending and straightening. This behavior induced large cyclic strains, which caused them to fracture a few cycles after the spirals failed in both specimens SF-1 and SF-2. In both columns, the first longitudinal bar fractured going south to peak in cycle 10-2 (maximum drift ratio = 10.65 percent). In specimen SF-1, a total of three bars fractured, and in specimen SF-2, four bars fractured. The condition of the bars in specimen SF-1 is shown in figure 19. No bars fractured in specimen SF-3.
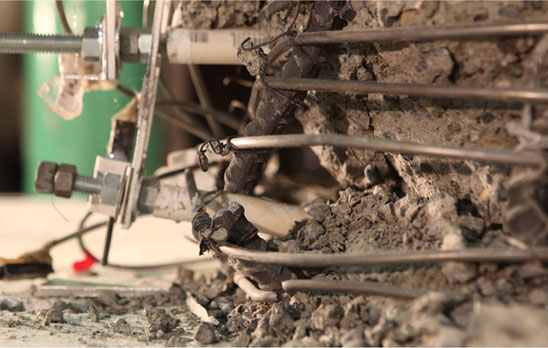
Figure 19. Photo. Specimen SF-1 longitudinal bars fractured after one cycle to 10.65 percent drift ratio.
No vertical interface crack between the roughened surface of the precast column and cast-in-place footing was noticed throughout testing of specimens SF-1 and SF-2.
Spalling in the footing was not observed in specimens SF-1 and SF-2. Cracks in the SF-1 and SF-2 footings were few, occurred only on the sides, and remained at the hairline level throughout the tests.
Footing damage and cracking was more significant in specimen SF-3. Cracks in the sides of the footing were first observed at 0.30 percent drift. No additional damage was observed until 0.89 percent drift, in which small cracks propagating out radially on the surface of the footing from the column-footing interface were noted. This radial cracking continued to propagate in cycles 6-1 and 6-2. In the first two cycles in set 7, new radial cracking on the NE and SW sides of the column was noted along with continued propagation of the existing footing cracking. Spalling of the footing did not occur until set 9 at 7 percent drifts, in which approximately the top 1/8th inch of the footing lifted up. This spalling increased during the following cycles. In cycle 10-1 (8.72 percent drift), major spalling of the top of the footing had occurred in specimen SF-3. Then, during cycle 10-3 (maximum drift ratio = 10.65 percent), as the column was returning from peak, the column punched completely through the footing at 10.7 percent drift. Just before the column punched through, a piece approximately 8 inches by 14 inches by 1.5 inches thick (N-S by E-W) on the north side of the footing lifted up and spalled off.
Since the octagonal section in the connection region was smaller than the column, some of the load was likely taken by this bearing surface. When enough spalling occurred in the column, no resistance could be provided by this bearing surface, and the stress in the connection increased, leading to failure. The last cycle, during which the footing failed, can be seen in figure 20.
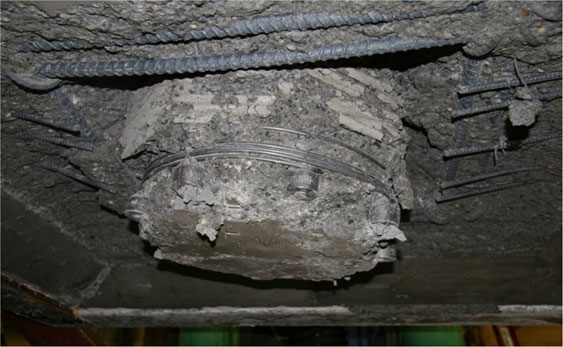
Figure 20. Photo. Specimen SF-3 footing failure.
Based upon inspection of the SF-3 footing after the test, spalling on the bottom of the footing had occurred as well. Measurements were taken after the test to obtain a profile of the failure plane in the footing (figures 21 and 22).
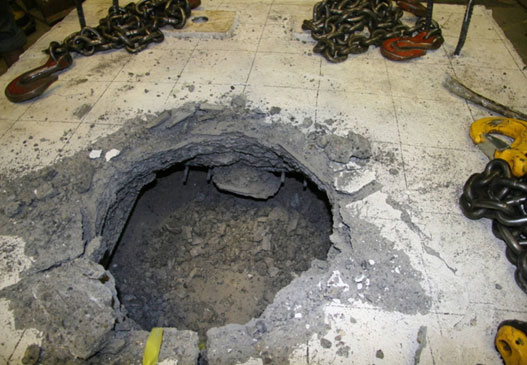
Figure 21. Photo. Damage on top of footing after test.
Figure 22. Diagram. Punching shear profile in the north-south direction (loading direction).
Axial-Load Testing to Collapse
After the cyclic lateral loading was complete, the instruments mounted on the columns of specimens SF-1 and SF-2 were removed, and pure axial load was applied until some element failed and the load started to drop. In both specimens, failure occurred by crushing of the concrete in the plastic hinge region. Specimen SF-1 sustained a maximum axial load of 842 kips, and specimen SF-2 sustained a maximum axial load of 819.5 kips. Both of these values corresponded to about 3.5 times the factored axial load of 240 kips.
This aspect of the test was not performed on specimen SF-3, since the column had already punched through the spread footing during cyclic testing. Figure 23 shows the damage state of the three specimens at the end of the test program.
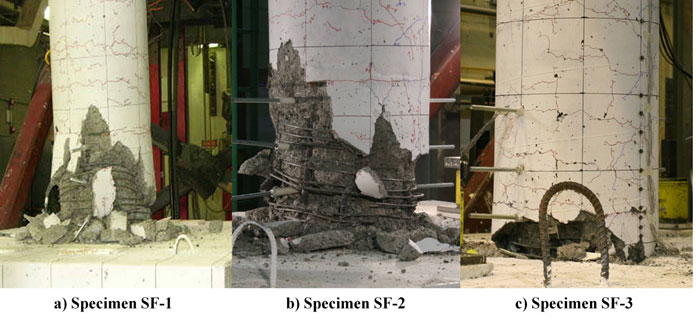
Figure 23. Photos. Specimens at the end of the test program.