

Precast Bent System for High Seismic Regions: Laboratory Tests of Column-to-Footing Socket Connections
APPENDIX C: DAMAGE PROGRESSION
Specimen SF-1

Figure 122. Photo. Specimen SF-1 flexural cracks after cycle 4-1 (+1.00/-1.00 target drift ratio).
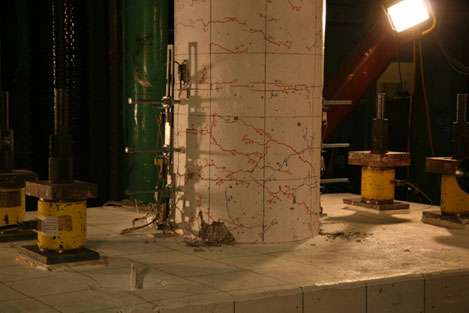
Figure 123. Photo. Specimen SF-1: first significant spalling at cycle 6-2 (+2.48/-2.48 target drift ratio).
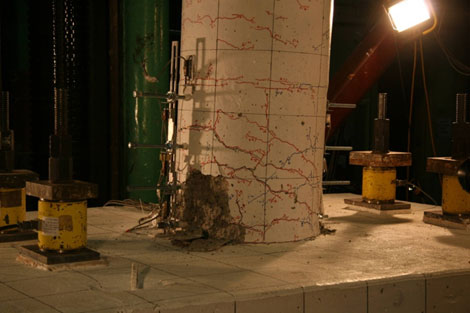
Figure 124. Photo. Specimen SF-1: plastic hinge became more pronounced in subsequent cycles. Photo taken during cycle 8-1 (+4.28/-4.28 target drift ratio).
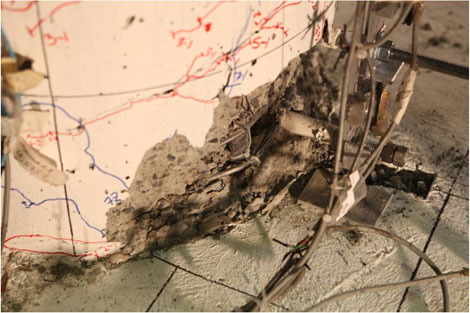
Figure 125. Photo. Specimen SF-1: first noticeable bar buckling was the N-NW bar in cycle 9-2 (+7.40/-7.40 target drift ratio).
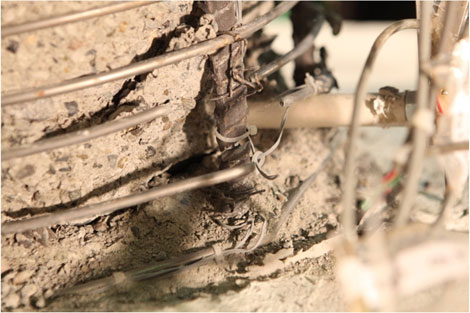
Figure 126. Photo. Specimen SF-1: N-NE bar fractured first when the column was loaded to peak in cycle 10-2 (+10.65/-10.65 target drift ratio).
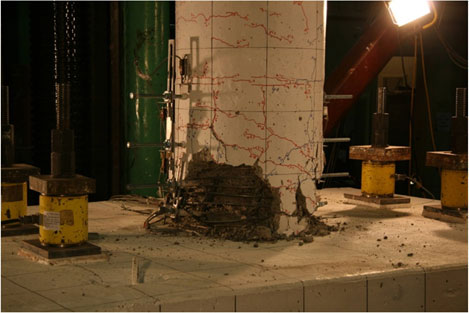
Figure 127. Photo. Specimen SF-1: damage after the cyclic testing.
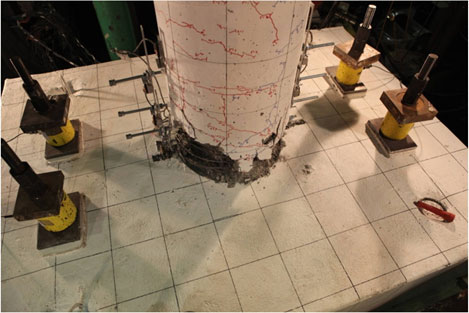
Figure 128. Photo. Specimen SF-1: no damage to the footing was observed after the cyclic testing.
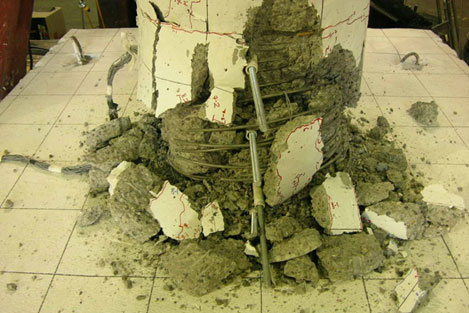
Figure 129. Photo. Specimen SF-1: damage the end of testing. The column crushed after application of vertical load of 842 kips.
Specimen SF-2
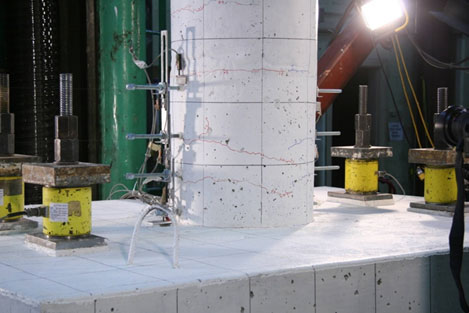
Figure 130. Photo. Specimen SF-2: flexural cracks after cycle 3-2 (+0.83/-0.83 target drift ratio).
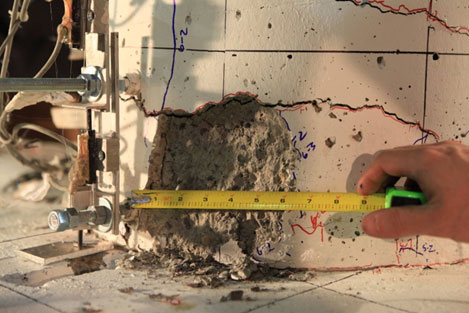
Figure 131. Photo. Specimen SF-2: first significant spalling at cycle 7-1 (+2.97/-2.97 target drift ratio).
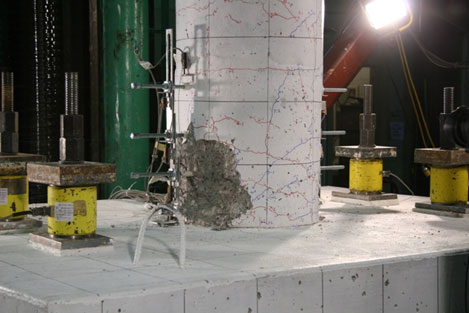
Figure 132. Photo. Specimen SF-2: the column fully spalled after cycle 8-1 (+4.28/-4.28 target drift ratio).
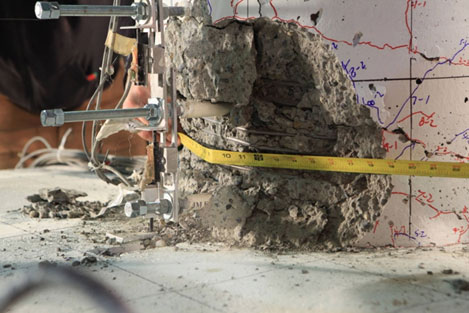
Figure 133. Photo. Specimen SF-2: first noticeable bar buckling was the N-NW bar in cycle 9-3 (+7.40/-7.40 target drift ratio).
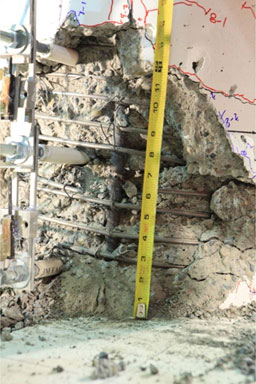
Figure 134. Photo. Specimen SF-2: N-NW bar fractured first when the column was being loaded to peak in cycle 10-2 (+10.65/-10.65 target drift ratio).
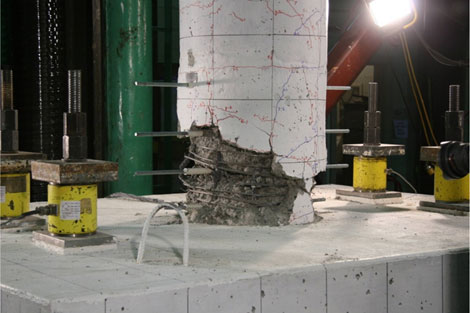
Figure 135. Photo. Specimen SF-2: damage after the cyclic testing.
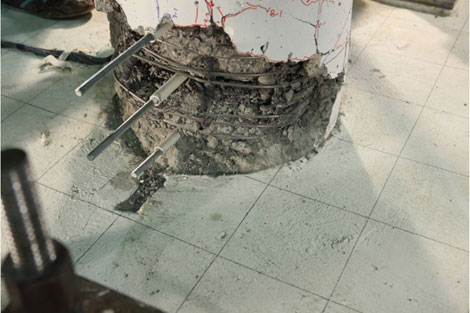
Figure 136. Photo. Specimen SF-2: no damage to the footing was observed after the cyclic testing.
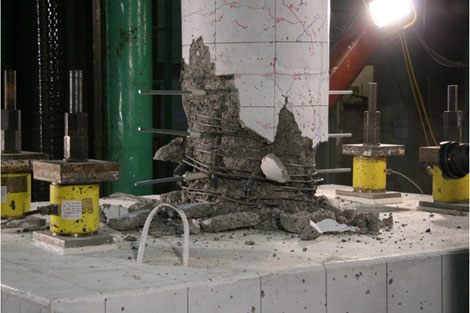
Figure 137. Photo. Specimen SF-2: damage the end of testing. The column crushed after application of vertical load of 819.5 kips.
Specimen SF-3
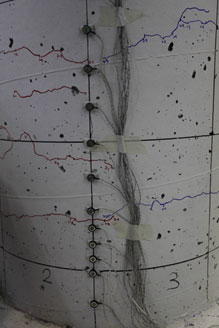
Figure 138. Photo. Specimen SF-3: significant horizontal crack in cycle 3-1 (+0.69/-0.69 target drift ratio).
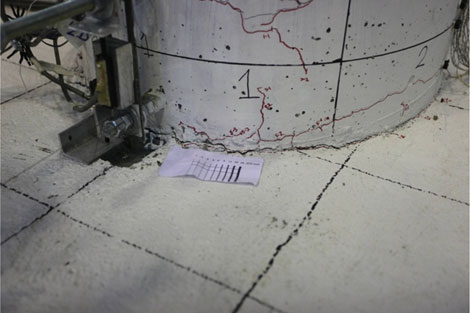
Figure 139. Photo. Specimen SF-3: separation at column-footing interface in cycle 5-3 (+1.72/-1.72 target drift ratio).
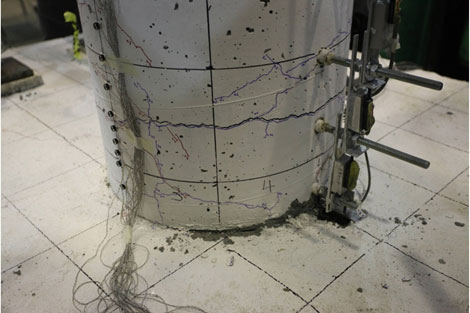
Figure 140. Photo. Specimen SF-3: first diagonal cracking in cycle 6-1 (+2.06/-2.06 target drift ratio).
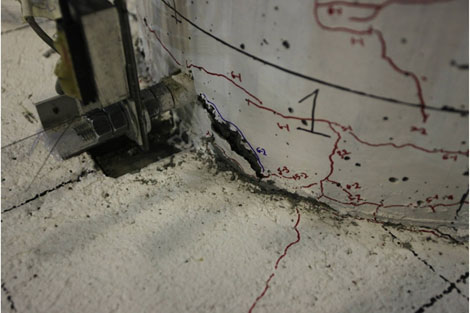
Figure 141. Photo. Specimen SF-3: first column spalling in cycle 6-2 (+2.48/-2.48 target drift ratio).
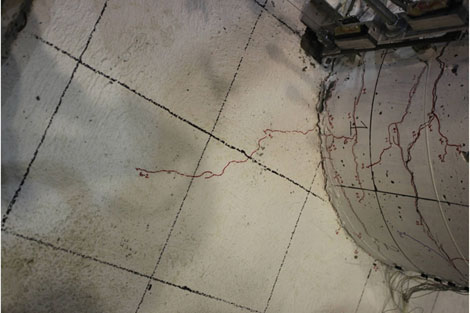
Figure 142. Photo. Specimen SF-3: radial footing crack propagation in cycle 6-2 (+2.48/-2.48 target drift ratio).
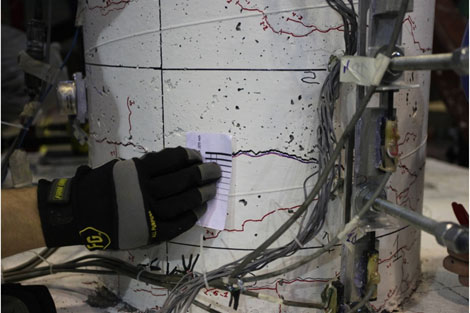
Figure 143. Photo. Specimen SF-3: large horizontal crack in cycle 6-2 (+2.48/-2.48 target drift ratio).
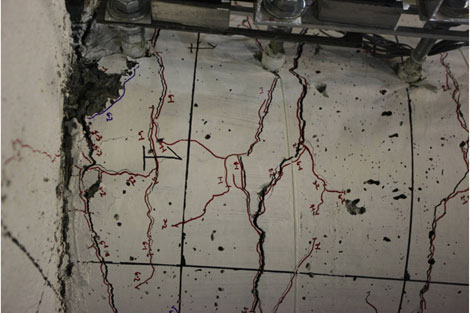
Figure 144. Photo. Specimen SF-3: large column flexural cracks occurring in cycle 7-2 (+3.57/-3.57 target drift ratio).
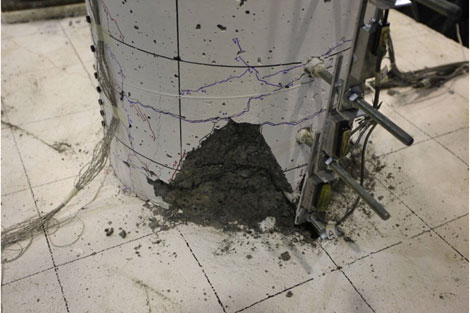
Figure 145. Photo. Specimen SF-3: full column spalling in cycle 9-1 (+6.16/-6.16 target drift ratio).
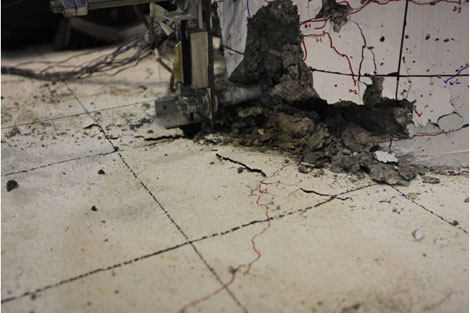
Figure 146. Photo. Specimen SF-3: first footing spalling in cycle 9-2 (+7.40/-7.40 target drift ratio).
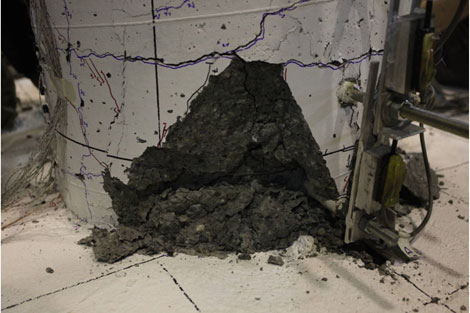
Figure 147. Photo. Specimen SF-3: transverse steel exposed in cycle 9-3 (+7.40/-7.40 target drift ratio).
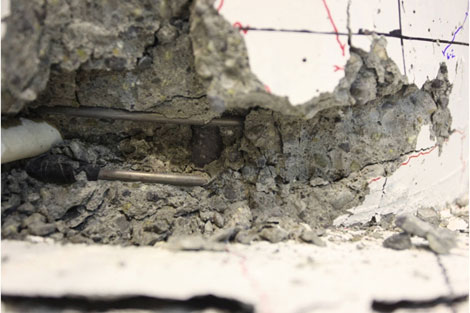
Figure 148. Photo. Specimen SF-3: first exposure of longitudinal reinforcement in cycle 9-3 (+7.40/-7.40 target drift ratio).
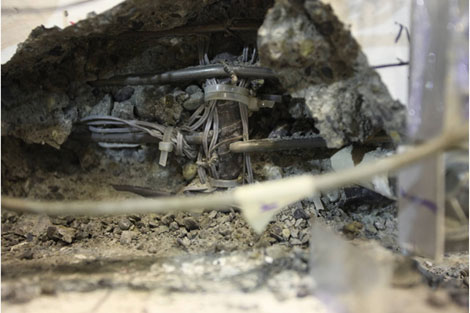
Figure 149. Photo. Specimen SF-3: fracture of transverse reinforcement in cycle 10-1 (+8.87/-8.87 target drift ratio).
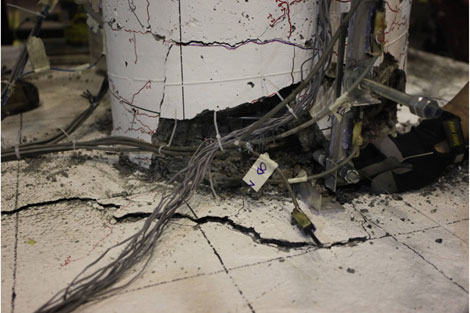
Figure 150. Photo. Specimen SF-3: major footing spalling occurring in cycle 10-1 (+8.87/-8.87 target drift ratio).
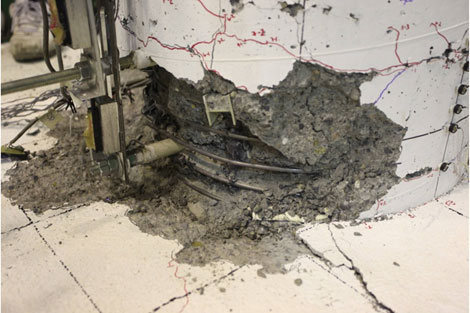
Figure 151. Photo. Specimen SF-3: major cracks in the concrete core in cycle 10-2 (+10.65/-10.65 target drift ratio).
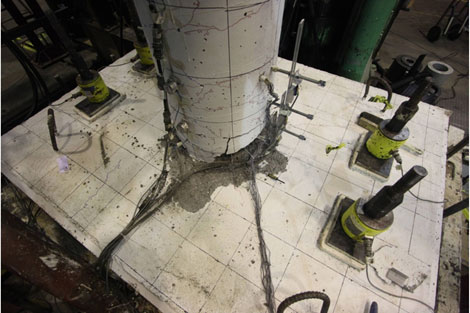
Figure 152. Photo. Specimen SF-3: condition of specimen just before last cycle.
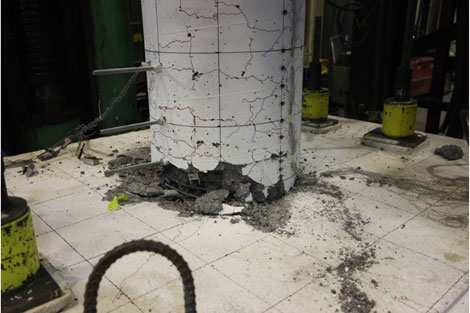
Figure 153. Photo. Specimen SF-3: column after punching through in last cycle (cycle 10-3, +10.65/-10.65 target drift ratio).
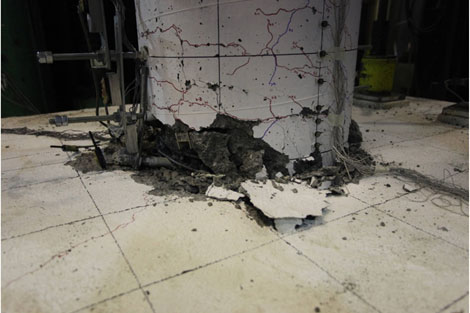
Figure 154. Photo. Specimen SF-3: column after punching though in last cycle (cycle 10-3, +10.65/-10.65 target drift ratio).