Instructors
Patrick DeCorla-Souza
P3 Program Manager
Center for Innovative Finance Support

Marcel Ham
Vice President
IMG/Rebel

P3-VALUE 2.0 Webinars
- P3: Public Private Partnership
- P3-VALUE 2.0: Analytical tool to help practitioners
understand processes used to quantitatively evaluate P3 options
- This is the second of five webinars on P3-VALUE
- P3 Evaluation Overview
- Value for Money Analysis (today)
- Project Delivery Benefit-Cost Analysis
- Risk Valuation
- Financial Viability Assessment
Webinar Outline
Part 1 Introduction
Part 2 Develop Public Sector Comparator
Part 3 Develop P3 Option and Compare to Public Sector Comparator
Part 4 Value for Money Analysis in P3-VALUE 2.0
Recap Summary of Webinar
Webinar Objectives
After this webinar you should be able to:
- List the various components of the Public Sector Comparator
(PSC) and P3 Option (P3)
- Describe the methodologies used to estimate the PSC and P3 Option
- Use the P3-VALUE 2.0 tool to perform a "high-level" Value for
Money analysis
Part 1: Introduction
Definitions
- Value for Money (VfM)
The optimum combination
of life cycle costs and quality of a good or service to meet the
user's requirements
- VfM Analysis
Quantitative analysis, expressed
as dollar or % difference
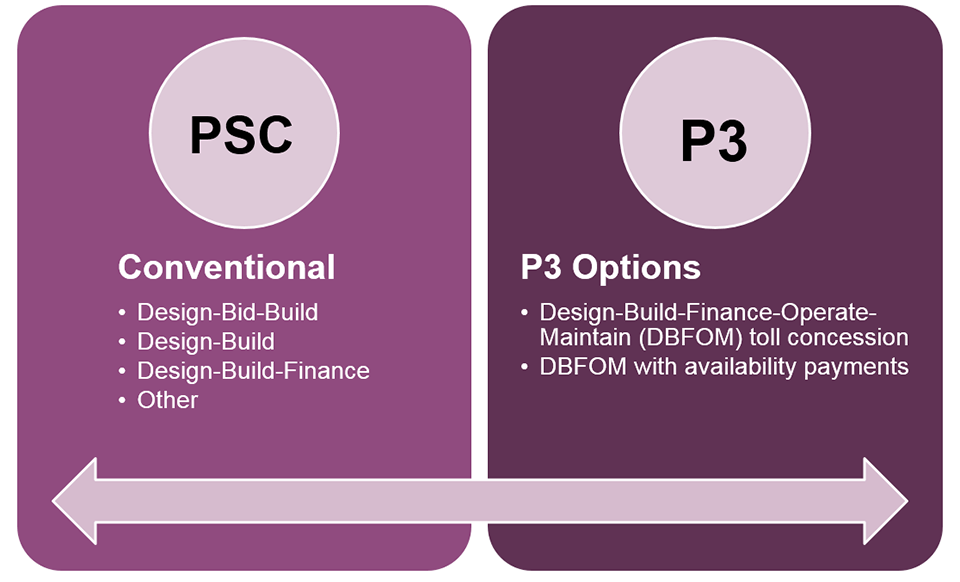
- Public Sector Comparator (or PSC)
Conventional
procurement's baseline cost against which P3 option will be compared
- P3 Option (or P3)
Net cost of P3 option
to Agency, including estimated payments to private partner as well
as other costs incurred by public sponsor
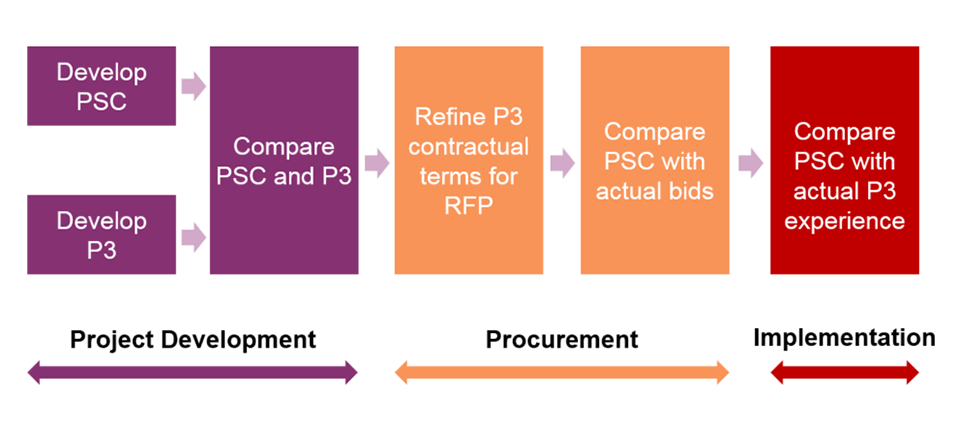
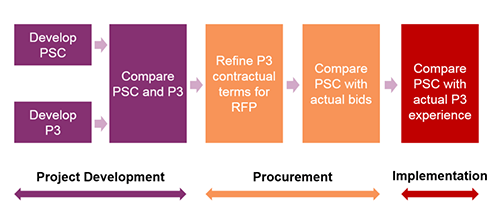
Timing of VfM Analysis
View full-size timing
chart
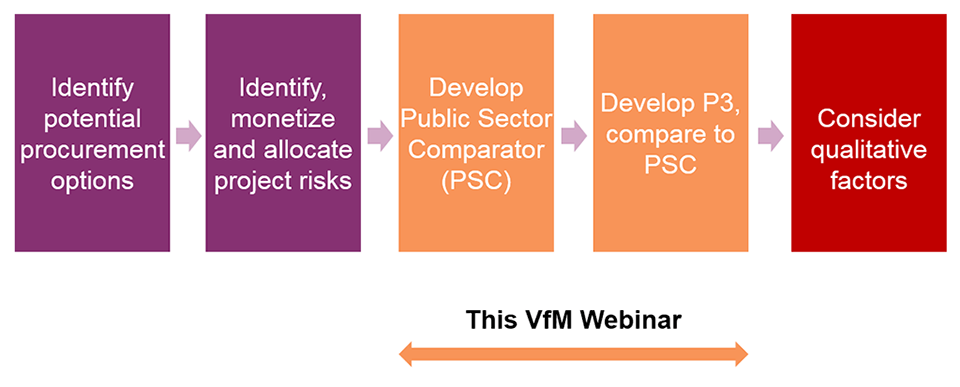
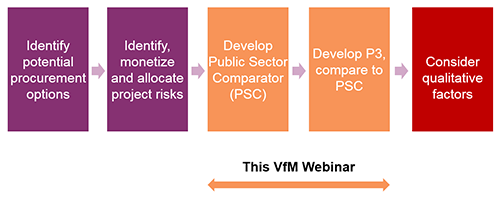
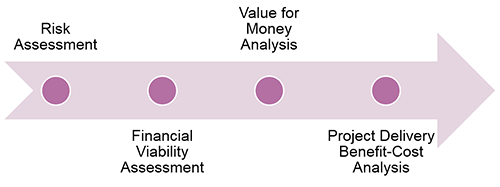
P3 Evaluation in Project Development
View full-size
P3 Evaluation in Project Development chart
1. Identify Procurement Options

View full-size Procurement Options
chart
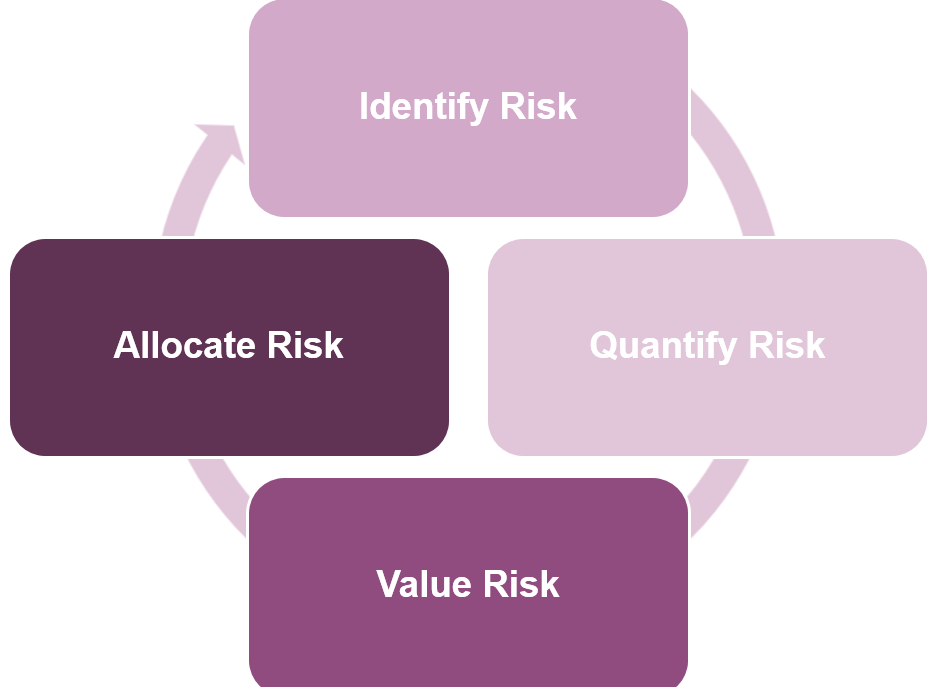
2. Risk Assessment and Allocation

View full-size
Risk Assessment and Allocation chart
3. Develop Public Sector Comparator
- Estimate present value of hypothetical, risk-adjusted costs
and revenues of conventionally procured project
- Assume project is completed to same scope and quality standards
as under P3 delivery
- Assume same timeframe as under P3 delivery
4. Develop P3 Option
Definition: Present value of net costs to Public
Agency for delivering same project as a P3
Components
- P3 contract payment
- Revenue to Agency (if any)
- Retained cost & risk
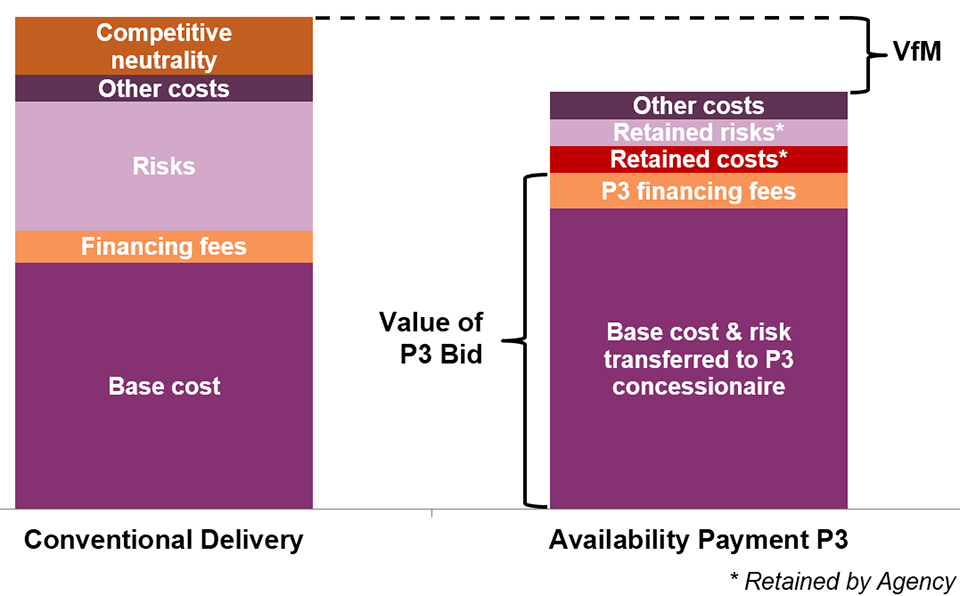
5. Compare PSC with P3

View full-size
comparison chart
6. Qualitative Assessment
- Considerations related to project goals:
- Additional (earlier) user benefits from acceleration
- Quality of service
- P3 contract-related considerations:
- Viability
- Performance
- Achievability
- Flexibility
Test Your Knowledge
True or False
- Value for Money analysis requires that the PSC have the same
scope as the P3, and be implemented in the same time frame as the
P3.
Questions
Submit a question using the chat box
Part 2: Develop Public Sector Comparator
Key Assumptions for PSC
- Same project scope as anticipated for P3 delivery
- Same quality standards as anticipated for P3 delivery
- Same time frame as anticipated for P3 delivery
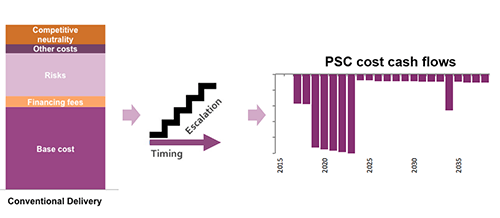
Components of PSC Estimate
- Base costs
- Design-Build phase
- Operations phase
- Risk values
- Base variability
- Pure risk
- Lifecycle performance risk
- Financing fees
- Other project costs
- Competitive neutrality
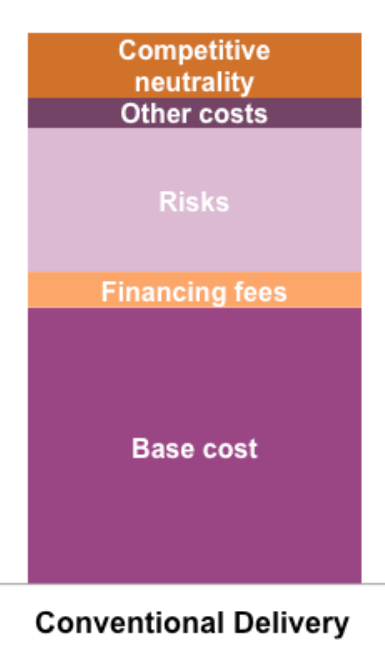
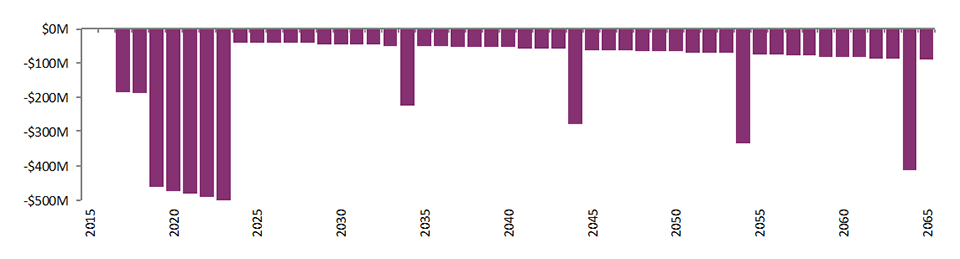
A. Base Costs
- Pre-construction and construction (capital) costs
- Operations cost
- Maintenance costs
- Reconstruction & rehabilitation costs
View full-size
Base Costs chart
B. Cost Impacts of Risk
- Base Variability
Example: Uncertainty in volume of asphalt
- Pure Risks
Example: Accident at construction site, causing
cost overrun and/or delays
- Lifecycle Performance Risks
Example: Conflicts between
DB and O&M contractors, supervening events exceeding liability caps,
inflation
C. Financing Fees on Public Debt
- Arrangement fees
- Commitment fees
- Swap fees
Note: Interest and principal payments are not included in financing
costs in the P3-VALUE model
D. Other Project Costs
- Procurement costs
- Monitoring & oversight costs
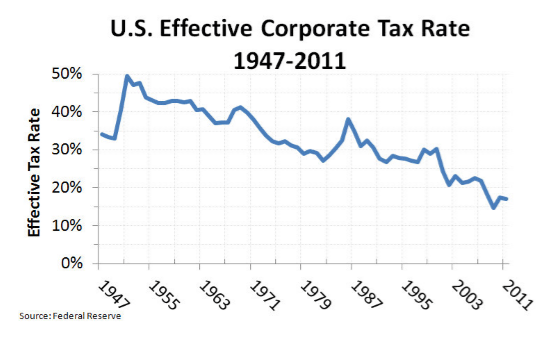
E. Competitive Neutrality Adjustment
- Adjustments made to PSC costs for tax liabilities and other
P3 costs to ensure apples-to-apples comparison
- Adjustments can include:
- Federal corporate tax to be received under P3
- State corporate tax to be received under P3
- Self-insurance cost (tort liability limits under public
operation favor public sector)
Perspective on Competitive Neutrality
| Perspective |
Competitive Neutrality Adjustment |
| Agency |
Ignore taxes from P3 that it does not receive? |
| State |
Ignore taxes paid to Federal government? |
| National |
Include subsidy cost for Federal loans and taxes paid to
Federal government? |
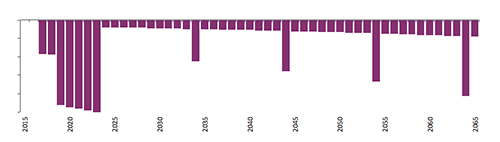
Timing and Escalation of Costs
- When discounting, timing of construction and operational expenses
is important due to the time value of money
- Cost must also be adjusted for inflation
View full-size
Timing and Escalation of Costs chart
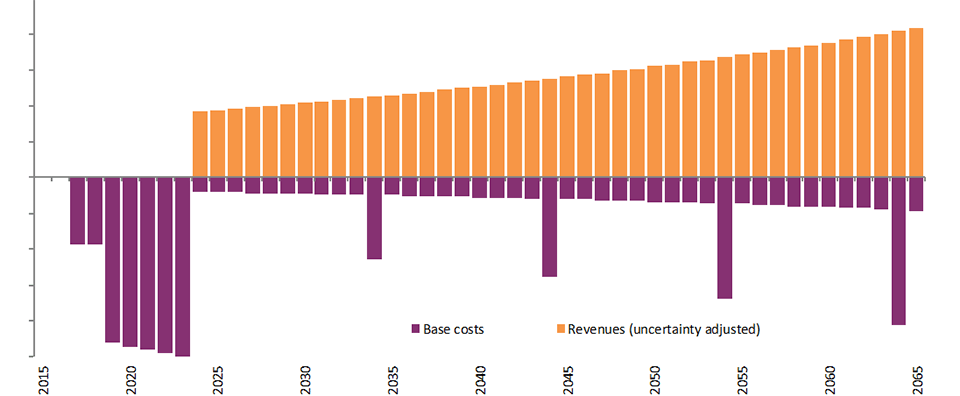
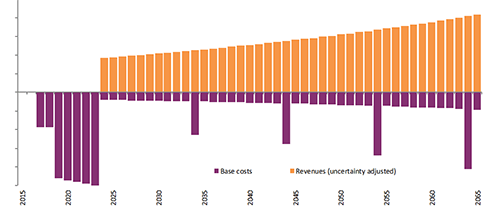
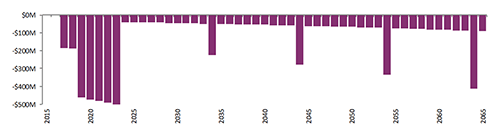
Add Toll Revenues
- If the road is tolled, toll revenues must be added to the PSC
cash flows
- Toll revenues should be adjusted for uncertainty (to be discussed
in webinar on risk)
View full-size
Toll Revenues chart
Discounting of Cash Flows
- Discounting converts future cost and revenue cash flows to "present
value" terms
- Discount rate reflects the time value of money
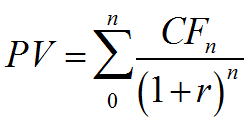
Where PV = Present Value
CFn = Cash Flow in year n
r = discount
rate
n = year
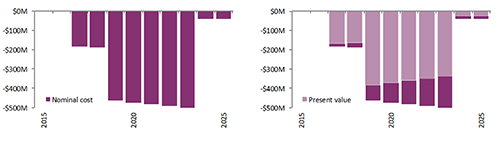
Effects of Discounting
- Cash flows later in a concession period will have a relatively
lower impact than earlier cash flows
View full-size
Effects of Discounting chart
Effect of Discount Rate
- Net present value is sum of all discounted cash flows
- A higher discount rate leads to a lower present value
View full-size
Effect of Discount Rate chart
Test Your Knowledge
Multiple answer
Which of the following are components of a PSC cost estimate in P3-VALUE
2.0:
- Construction costs
- O&M costs
- Financing fees
- Interest and principal payments
Questions?
Submit a question using the chat box
Part 3: Develop P3 Option and Compare to Public Sector
Comparator
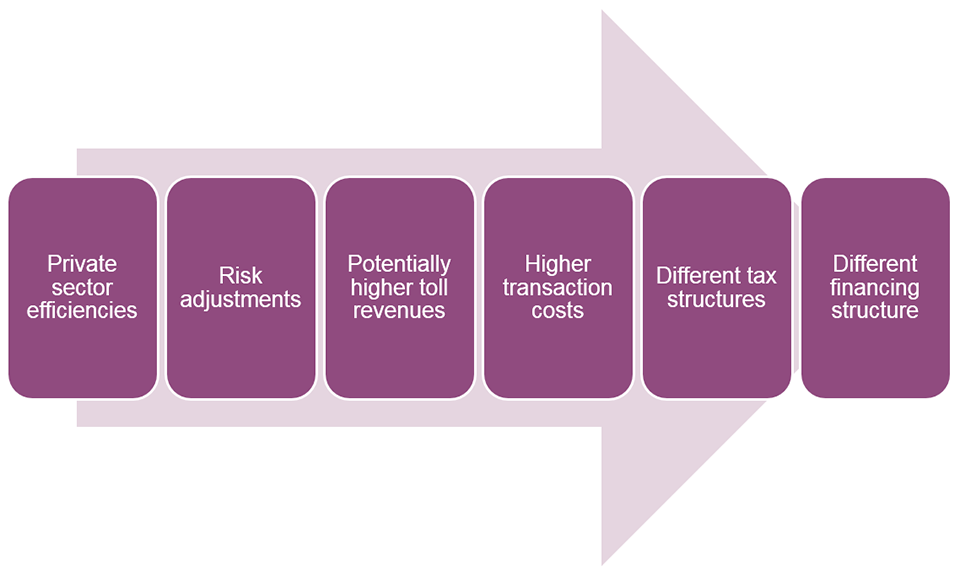
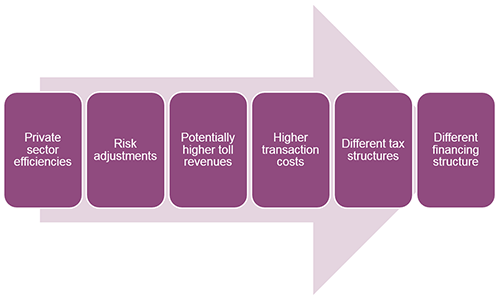
Process to Develop a P3 Option
View full-size
Process to Develop a P3 Option chart
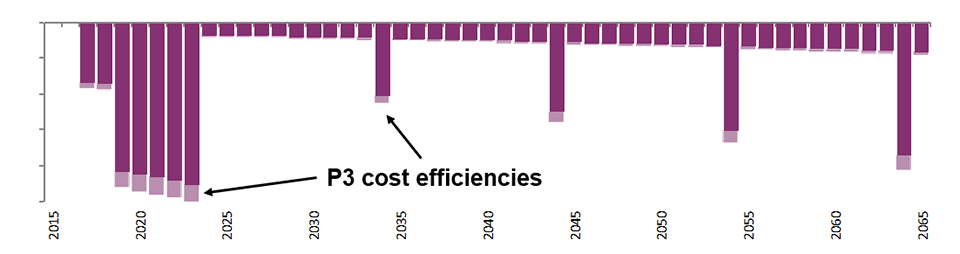
1. Private Sector Efficiencies
- Timing: Delayed start and/or accelerated construction
- Complex P3 contracting may delay project start
- P3 concessionaire may be financially incentivized to shorten
construction period
- Costs: Lifecycle costing may reduce overall
construction, operation and maintenance costs
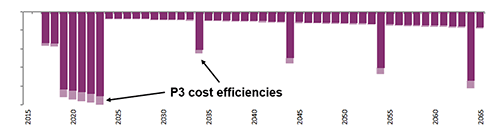
View full-size
Private Sector Efficiencies chart
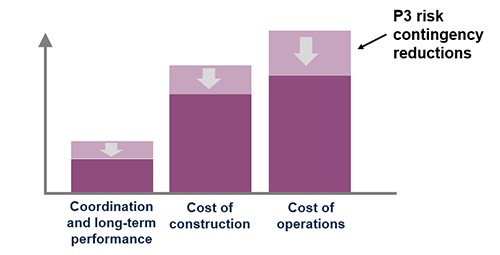
2. Costs of Transferred Risks
- Transferred risks include risks pushed down to subcontractors
- Efficient P3 risk management may reduce overall risk valuation
and contingencies
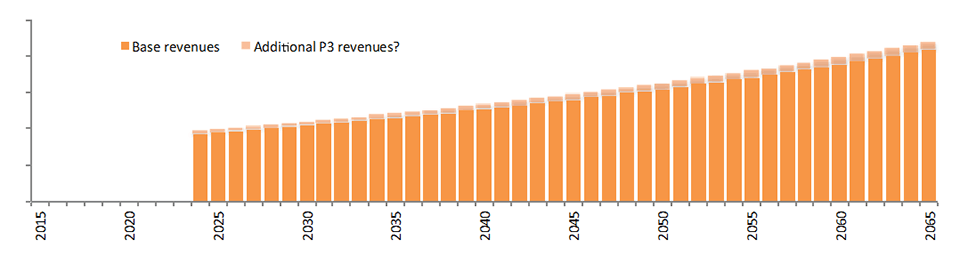
3. Possible Higher Toll Revenues
- P3 may lead to innovations such as improved access which could
have an impact on toll revenues
- P3s may carry out a more aggressive marketing campaign, resulting
in a faster ramp-up of traffic

View full-size
Higher Toll Revenues chart
4. Higher Transaction Costs
Public transaction costs:
- Develop a complex tailored P3 contract
- Oversight and monitoring of P3 concessionaire
Private transaction costs:
- Prepare bid and obtain financing
- Lengthy preparation process
- Oversight and monitoring
5. Different Tax Structure
- Concessionaire takes on additional (federal and state) tax liabilities
that would not exist under conventional delivery
- Subcontractors are subject to taxation as well, but this may
be the same as under conventional delivery
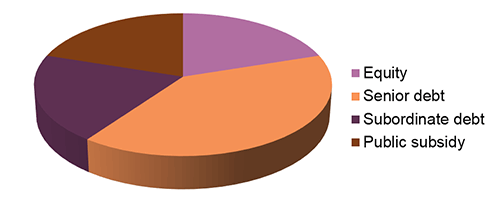
6. Different Financing Structure
P3 typically uses a combination of equity, debt and public subsidy
Estimating P3 Contract Payments
A P3 bidder will determine its desired P3 contract payments (the
"Bid") based on:
- Base lifecycle costs
- Valuation of transferred risks
- Available subsidies and financing costs
P3-VALUE 2.0 iteratively determines the required up-front subsidy
or concession fee (for toll concessions) or availability payment (for
AP concessions) to satisfy the debt terms and required equity return
- To be covered in Financial Viability Assessment webinar
Public Agency Costs under P3
Under P3, the public Agency will incur the following costs:
- Payments to P3 concessionaire
- Retained costs
- Value of retained risks
- Other costs
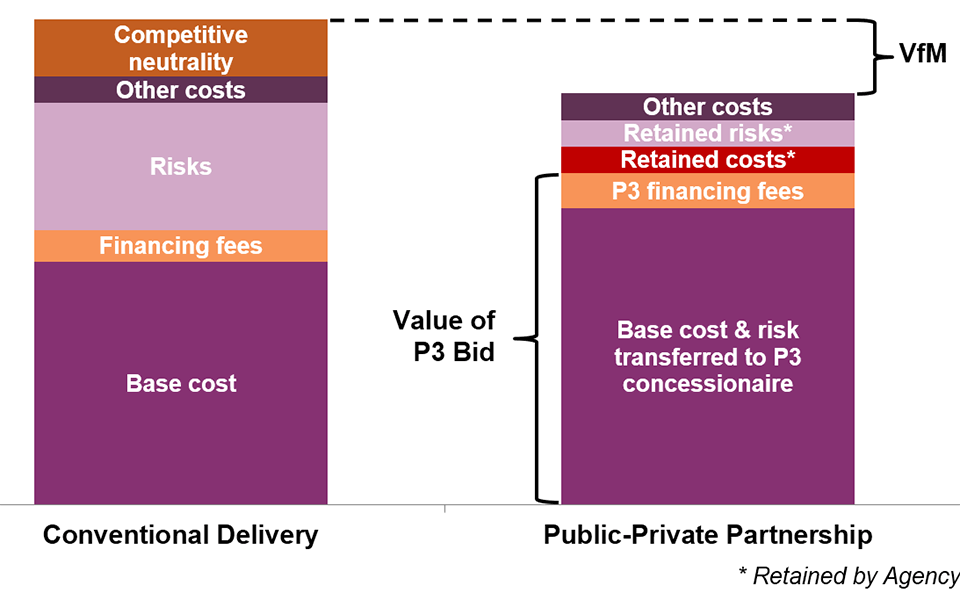
Compare PSC with P3

View full-size
comparison chart
Test Your Knowledge
Multiple answer
In an Availability Payment concession, which of the following are
included in the calculation of the public agency's payments to the
P3 concessionaire:
- Estimated base lifecycle costs of the concessionaire
- Costs of risks transferred to the concessionaire
- Toll revenues
Questions
Submit a question using the chat box
Part 4: Value for Money Analysis in P3-VALUE 2.0
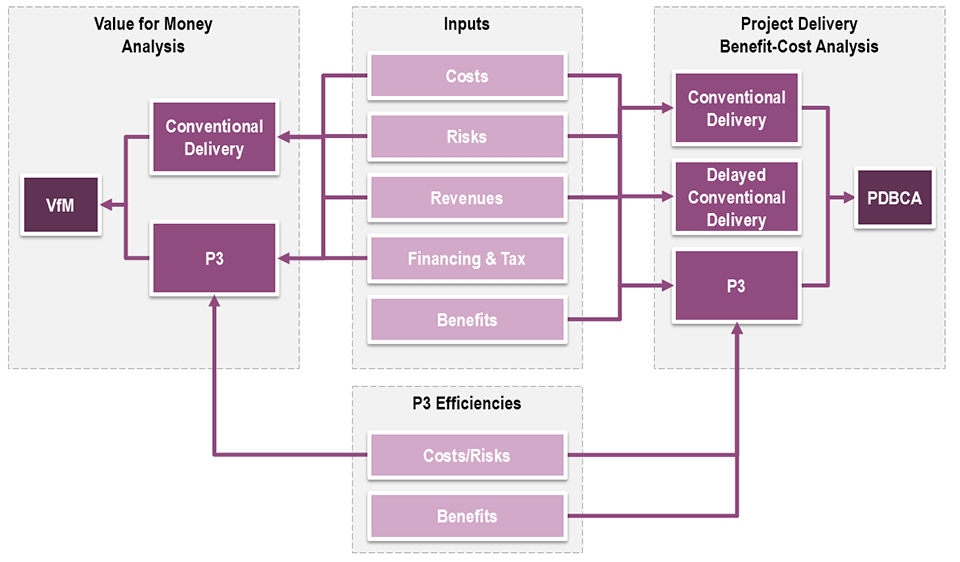
FHWA's P3-VALUE 2.0

View full-size
P3-VALUE 2.0 chart
Training Modules
Training Navigator User Interface
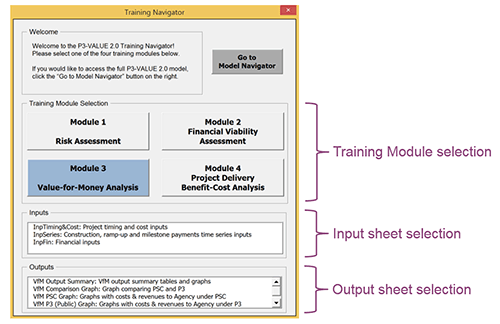
View full-size
User Interface graphic
Demonstration of VfM Module
Please stand by as we open the Excel file
Tool and References
Webinar Summary
Webinar Recap
Part 1 Introduction
Part 2 Develop Public Sector Comparator
Part 3 Develop P3 Option and Compare to Public Sector Comparator
Part 4 Value for Money Analysis in P3-VALUE 2.0
Upcoming P3-VALUE Training
- Homework review - Tuesday, February 16, at 2:00pm
- February 22 Project Delivery Benefit Cost Analysis
- March 7 Risk Valuation
- March 21 Financial Viability Assessment
To access the Homework Review webinar, please use the following link
and telephone number:
Resources
FHWA's Center for Innovative Finance Support Website:
https://www.fhwa.dot.gov/ipd/
P3 Website:
https://www.fhwa.dot.gov/ipd/p3/
Questions?
Submit a question using the chat box