Instructors
Patrick DeCorla-Souza
P3 Program Manager
Center for Innovative Finance Support

Marcel Ham
Vice President
IMG Rebel

P3-VALUE 2.0 Webinars
- P3: Public Private Partnership
- P3-VALUE 2.0: Analytical tool to help practitioners
understand processes used to quantitatively evaluate P3 options
- This is one of a series of webinars on P3-VALUE
- P3 Evaluation Overview (January 25, 2016)
- Value for Money Analysis (February 8, 2016)
- Value for Money Exercise (Feb. 16, 2016)
- Project Delivery Benefit-Cost Analysis (Feb. 22)
- Project Delivery BCA Exercise (Feb. 29, 2016)
- Risk Valuation (today)
- Financial Viability Assessment
Webinar Outline
Part 1 - Categorizing Risk
Part 2 - Risk Management Process
Part 3 - Pure Risk Assessment
Part 4 - Lifecycle Performance and Revenue Uncertainty
Risk Assessment
Part 5 - Risk Allocation
Part 6 - Using P3-VALUE 2.0 for Risk Assessment
Summary
Webinar Objectives
After taking this course you should be able to:
- Categorize P3 risks
- List the steps in the risk management process
- Explain the methods for quantifying and monetizing various type
of risks
- Describe the risk allocation process
- Use P3-VALUE 2.0 to perform risk assessment
Part 1 - Categorizing P3 Risks
Purpose of Risk Assessment
- To calculate value of risks
- To design draft agreement for RFP
- To assist in negotiation with bidders
- To develop risk management plans
Financial Impacts of Project Risks
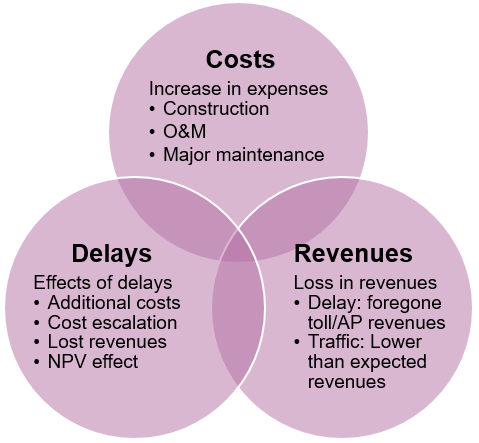
Costs
- Increase in expenses
- Construction
- O&M
- Major maintenance
Delays
- Effects of delays
- Additional costs
- Cost escalation
- Lost revenues
- NPV effect
Revenues
- Loss in revenues
- Delay: foregone toll/AP revenues
- Traffic: Lower than expected revenues
Categories of Risk
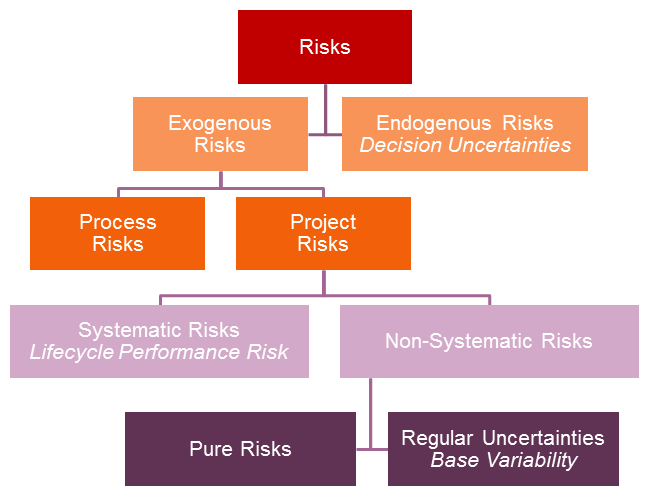
View
larger version of the Categories of Risk flow chart
P3-VALUE 2.0 Project Risk Categories
- Base Variability
Example: Uncertainty in volume of asphalt
- Pure Risks
Example: Accident at construction site, causing cost
overrun and/or delays
- Lifecycle Performance Risks & Revenue Uncertainty
Example: Conflicts between DB and O&M contractors,
supervening events exceeding liability caps, inflation, T&R
risk (for toll concessions)
Valuing Base Variability
- Typically a percentage of costs (+ or - variation)
- May differ by project phase
- Reflects the uncertainty in cost estimates - will reduce as
the design level becomes more detailed
- P3-VALUE 2.0 uses a factor (percentage of base cost) to estimate
cost impact
- Example:
- Base variability: 20% of construction cost
- Construction cost: $200M
- Value of base variability: 20% X $200M = $40M
Who Bears Project Risks in a P3?
Includes both systematic and some non-systematic risks
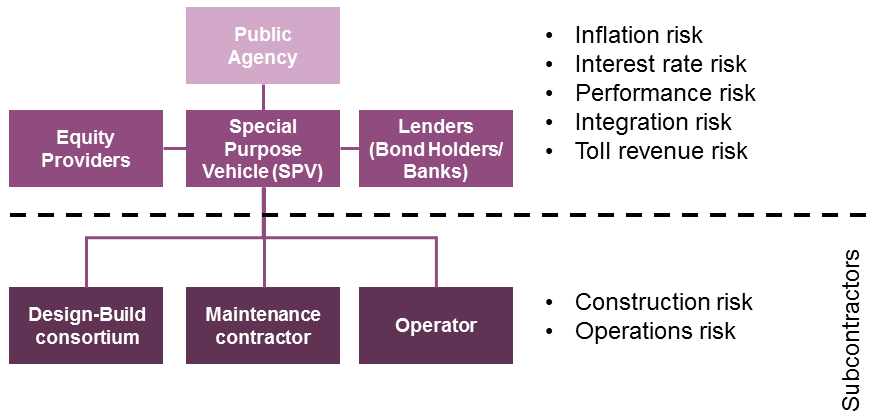
View
larger version of the Project Risks chart
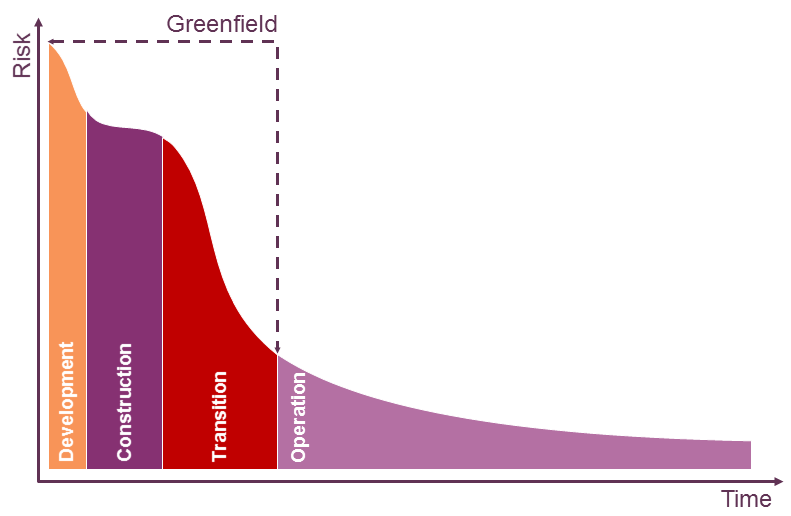
Risk through Project Completion
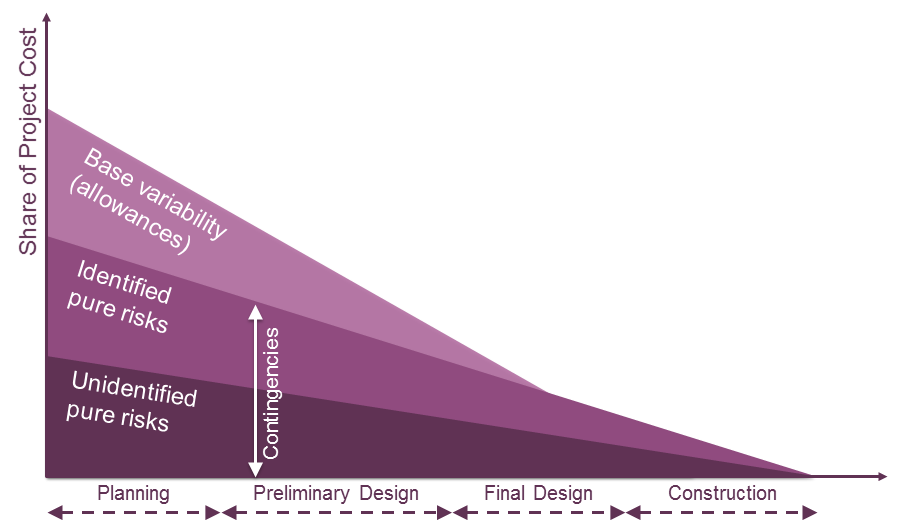
View
larger version of the Risk through Project Completion chart
Risk over Project Life
View
larger version of the Risk over Project Life chart
Audience Feedback
True or False
- All project risks are pushed down to subcontractors of the concessionaire.
Questions?
Submit a question using the chat box
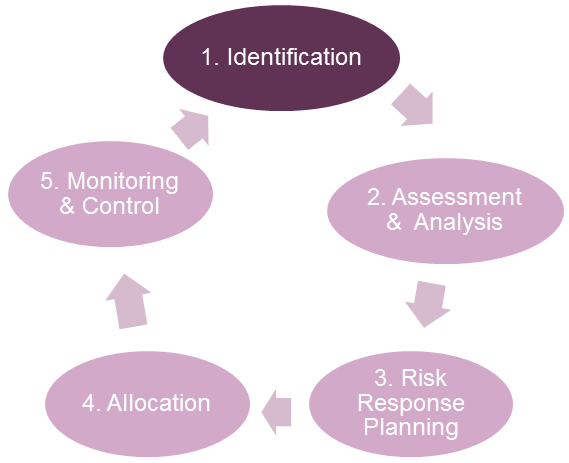
Part 2 - Risk Management Process
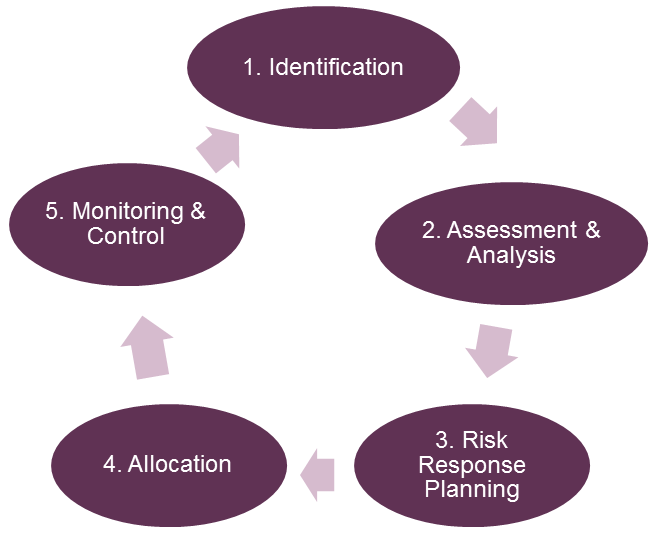
1. Risk Identification
Risks:
Risk Workshops
- Who?
- Facilitator
- Subject matter experts
- What tools are used?
- Risk checklist
- Risk register
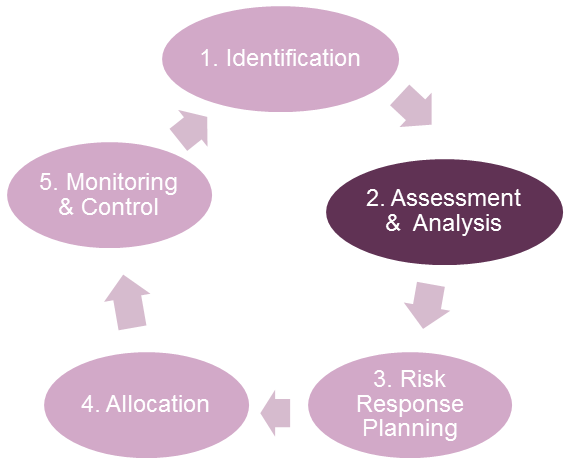
2. Risk Assessment
- Probability
- Potential consequences
- Cost
- Schedule
- Scope/Quality
- Revenue
- Value
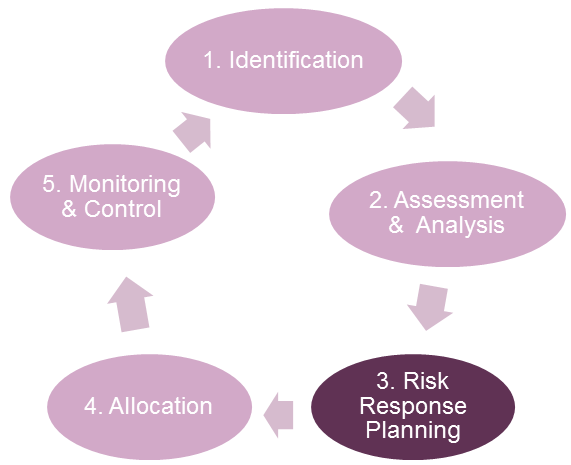
3. Risk Response Planning
Risk Response Strategies
- Avoid
- Mitigate
- Transfer/Share
- Accept
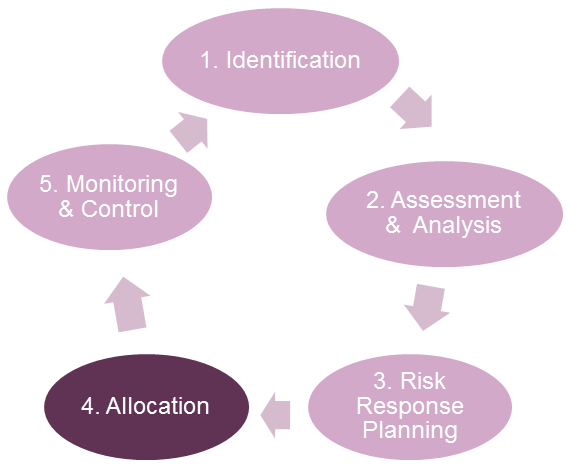
4. Risk Allocation
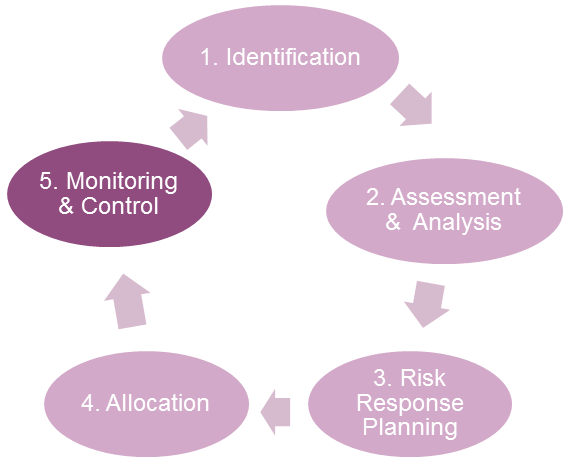
5. Risk Monitoring & Control
- Performance metrics to monitor risk
- Understand P3 risk management provisions
- Avoid taking back transferred risks
- Validate previous risk identification, risk assessment, and
risk response planning
Audience Feedback
True or False
- The probability and potential consequences of a specific risk
must be quantified in order to estimate its cost impact
Questions?
Submit a question using the chat box
Part 3 - Pure Risk Assessment
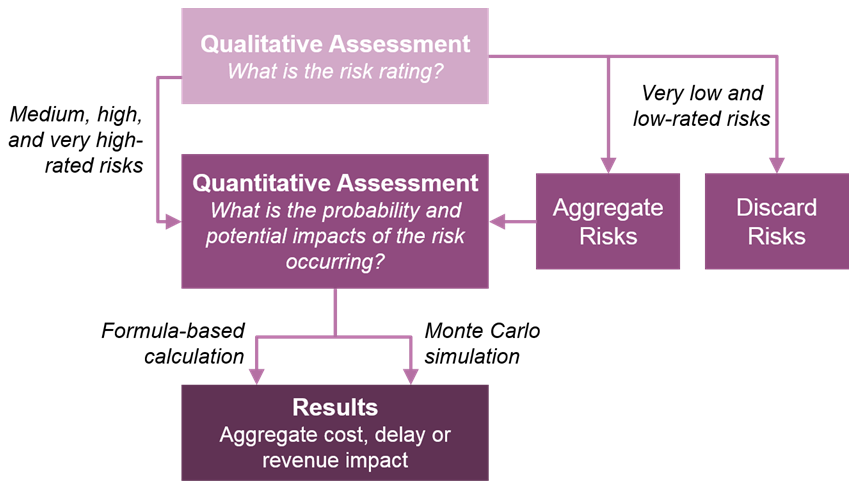
View
larger version of the Risk Assessment flow chart
Qualitative Assessment
- Probability of risk occurrence
- Very low
- Low
- Medium
- High
- Very high
- Scale of impact if risk occurs
- Very low
- Low
- Medium
- High
- Very high
Qualitative Assessment Matrix
Example
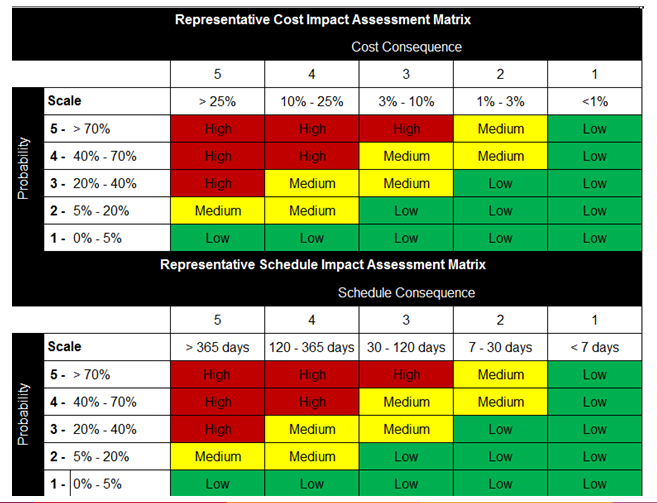
View
larger version of the example Assessment Matrix table
Quantitative Assessment
- Probability of risk occurrence
- % probability (0% - 100%)
- Scale of impact if risk occurs
- Dollar amount or number of days of delay
Valuing Pure Risks (Formula-Based)
- Risk Value = Probability X Impact (distribution)
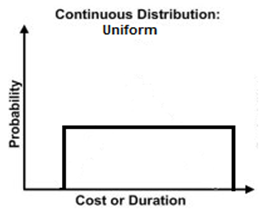
- Example for uniform probabilistic impact distribution:
- Probability of occurrence: 10%
- Minimum impact: $2M
- Maximum impact: $4M
- Value = 10% x ½ x ($2M + $4M) = $0.3M
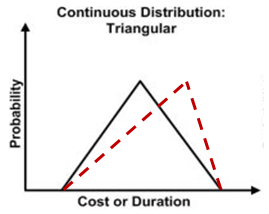
Valuing Pure Risks (Formula-Based)
- Risk Value = Probability X Impact (distribution)
- Example for triangular impact distribution:
- Probability of occurrence: 10%
- Minimum impact: $2M
- Maximum impact: $4M
- Most likely impact = $3.5
- Value = 10% x ($2M + 3.5 + $4M)/3 = $0.32M
Aggregate of Pure Risks
- Central limit theorem can be used if pure risks are independent:
- Distribution of the sum of a sufficiently large number of
independent random variables is approximately normal
- To apply central limit theory, variance and mean value of each
individual risk must be calculated and added
Central Limit Theorem Applied
Example using uniform risk distributions (P3-VALUE 2.0)
| Risk Item |
Probability A |
Most likely Impact B |
Most likely value C = A x B |
Minimum value D |
Maximum
value E |
Shape |
| Risk 1 |
20% |
$10,000k |
$2,000k |
-20% |
+50% |
Uniform |
| Risk 2 |
25% |
$4,000k |
$1,000k |
-20% |
+50% |
Uniform |
| Risk 3 |
50% |
$4,000k |
$2,000k |
-20% |
+50% |
Uniform |
| Risk Item |
Minimum value F = C - D% |
Maximum value G = C + E% |
Mean value* H = ½ x (F + G) |
Variance*
I = (G - F) 2 / 12 |
| Risk 1 |
$1,600k |
$3,000k |
$2,300k |
$163,333k |
| Risk 2 |
$800k |
$1,500k |
$1,150k |
$40,833k |
| Risk 3 |
$1,600k |
$3,000k |
$2,300k |
$163,333k |
| Total |
$4,000k |
$7,500k |
$5,750k |
$376,500k |
- Mean value: $5,750k, standard deviation of $606k
- Using Excel NORMINV function, P70 risk value: $6,068k
Valuing Pure Risks (Monte Carlo)
Monte Carlo simulation
- Simulation of large number of scenarios based on probabilities
of risk occurrence and probability distribution of magnitude of
impact
- Result is a probability distribution of aggregate risk value
- Provides estimates at confidence levels
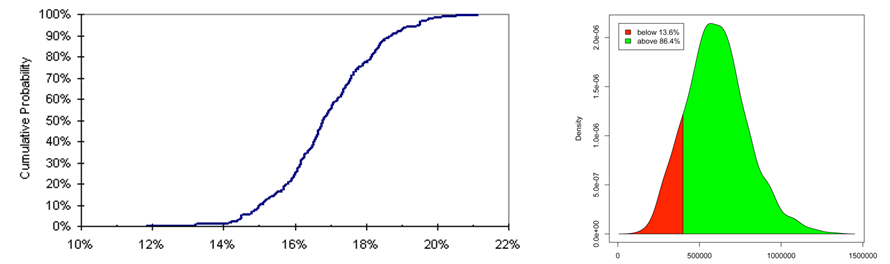
View
larger version of the Monte Carlo simulation charts
Audience Feedback
True or False
- The aggregate impact of pure risks on costs may be estimated
either by using a formula-based method or by using Monte Carlo simulation.
Questions?
Submit a question using the chat box
Part 4 - Assessment of Lifecycle Performance Risk and
Revenue Uncertainty Adjustment
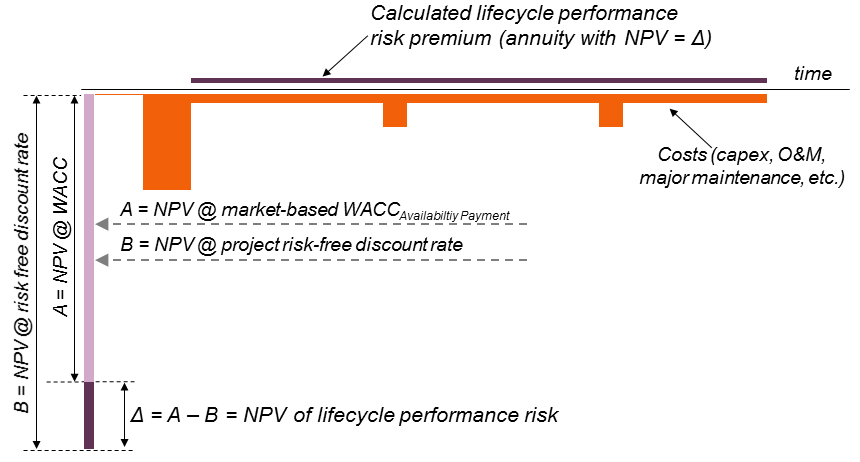
Valuing Lifecycle Performance Risks
Ways to value lifecycle performance risk
- Use information available to Agency on lifecycle performance
risk costs/cash flows
- Use market-based P3 financing conditions as a proxy to determine
the value of lifecycle performance risk
Market-based valuation:
- Calculate NPV of cost cash flows*, excluding financing:
- Using a market-based weighted average cost of capital (WACC)
that excludes revenue risk (Availability Payment WACC)
- Using project risk-free discount rate
- Calculate difference in NPVs (Δ = A - B )
* Use PSC cash flows for PSC lifecycle performance risk, and
P3 cash flows for P3 lifecycle performance risk (used only in PDBCA
and risk outputs)
Lifecycle Performance Risk Valuation
View
larger version of the Lifecycle Performance Risk Valuation chart
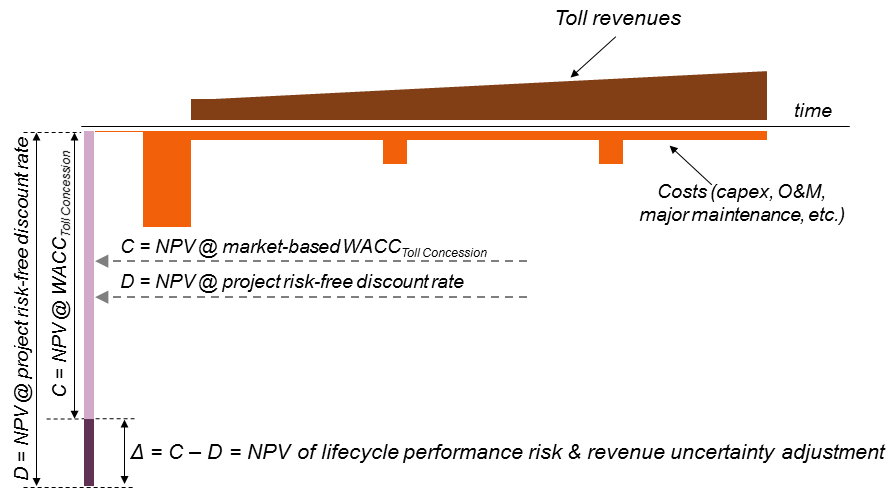
Valuing Revenue Uncertainty
Ways to value revenue uncertainty
- Apply percentage haircut to P50 traffic/revenues
- Use market-based P3 financing conditions as a proxy to determine
the value of revenue uncertainty
Market-based valuation:
- Calculate NPV of revenue and cost cash flows, excluding financing:
- Using a market-based weighted average cost of capital (WACC)
that includes revenue risk
- Using project risk-free discount rate
- Calculate difference in NPVs (Δ = C - D), which equals
the lifecycle performance risk and revenue uncertainty adjustment
combined
- NPV of revenue risk is the difference between this Δ and
the lifecycle performance risk calculated previously
Revenue Uncertainty Adjustment
View
larger version of the Revenue Uncertainty Adjustment chart
Accounting for Risk in P3-VALUE 2.0
| Risk Type |
VfM PSC |
VfM P3 |
PDBCA PSC |
PDBCA P3 |
| Base variability |
✔ |
✔ |
✔ |
✔ |
| Pure risk |
✔ |
✔ |
✔ |
✔ |
| Lifecycle performance risk |
✔ |
|
✔ |
✔ |
| Revenue risk |
✔ |
|
|
|
Risk Analysis Challenges
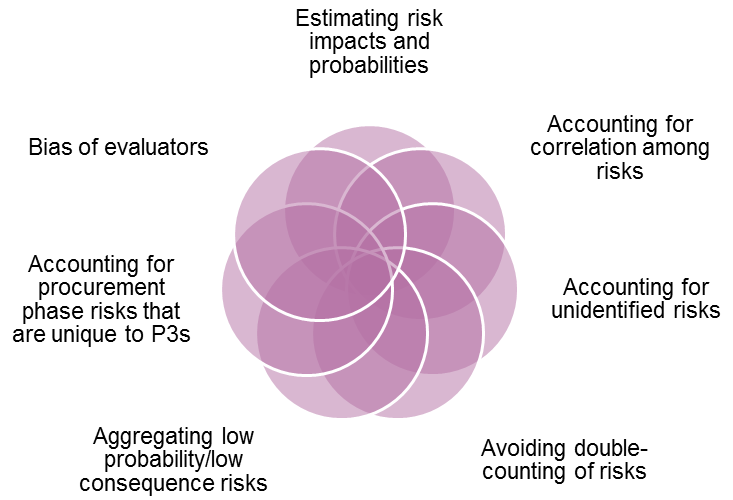
View
larger version of the Venn Diagram of Risk Analysis Challenges
- Estimating risk impacts and probabilities
- Bias of evaluators
- Accounting for procurement phase risks that are unique to P3s
- Accounting for correlation among risks
- Accounting for unidentified risks
- Aggregating low probability/low consequence risks
- Avoiding double-counting of risks
Test Your Knowledge
True or False
- The WACC for a toll concession includes a risk premium that
accounts for revenue risk as well as for lifecycle performance risks
Questions?
Submit a question using the chat box
Part 5 - Risk Allocation
Risk Transfer by Delivery Type
| Procurement Type |
Design Risk |
Construction Risk |
Financial Risk |
O&M Risk |
T&R Risk |
| Design-Build (DB) |
✔ |
✔ |
|
|
|
| Design-Build-Finance (DBF) |
✔ |
✔ |
✔ |
|
|
| Design-Build-Finance-Operate-Maintain (DBFOM) with Availability
Payment |
✔ |
✔ |
✔ |
✔ |
|
| Design-Build-Finance-Operate-Maintain (DBFOM) with Toll
Concession |
✔ |
✔ |
✔ |
✔ |
✔ |
Typical DBFOM Risk Allocation
| Risk |
Design-Bid-Build |
Availability Payment DBFOM |
Toll Concession DBFOM |
| Design errors |
Public |
Contractor |
Contractor |
| Change in scope |
Public |
Public |
Public |
| Delay in permits |
Public |
Shared |
Shared |
| Delay in right-of-way acquisition |
Public |
Public |
Public |
| Construction cost overruns |
Contractor |
Contractor |
Contractor |
| Construction risks |
Contractor |
Contractor |
Contractor |
| Archeological findings |
Public |
Public |
Public |
| Delay in relocation of cables & pipes |
Public |
Contractor |
Contractor |
| Unknown ground conditions |
Public |
Contractor |
Contractor |
| Hazardous materials |
Public |
Shared |
Shared |
| Security |
Public |
Contractor |
Contractor |
| Major maintenance cost overruns |
Public |
Contractor |
Contractor |
| Snow & ice removal cost overruns |
Public |
Contractor |
Contractor |
| Regular maintenance |
Public |
Contractor |
Contractor |
| Traffic information systems |
Public |
Public |
Public |
| Incident management |
Public |
Contractor |
Contractor |
| Toll revenue risk |
Public |
Public |
Contractor |
| Financing risks |
Public |
Contractor |
Contractor |
| Force majeure |
Public |
Shared |
Shared |
Risk Allocation Steps
| Step 1: Likelihood |
Which party is best able to control the likelihood
of the risk occurring? |
| Step 2: Impact |
Which party is best able to control the impact
of the risk? |
| Step 3: Lowest Cost |
Which party is best able to absorb the risk
at lowest cost if the likelihood and impact cannot be controlled?
|
Transferred Risks
- Transferred risks include risks pushed down to subcontractors
- Efficient P3 risk management may reduce overall risk valuation
and contingencies
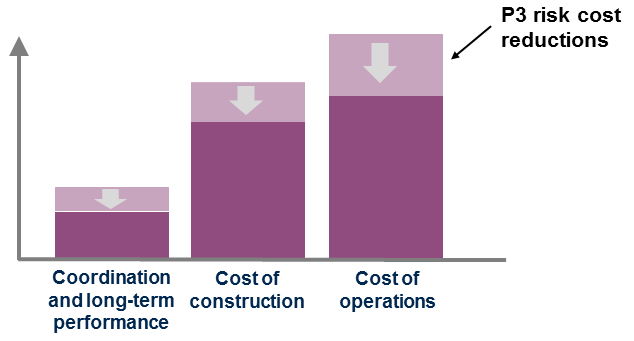
View
larger version of the Transferred Risks chart
Example Tunnel Project
| Risk Category |
Risk Allocation |
| Public |
Private |
Shared |
| Political |
✔ |
|
|
| Financial |
|
✔ |
|
| Traffic and Revenue |
✔ |
|
|
| Right of Way |
✔ |
|
|
| Planning and Permitting |
|
|
✔ |
| Utilities |
|
|
✔ |
| Procurement |
✔ |
|
|
| Construction |
|
✔ |
|
| Operations and Maintenance |
|
✔ |
|
| Handback |
|
✔ |
|
| Force Majeure |
|
|
✔ |
| Change in Law |
✔ |
|
|
| Geotechnical |
|
|
✔ |
Test Your Knowledge
True or False
- The public agency's goal in risk allocation should be to transfer
all risks to the private partner in a P3.
Questions?
Submit a question using the chat box
Part 6 - Using P3-VALUE 2.0 for Risk Assessment
FHWA's P3-VALUE 2.0
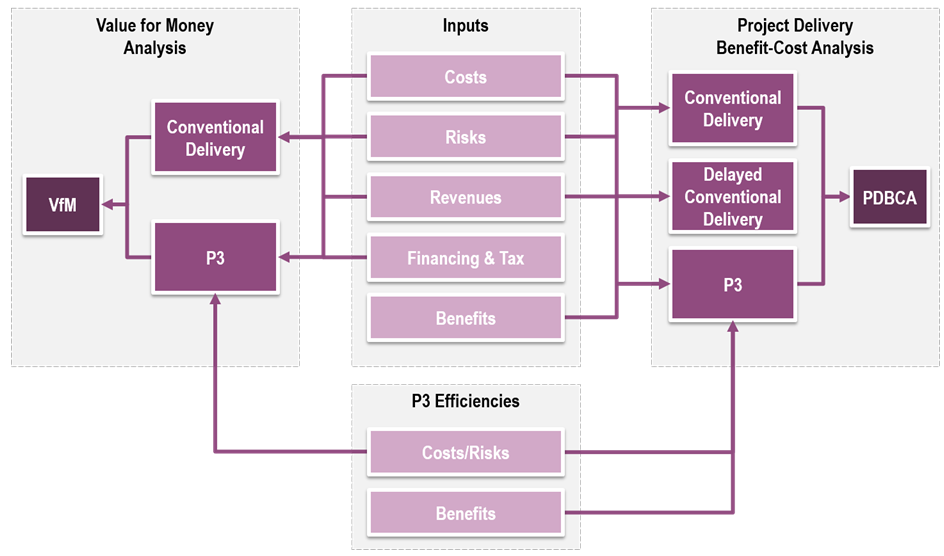
View
larger version of the P3-VALUE 2.0 process chart
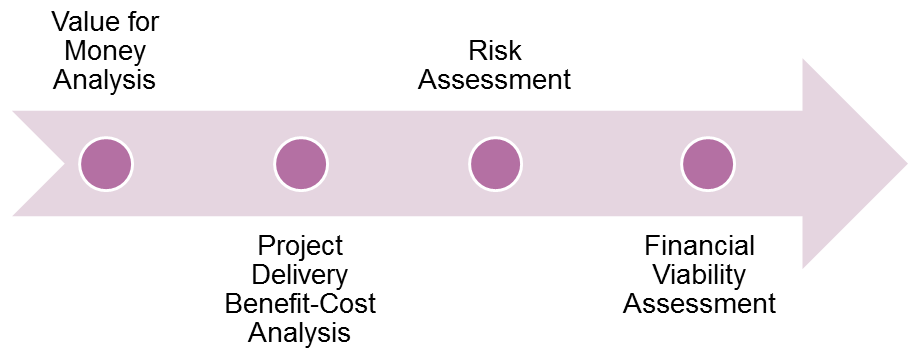
Training Modules
- Value for Money Analysis
- Project Delivery Benefit-Cost Analysis
- Risk Assessment
- Financial Viability Assessment
 Training
Navigator User Interface
Training
Navigator User Interface
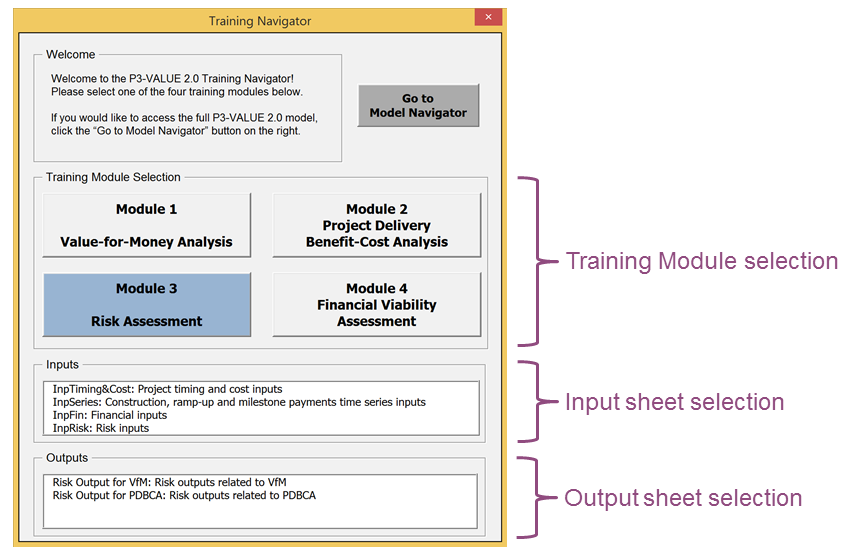
View
larger version of the User Interface screen
Demonstration of Risk Module
Please stand by as we open the Excel file
Questions?
Submit a question using the chat box
Webinar Summary
Webinar Recap
Part 1 - Categorizing Risk
Part 2 - Risk Management Process
Part 3 - Pure Risk Assessment
Part 4 - Lifecycle Performance and Revenue Uncertainty Risk Assessment
Part 5 - Risk Allocation
Part 6 - Using P3-VALUE 2.0 for Risk Assessment
Tools and References
Upcoming P3-VALUE Training
Exercise review - March 14 at 12:30pm EST
- March 21 Financial Viability Assessment
- Exercise instructions may be downloaded from the web room
- Technical assistance options:
- To access the Exercise Review webinar,
please use the following link and telephone number:
- Link:
https://connectdot.connectsolutions.com/p3
- Telephone: 1-888-363-4749, Passcode:
6139168#
Resources
FHWA's Center for Innovative Finance Support Website:
https://www.fhwa.dot.gov/ipd/
P3 Website:
https://www.fhwa.dot.gov/ipd/p3/
Questions?
Submit a question using the chat box
Contact Information
Patrick DeCorla-Souza
P3 Program Manager
Center for Innovative Finance Support
Federal Highway Administration (202) 366-4076
Patrick.DeCorla-Souza@dot.gov


