


Tables
Figures
Figure 6-1 . Risk Valuation
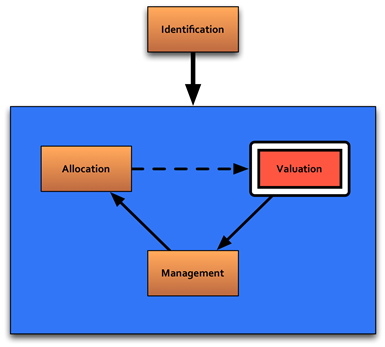
The purpose of risk valuation is to obtain an accurate value of the risks of the project in order to make well-informed financial decisions. Proper risk valuation is essential for determining the project's financial feasibility ("go or no-go" decision), and for comparing different delivery methods. Risk valuation also offers a quantified basis for choices on the best risk management strategy and risk allocation. In reverse, choices on the risk management strategy and risk allocation affect the expected value of risks (see Figure 6-1). This cyclical nature of optimization drives a risk valuation that is an iterative process utilizing new information when it becomes available.
Risk valuation is also one of the inputs for the VfM assessment. FHWA's VfM Assessment Guidebook describes how to make adjustments for differences in risk valuation between delivery methods.
The risk categorizations as discussed in chapter 3 and depicted in Figure 6-2 below are intended to facilitate risk identification based on the nature of the project, the different stages of the project, and different disciplines and perspectives. These categorizations can lead to long lists of risks. In general, guidance on risk valuation focuses on applying the commonly utilized probability x impact approach to all or part of these risks. This guidebook starts from the assumption that different categories of risks require different valuation methods, and that the simultaneous use of more than one valuation approach can increase the reliability of information.
The first relevant distinction is between exogenous and endogenous risks. Exogenous risks are caused by external events. An accident at a construction site is an example of an exogenous risk. Endogenous risks are caused by the project stakeholders themselves; the decision to change the design of the project is an example of an endogenous risk. From the perspective of valuation, this is a useful distinction because endogenous risks are not part of the risk valuation, but are rather choices made that can affect costs.
Figure 6-2 . Risk Categorization
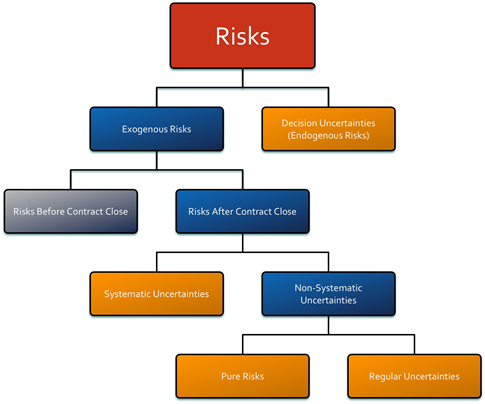
The second distinction is between risks before contract close and risks after contract close. The distinction between these categories is tied to the point at which the effective risk transfer begins and the public agency commits to the project and the contract. Typically, during the development and procurement of a project the people involved will be able to identify many risks before contract close because these often occur in the short term. Therefore the long-list of risks will include many of these risks, which typically will not need to be valued. From the perspective of valuation, this is a useful distinction because risks before contract close are typically not part of the risk valuation but still require effective risk management.
A third distinction is between systematic and non-systematic uncertainties. Systematic uncertainties are risks that are related to changes in the economic climate. Examples are inflation, interest rate, and revenue risk for toll projects. These risks are, by definition, not manageable by a single actor but can be diversified in a portfolio strategy. Non-systematic uncertainties are not related to economic conditions and are considered to be manageable to some extent through risk management (either of risk occurrence or undesirable outcome). Examples of this are accidents at the construction site or adverse weather impacts. Natural disasters also fall under this category. Apart from the fact that there are different methods for risk valuation for each respective category, this distinction also helps in placing risk with the partner best able to manage or minimize the impact of the risk.
In the non-systematic uncertainty category distinctions are made between:
Table 6-1. offers a categorization that can assist in selecting the valuation method.
Table 6-1. Risk Categories Linked to Valuation Method
| Category | Example | Description | |
|---|---|---|---|
| 1. | Decision uncertainties | Change in toll technology | Uncertainties affecting the project (scope) and caused by the project stakeholders themselves |
| 2. | Risks before contract close | Delay in go decision on project due to elections | Potential project-related events with a chance of occurrence and a negative impact; mainly present before the project starts |
| 3. | Systematic uncertainties | Inflation risk | Uncertainties in cost, revenue, and risk estimates; related to market circumstances |
| 4. | Pure Risks | Accident at construction site | Potential project-related events with a chance of occurrence and a negative impact (a loss, catastrophe, or other undesirable outcome), leading to an expected valuation |
| 5. | Regular uncertainties | Uncertainty in volume of asphalt | Uncertainties in cost, revenue, and risk estimates, not related to market circumstances but instead to intrinsic lack of certainty |
As was mentioned in the previous chapters, a P3 transfers risks normally retained by the public agency in the conventional delivery method to private parties. Unfortunately these risks are not always easy to identify and value. They include risks associated with long-term quality (related to the performance regime) and interfaces between project elements (road sections, crossings, arterials, and exits) and project phases (design, construction, maintenance, and operations). If the goal of the risk assessment is to determine the project's feasibility or to compare delivery methods, it is important to include all of these risks in the analysis as well.
A recent guidebook on risk assessment tools by the Transportation Research Board (TRB) 8Â describes the following issues relating to unidentified risks:
At any stage in the development of a project, cost estimates will be composed of three components for which there are differing amounts of information: 1) known and quantifiable costs; 2) known but not quantified costs; and 3) costs that are unknown and therefore cannot be quantified in advance. The base estimate includes the known and quantifiable costs. The contingency percentage is intended to include both the known but not quantified and the unknown costs.
A focus on identified risks - and not on unidentified risks - will invariably lead to project cost overruns. Also, these unknown risks distort the fairness of VfM assessments, because private-sector bids include a valuation of all transferred risks, but the public sector comparator (PSC) may not.
A way of dealing with "unknown-unknowns" is to utilize both a bottom-up and a top-down approach to risk identification and valuation. Most risk assessment methods are bottom-up approaches, because they focus on identifying and quantitatively assessing individual risks. A top-down approach focuses on the risk profile of the project as a whole, on the basis of a number of project characteristics. Appendix 4 provides an example of a simple tool to assess the overall risk profile of a project.
In some cases, a detailed quantitative risk assessment may not be meaningful. This occurs when a risk assessment is carried out in the very early stages of project development, when little quantifiable information about the project is available. In addition, when considering small and simple projects a detailed quantitative risk assessment may be unnecessary. In these cases, a qualitative top-down analysis - resulting in a quantitative assessment of the risk profile of the project as a whole-is sufficient.
In most cases a quantitative risk assessment is meaningful and necessary. Table 6-2. presents the most commonly used valuation methods for the different categories of risk.
| Category | Valuation Method | |
|---|---|---|
| 1. | Decision uncertainties | No valuation, just multiple scenario analysis |
| 2. | Risks before contract close | No valuation, just multiple scenario analysis |
| 3. | Systematic uncertainties |
|
| 4. | Pure risks |
|
| 5. | Regular uncertainties |
|
| Market-based markup for uncertainties |
Whereas the risks and uncertainties in the first two categories will not be valued, the acknowledgement of these categories is very relevant, because it facilitates the distinction between risks that matter and risks that do not matter in the overall risk register. In the following sections the focus will be on the last three categories.
Note that cost estimates typically include contingencies (covering pure risks) and allowances (covering regular uncertainties). In a VfM assessment the starting point is a raw PSC, based on cost estimates without any contingencies and allowances. This also helps prevent double counting of risks and uncertainties. Of course, the estimated contingencies and allowances can be an important source of information for risk valuation. Typically, the contingencies and allowances focus on construction, which is why one should verify to what extent these values are realistic reflections of all of the risks and uncertainties throughout the life cycle of the project.
Mr. Regan had initially used a top-down general risk valuation per category. Due to the characteristics of the project (brownfield, mono-functional, toll) the initial values were chosen as follows:
However, now that the risk register has been developed, the risk manager wants to build a parallel bottom-up valuation of all risks. He starts by categorizing all the risks in the register. The results for risks 14-21 are provided below.
| Risk | Category | |
|---|---|---|
| 14 | Toll authorization procedure delayed. | Decision uncertainty |
| 15 | Governor decides to change scope because of local interests. | Decision uncertainty |
| 16 | Cost increase because of rising oil prices. | Systematic uncertainty |
| 17 | A concrete truck hits a construction worker. | Pure risk |
| 18 | Vandalism during operations period. | Pure risk |
| 19 | Leakage in excavation for tunnel during construction. | Pure risk |
| 20 | Decision makers unavailable during election period. | Decision uncertainty |
| 21 | Uncertainty in cost estimates due to preliminary stage of design. | Regular uncertainty |
For each risk, a valuation method is determined. The results are shown below for risks 14-21.
| Risk | Valuation method | |
|---|---|---|
| 14 | Toll authorization procedure delayed. | NA |
| 15 | Governor decides to change scope because of local interests. | NA |
| 16 | Cost increase because of rising oil prices. | Valuation based on market data (trend and volatility), include in probability analysis |
| 17 | A concrete truck hits a construction worker. | Insurance premium |
| 18 | Vandalism during operations period. | Probability and frequency of occurrence. Cost of cleaning |
| 19 | Leakage in building excavation for tunnel during construction. | Insurance premium |
| 20 | Decision makers unavailable during election period. | NA |
| 21 | Uncertainty in cost estimates due to preliminary stage of design. | Probability analysis (see appendix 3) |
Systematic uncertainties can be dealt with in a similar fashion as regular uncertainties, which is not uncommon for toll revenues. Another approach is to reflect the risk profile in the discount rate. The establishment of the appropriate discount rate for a project is covered in appendix 2.
For the cost increase due to rising oil prices, Mr. Regan uses market data from the U.S. Energy Information Administration (EIA), which publishes the relevant statistics. 10Â The site provides data on average price and volatility. These numbers will be used in the probability analysis.
Ms. Brown hires a highly qualified traffic and revenue (T&R) expert to develop robust traffic and revenue forecasts for the I-13 project. She requests that they also develop a probability analysis for the forecast. The probability analysis shows a high uncertainty in project revenues, particularly because this is a managed lanes project. In order to value this risk, Mr. Regan suggests two approaches to valuing the risk:
Mr. Regan discovers that the outcomes of both analyses are not exactly the same. After discussing this with the project team, Ms. Brown decides to use the market-based discount rate to reflect the toll revenue risk, mainly because: (1) the team found that the two approaches lead to similar risk values; (2) the team feels there is no reason to price this risk differently from the market price; and (3) this will enable the team to make a fair and easy-to-explain comparison between the PSC and shadow bid.
The pure risk category is expected to contain the bulk of the risks from the long list in the risk register. Therefore, it is useful to distinguish between top-down methods to deal with the valuation of all risks in this category and bottom-up methods to value individual risks. The methods complement each other.
To get an indication of overall risk valuation, this category can be valued by benchmarking the project with similar projects. This is the same as assuming that the specific risks in this category are still unknown, but that it is expected that some risks will occur, and therefore a financial buffer is to be applied. Usually, this valuation method consists of a percentage of the total direct and indirect investment costs. This percentage can be in the range of 15% to 50% depending upon project characteristics and complexity, and cost estimation methods.
For the detailed (bottom-up) valuation, there are several methods to value each risk. The most important are: calculation of probability multiplied by damage for each risk; use of insurance premiums for individual risks or packages of risks; and cost estimates of risk mitigation measures.
The team concludes that some risks are typically covered by insurance, such as construction site accidents. Mr. Regan asks an insurance specialist to provide up-to-date quotes for these risks. The insurance will usually cover a bundle of risks and not one specific risk. After gaining this information, the risk register is adjusted accordingly. As soon as the risk is insured, and there is no risk remaining, this risk is considered "managed" and becomes a cost rather than a risk.
Typically, this risk category includes uncertainty about the volume and price estimates for different cash flows such as capital expenditures, operational costs, and revenues. Estimate uncertainties about the pure risks can also be included in this category.
The typical valuation method is to develop a probability distribution on the basis of expert inputs for minimum, most likely, and maximum values. In addition, the expert will identify the distribution type as normal, lognormal, triangular, uniform, or discrete (which are the most common types). This leads to an overall probability distribution of the net present value (NPV) of all project cash flows together. Depending on the risk appetite of the stakeholder, a certain probability level is then accepted. Selecting probability levels between 70% (P70) and 90% (P90) is common practice. It is generally recommended that P70 be used as a starting point. The difference between the most likely NPV, and the NPV at this probability level, is considered to be the value of this risk category. Appendix 3 discusses probability analysis in further detail.
Some of the risks in the risk register lead to project delays. The team decides to perform a probability analysis on the project's completion date using these project delay risks. The P50 value turns out to be two months later than the original completion date. The P10 value lies one month before the original completion date, and the P85 is a full 12 months late. The team decides to use the P50 as a new baseline and develops three different methods to value this risk:
The team decides to use the first valuation method. They use this value to transform the schedule's probability analysis into financial values. The team believes the 10 month difference between P85 and P50 is a fair reflection of the value of this risk, thus valuing it at $3 million in real terms. The timing of the risk is at the completion date. Escalation of the risk value is the average index for all construction costs.
A risk assessment often focuses on risks that inflict a negative impact, because cost and revenue estimates tend to assume no major drawbacks. In reality, there is a possibility that cost and revenue values may turn out to be better than expected. In the probability analysis this is reflected in the minimum and maximum value for cash flows, leading to overall probability distributions expressing the uncertainty in cash flows. Although the value of that uncertainty is still a negative cash flow, it accounts for the fact that there can also be an upside. (The value of uncertainty is always negative because uncertainty is the potential deviation from expected value 11).Therefore, in theory, there can also be positive pure risks. If that is the case, these can be dealt with in the same way negative pure risks are dealt with. It is recommended to always check whether any positive risks can be expected.
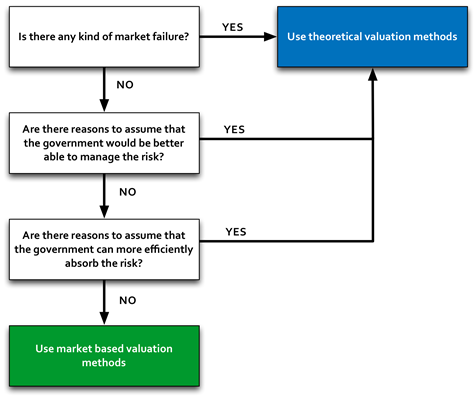
Choosing the proper valuation method may be challenging. To further guide practitioners, the following three principles can be used:
Figure 6-3. Valuation Method Decision Tree
Not all agencies value risks in the same way. This risk tolerance needs to be taken into account in the risk valuation. For instance, an agency that owns a large number of buildings might decide to forego buying fire-insurance. This is because the insurance premium could be more expensive for the agency than just accepting the risk of fire and subsequently accounting for the possible costs of damage. If the chances of a fire are 1 in 100 per year and the agency owns 100 buildings, then it is statistically probable that every year one building will suffer from a fire incident. Purchasing insurance might be disadvantageous in this case if it is more expensive to insure 100 buildings due to advisory fees. However, for an agency owning only one building the converse is likely to be true because this agency is not "diversified." The undiversified agency would place a higher value on the specific risk.
Another example is a company that produces products in Europe, but exports and sells to customers in the United States. This company is exposed to currency risk because it has liabilities in euros and generates revenues in dollars. This is different from a U.S.-based company that sells only to local customers, and thus has no such risk.
In general, the risk tolerance of an agency depends on the total portfolio of projects and its ability to effectively diversify the risks.
Workshops for risk valuation are just as useful as they are during the risk identification phase. They should include experts from each of the major fields of expertise relevant to the project.
Purpose of the workshops: Valuation of risks is a crucial element in risk assessment, and has a major effect on financial feasibility and VfM analysis. The risk assessment coordinator must therefore consciously organize a professional project valuation process.
Timing: The risk assessment coordinator can convene a workshop for risk valuation or gather input in one-on-one meetings. A workshop has the advantage of better coordination between experts assessing potentially overlapping risk areas and therefore mitigates the possibility of double-counting risks.
Information: In the early stage of project development, the risk assessment coordinator may decide that the prioritization assessment is sufficiently thorough. In that case, the question is whether the information is up-to-date and complete. As a rough indication, the median of the bandwidth in each category can be used for the probability x impact calculation.
In a risk valuation workshop participants can be asked to individually determine the probability value and impact value, in terms of cost, revenue, and/or schedule. The participants may also define minimum and maximum values of the impact, and a distribution type, on the basis of which a Monte Carlo analysis can be performed with specialized software. Appendix 3 describes how to perform a probability analysis in more detail.
Cost estimation experts may be asked to come up with:
It is important to precisely define the scope of the contingency, allowance, and mark-up estimates to prevent any possibility of double counting.
Insurance experts may be asked to provide market-based insurance premiums. They may also be asked for their expert opinion on market liquidity and whether or not they believe there is any market failure or reason to assume that the insurance premium does not reflect the value of the risk. Here it is also very important to precisely define the scope of the applicable insurance policy, to prevent double counting.
Finance experts may be asked to come up with a reliable indication of the "risk-free" discount rate and a project-specific risk premium. In order to do so, these experts may need to develop a simplified financing model, reflecting both the project characteristics (most importantly construction cost, construction schedule, and repayment schedule) and the expected financing conditions (most importantly financial leverage, debt service coverage ratio, interest rates, and return on equity). A detailed discussion on the determination of the discount rate is addressed in appendix 2, and FHWA's Value for Money guidebook discusses a method to calculate a "virtual insurance premium" that may be used to represent certain risks in cash flows.
Expertise: Since the outcomes of financial feasibility analyses and VfM analyses will be extremely sensitive to the risk valuation, the risk assessment coordinator should involve the best experts available from the following fields: technical experts, cost estimation experts, traffic and revenue experts, insurance experts, and finance experts.
These experts should also be involved in the project risk identification to make sure that everyone has a good understanding of the specific risks.
The output of the risk valuation is typically:
The risk valuation provides input for the risk management strategy and for the risk allocation. Also, the risk valuation provides input for the VfM assessment. The risk adjustments that are made for the different delivery methods are described in FHWA's VfM Assessment Guidebook.
8. Transportation Research Board. Guidebook on Risk Analysis Tools and Management Practices to Control Transportation Project Costs. National Cooperative Highway Research Program (NCHRP) Report 658. June 2010.
9. See Appendix 2 for further discussion on the Capital Asset Pricing Model.
10. www.eia.gov
11. For example, if you have two choices: (1) a certain amount of $100,000; or (2) an uncertain amount between $80,000 and $120,000 that you would receive based on a normal distribution, you would prefer the first choice. This is why uncertainty has a negative value.