


Tables
Figures
The final step is the evaluation of the P3 delivery method by determining the incremental costs and benefits that can be attributed directly to P3 project delivery. P3 project delivery is different from conventional project delivery in terms of governance and incentive mechanisms, and reflects several value drivers, including:
The DOT estimates that these value drivers are likely to yield differences in timing, cost, quality and traffic demand, as listed in the Table below.
Table 3: State DOT Estimates of Expected Differences under P3 Delivery
| Impact Type | Impact | Change |
|---|---|---|
| Timing | Start date due to longer project preparation and procurement time | +12 months |
| Timing | Construction period | -36 months |
| Cost | Public transaction costs | +$10M |
| Cost | Private transaction costs | +$15M |
| Cost | Lifecycle costs (% change) | -20% |
| Quality | Pavement quality (International Roughness Index score change) | -35 |
| Quality | Lane unavailability due to work zone practices during construction phase | -5% |
| Quality | Lane unavailability due to work zone practices during operations phase | -7% |
| Quality | Delays due to improved incident response | -25% |
| Traffic demand | Tolled traffic during ramp up due to innovations and outreach activities | +5% |
The change in construction schedule will most likely increase the present value of costs since costs during construction are compressed in a shorter and earlier period. However, the earlier opening of the road will also result in an earlier accrual of benefits. The higher public and private transaction costs combined with the lower lifecycle costs would either increase of decrease total costs.
Improved pavement quality, fewer and shorter traffic disruptions during construction and O&M activities, and improved incident response would result in social benefits such as travel time savings, vehicle operating cost savings, and emission reductions.
A P3 concessionaire may also bring specific innovations and carry out outreach activities that increase traffic during the first few years of the project. Thus the project could benefit from a higher ramp up in traffic volumes than under conventional delivery. The value of benefits to the additional travellers can be calculated based on standard consumer surplus theory2.
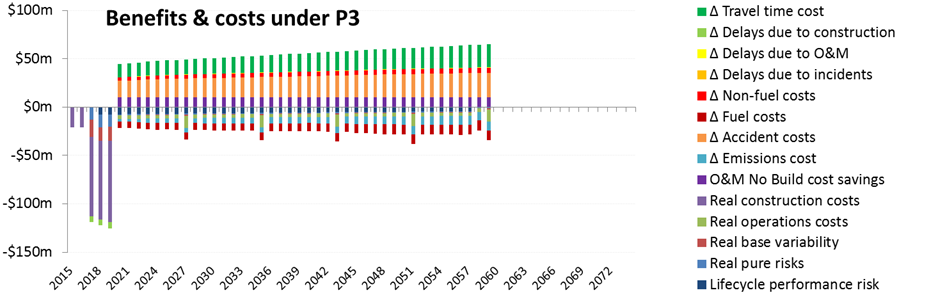
After the DOT has received bids for the project, it can evaluate (ex post) the benefits of scope and design optimizations that have traffic and cost impacts (including alternative technical concepts, a.k.a. ATCs) by using an updated traffic study that includes those optimizations. The stream of project benefits and costs under P3 delivery relative to No Build is illustrated in the Figure below.
Figure 5: P3 Project Benefits and Costs relative to No Build
View larger version of Figure 5
The DOT would estimate the expected direct benefits of P3 delivery (including timing, cost, quality and demand impacts) as shown in the Table below.
Table 4: Process to Estimate Net Benefits of P3 relative to Accelerated PSC
| Cost/benefit item | NPV ($) |
|---|---|
| Incremental benefits relative to No Build | I |
| No Build cost savings | J |
| Incremental costs relative to No Build | K |
| Total P3 benefits | Z = I+J-K |
| Total Delayed PSC benefits (from Table 1) | Y |
| Net P3 benefits relative to Accelerated PSC | Z - Y |
2 See 3. FHWA. Economic Analysis Primer. August 2003. Available at: https://www.webpages.uidaho.edu/~mlowry/Teaching/EngineeringEconomy/Supplemental/USDOT_Economic_Analysis_Primer.pdf