This Report on P3 Concessions provides a baseline tracking the evolution of the P3 sector in the United States in the 24 years since the award of the nation's first P3 - the Teodoro Moscoso Bridge in San Juan, Puerto Rico. This chapter of the report analyzes the 28 P3 concessions that have reached financial close since 1992, identifying trends in the types of projects developed on a P3 basis, the structure of their procurements, and the tools used to finance them. Table 1 identifies each of the 28 P3 concession projects, identifying their procurement structures and how they were financed.
In addition to tapping into new sources of financing and accelerating the implementation of needed transportation improvements, one of the key motivators for project sponsors to procure projects on a P3 basis is the ability to transfer risk to their private sector partners. These risks include capital construction cost overruns, construction completion schedules, toll revenue levels, and long-term maintenance cost overruns.
As described earlier, two distinct P3 structures have been used in the U.S. over the past 24 years - each of which transfers different risks to the private partner. The nation's earliest P3 transactions involved financings that leveraged toll revenues. Known as "real toll" transactions, these deals involved the significant risk that actual project revenues would fall short of forecasted levels, leaving the private partner unable to repay its debt. In 2009, a new approach was introduced where P3 projects are financed by leveraging a combination of milestone payments for meeting construction deadlines and annual availability payments paid by the project sponsor to the private partner based on its ability to operate the project at a defined level of condition and performance. These so called "availability payment" P3 transactions carry considerably less risk, making them an attractive alternative to real toll P3 projects. While the Report on P3 Concessions includes collective analysis of all 28 P3 projects, given the distinctly different risk profiles of real toll and availability payment concessions, these two groups of projects are assessed separately.
In addition to the construction of new highway facilities, real toll concessions have been used on long-term lease transactions for existing toll facilities (i.e., "asset monetizations"). With these arrangements, private investor/operators are given the right to operate and collect tolls on an existing toll facility for a specified time period in exchange for making an upfront lease payment. The private partner may also be responsible for undertaking capital repairs or for expanding the facilities. The fact that these projects have proven revenue streams that date back decades in some cases mitigates traffic risk to a certain point. However, revenue levels generated by asset monetization concessions are also subject to fluctuations in the economy and are not without risk. The Report on P3 Concessions also contains separate analyses of real toll lease transactions.
Appendix A contains a comprehensive table that arrays the 28 U.S. P3 projects chronologically and by typology. The Appendix A table also identifies the different funding sources used to finance these projects, together with the specific dollar amounts involved. The following sections contain smaller tables conveying select information from the Appendix A table, as well as pie charts showing the composition of the initial financial packages for the 28 U.S. P3 projects. All of this information is derived from the Appendix A table.
The nation's first three P3 projects - the Teodoro Moscoso Bridge in San Juan, Puerto Rico, the Dulles Greenway in Northern Virginia, and the 91 Express Lanes in Orange County, California - all reached financial close in the 1992-1993 timeframe. This initial period of P3 activity was followed by a ten-year hiatus without a new P3 project. P3 activity picked up momentum in 2003 with the close of the South Bay Expressway in San Diego, California. With the exception of 2004, additional P3 projects have closed in all subsequent years. Since 2012, the United States P3 sector has seen between two and four highway projects reach financial close per year. The flow of new P3 deals may be slowing somewhat at the time of this writing. This trend may be attributed through December 2015 to the lack of a national transportation authorization providing a steady and predictable flow of federal monies to support investment in new transportation infrastructure. At the same time, the financial markets are taking a harder look at toll revenue risk. In addition, the number of states able to advance availability payment concessions is limited to those with high credit ratings. Nonetheless, there are new P3 projects on the horizon, and while the flow of new P3 transactions may be slowing, there will be continued P3 activity in the coming years.
In order to develop a better understanding of P3 trends over the past 24 years, it is helpful to assess outcomes separately for the three different P3 models described earlier.
As shown in Table 4-1, fourteen, or exactly half of the P3 concessions to have reached financial close in the U.S. since 1992, are real toll projects. Eleven of these facilities have opened to traffic and the remaining three are in construction. The concession periods for these project range from 35 to 85 years, and average nearly 52 years. Of the eleven open real toll P3 facilities, two have since been purchased by public sector transportation authorities, and a third filed for bankruptcy in 2016. The concession period of one project was extended by 20 years in order for it to avoid bankruptcy, another was extended to help recoup losses earlier in the concession period, and two others were refinanced, one in the face of lower than anticipated toll proceeds. The remaining five operational real toll P3 projects opened to revenue traffic during 2014-2016, and initial financial results from these projects appear to be exceeding expectations in most cases.
As described in Chapter 2 of this report, real toll concession projects can be further broken down into three distinct groups:
It is helpful to assess these project types separately in order to come to a better understanding of the outcomes of real toll P3 concessions.
Greenfield toll projects are new toll roads in previously undeveloped highway corridors. These projects have significant revenue risk because there is no documented travel demand in the corridors. In many cases, revenue risk is exacerbated if traffic and revenue projections are predicated on growth in population and employment along the corridor. There have been only three greenfield real toll projects built in the U.S.:
Table 4-1: Real Toll Concessions Through December 2016
View larger version of Table 4-1
The collective experience with the first greenfield toll roads in the U.S. has been mixed. The agencies sponsoring these projects and the public at large have benefitted from them. The projects have been built on budget without public sector funding and they provide new travel options to the public. However, for the private sector developers that financed, built and operate these three greenfield toll roads, their business results have been inconsistent, in large part due to larger economic conditions that influenced traffic and revenue levels. The initial developers of the Dulles Greenway were able to stave off bankruptcy by having their concession period extended by twenty years and restructuring their underlying debt. The growth in population levels and economic activity that the project's traffic and revenue forecasts were predicated upon were slow in coming, but did eventually occur. Nearly 10 years after opening, the initial investors were able to sell the concession, recover their costs and derive a profit. The new operators had the benefit of being able to price their offer based on 10 years of traffic and revenue data and, with the help of healthy toll increases, continue to operate the concession profitably.
The South Bay Expressway opened in late 2007 on the cusp of the impending financial crisis. The revenue forecasts prepared for the project assumed that it would be a catalyst for new development on the southern edge of San Diego. This growth was slow in developing and weak revenues and lingering legal action forced the private concessionaire into bankruptcy. When the concession was sold to the San Diego Association of Governments (SANDAG), the proceeds from the sale were used to repay the project's commercial debt and the private partner lost $130 million of its own money that it had invested as at-risk equity in the project. SANDAG benefitted from the sale by buying a project that had been built at a cost of $658 million for only $341.5 million. This, in turn, enabled them to lower toll rates on the South Bay Expressway, benefitting the driving public in greater San Diego.
SH 130 has suffered from toll revenues that were 60 percent below forecasts upon opening. In spite of increases to the speed limit on SH 130 and 400 signs on I-35 encouraging motorists to use SH 130, many drivers prefer to use the more congested I-35 corridor because there are no tolls. While the concession company has transferred the roadway to its creditors and lost the $210 million it invested in the project, this has no impact on the State of Texas or the customers that use SH 130 Segments 5-6.
Based on the tenuous outcomes for the private partners who developed the first three greenfield highway P3 concessions in the U.S., private sector developers appear to have little to no appetite for participating in other greenfield highway concessions unless their public sector project sponsors fund a significant portion of their cost.
There have only been two real toll crossing projects in the U.S.:
With just two projects in this cohort of real toll P3 projects, it is difficult to draw conclusions on trends for crossing projects. The Teodoro Moscoso Bridge was the first P3 project to open in the U.S. and is financially stable. The bridge was completed in a timely fashion and with its relatively low construction costs and higher toll rates it earns a good return for the private partner and provides opportunities for profit sharing with the sponsor. Even so, the concession period was extended by 17 years in 2010 to help the concession company recoup losses experienced earlier in the term. The Teodoro Moscoso Bridge project is unique in that the Puerto Rico Highways & Transportation Authority (PRHTA) used its own bonding capacity to raise the necessary funding for the project and then passed the repayment obligation on to the private partner.
The Elizabeth River Tunnels project opened in stages in 2016, with only the rehabilitation of the existing Midtown Tunnel remaining to complete in 2018. The project illustrates the public acceptance risks associated with tolling - especially the introduction of tolls on existing facilities that were not tolled. In this case, the opposition included a lawsuit and anti-P3 legislation introduced by state legislators. The Commonwealth Transportation Board helped to mitigate the project's significant public acceptance risk by providing an additional $100 million in public funding in order to delay the implementation of tolling on the existing Elizabeth River tunnel crossing.
With a cost of nearly $2.1 billion, the Elizabeth River Tunnels project also provides evidence of the severe challenges of financing a project of this scale without a meaningful public sector subsidy. In this case, public sector funding has attracted a much larger investment of at-risk private sector capital and credit. Traffic risk in the case of the Elizabeth River Tunnels is mitigated to some extent by the fact that historic traffic levels are well documented in each of the crossing corridors. Although the project involves the construction of a new tunnel, it adds needed capacity in a heavily traveled existing corridor. In this way, the risk levels associated with the Elizabeth River Tunnels project are similar to those of a brownfield project.
With the exception of the Elizabeth River Tunnels project, all real toll P3 concessions that have reached financial close since 2009 have involved priced managed lane projects. There have been a total of nine priced managed lane real toll concessions implemented in the U.S. beginning with the 91 Express Lanes that entered into service in December 1995. Although there is a relatively large number of these projects, their collective outcome remains to be determined, as five of these projects are in construction or design at the time of this writing, and an additional three have been open for less than two years.
The following real toll priced managed lane projects are in operation in the U.S.:
The first real toll P3 managed lane concession is the 91 Express Lanes, which opened to service in late 1995. Running in a geographically constrained valley in an extremely congested highway corridor, the project has been highly profitable for its entire history. It was built without any public money but was purchased by the Orange County Transportation Authority in 2003 in order to annul a non-compete clause in the P3 concession agreement that prevented Caltrans from making improvements to the parallel general-purpose lanes. Built at a cost of $119 million, the private developer sold the concession for $207.5 million and derived a significant profit.
Most of the more recent real toll P3 managed lane projects have involved much larger and more expensive improvements in heavily traveled commuter corridors with well-documented traffic levels. Nonetheless, the introduction of tolling for the first time introduces revenue risk. The public sector agencies sponsoring these projects have made significant financial contributions towards their construction in order to make their financings viable. In addition to managed lane capacity, these projects have also involved the reconstruction and enhancement of existing urban-suburban highway corridors and have featured concession terms in excess of 50 years.
The $2.068 billion, 85-year Capital Beltway HOT lane concession opened to service in late 2012 to lower than expected revenue levels. This led to a refinancing less than two years later, with the private partner investing an additional $280 million of its own equity to reduce its debt servicing costs. While the outcome of this project is not certain, the concessionaire's additional equity investment indicates that it has confidence in the project's long-term financial performance.
The $2.047 billion North Tarrant Express (I-820 and SH 121/183) opened to traffic in October 2014 to revenues that were higher than industry expectations. 2 The project has maintained its credit rating, due to its positive performance and expectations for continued economic and population growth in the Dallas-Fort Worth metropolitan area. However, if the growth in traffic levels slows project reserves could erode.
The $923 million 95 Express Lanes project opened in Northern Virginia in December 2014. This is the only recent real toll managed lane project not to receive a public sector subsidy, due to its lower cost and healthy revenue generation potential. In its first six weeks of operation, revenues averaged $105,000 per day, which was higher than industry expectations. 3
The $2.615 billion LBJ Express opened to service in September 2015. Through the third quarter of its first full year of operation, although toll transactions were one percent below expectations, revenues were seven percent higher than budget due to higher-than-anticipated toll rates. 4
The $209 million U.S. Express Lanes (Phase 2) opened in January 2016. The Phase 2 private partner is also operating and collecting toll proceeds from the U.S. 36 Express Lanes (Phase I) and I-25 Express Lanes, both of which have been built by the state of Colorado. Gross revenues on the combined Phase 1 and 2 U.S. 36 facility are slightly above expectation in 2016. 5
The remaining three real toll managed lane concessions are under construction or design at the time of this writing:
While these projects range in size, each transaction has included a subsidy from the public sector sponsor. In addition, the public sponsor of the North Tarrant Express 35W Project is developing an extension of that project at its own cost. The private partner will operate the extension and be entitled to the toll revenues it generates. While the outcome of these three concessions is not known at this time, these important financial commitments demonstrate that project sponsors recognize that it would not be possible to implement these projects as at-risk, real toll managed lane concessions without public funding and other contributions in kind.
Figure 4-1 provides pie charts identifying the funding and financing sources that have been used on the 14 real toll P3 concessions that have reached financial close in the U.S., together with the percentage of the total project cost they have provided. Each of the 14 real toll projects are presented chronologically. The three real toll projects built in the 1990s predate the establishment of today's federal credit assistance. As a result, P3 developers had limited financing options. For example, the Dulles Greenway and 91 Express Lanes were both originally financed using a combination of commercial loans made by banks and at-risk equity provided by their sector development private partners. The Teodoro Moscoso project involved a one-of-a-kind financing where the government of Puerto Rico used its full faith and credit to raise special facility revenue bonds, which were then repaid by the private partner.
The TIFIA Credit Program was established by TEA-21 in 1998 to provide revenue-generating transportation projects with access to low-cost and flexible financing compared to the terms generally offered by commercial lenders. The goal of the program is to attract private and other non-federal co-investment in transportation projects of regional and national significance. The program was created in recognition of the fact that state and local governments that sought to finance transportation projects with tolls often had difficulty obtaining financing at reasonable rates due to the uncertainties associated with tolling.
As shown in Figure 4-1, TIFIA loans have been used on all 11 real toll P3 transactions to have reached financial close in the United States since the program was established. Beginning with the South Bay Expressway in 2003, the TIFIA program has providing approximately one-third of funding needed to support these projects. The TIFIA credit program was especially helpful to those projects that reached financial close in the wake of the 2008 financial crisis. The most recent real toll P3 project to benefit from the TIFIA Program is the $1.063 billion SH 288 Toll Lanes, which closed on a $357 million TIFIA loan on April 28, 2016.
SAFETEA-LU of 2005 amended Section 142 of the Internal Revenue Code to allow tax-exempt private activity bonds to be used to finance highway and freight transfer facilities. This change allowed private developers lower their borrowing costs by tapping the municipal credit market and gaining access to tax exempt financing. The I-495 Capital Beltway HOT lanes project was the first project to use PAB financing when it reached financial close in 2007. With the exception of SH 130 Segments 5 and 6, PABs have been used on all real toll P3 concessions to reach financial close since the establishment of the program. The combination of PABs and TIFIA financing has enabled real toll projects to proceed in a time of financial turmoil. It has also provided the necessary foundation to leverage other sources of financing, including at-risk equity contributions from private sector P3 investors.
The other major potential credit source for real toll projects is commercial debt. However, banks tend to lend money at a higher cost compared to federal credit programs, as commercial lenders set interest rates to reflect the level of risk involved with each transaction. The risk level is generally documented by ratings assigned to these transactions by the three major bond rating houses: Fitch Ratings, Moody's, and Standard and Poors. Commercial debt has only been used on two real toll projects since the establishment of the TIFIA Credit Program: SH 130 Segments 5 and 6 and U.S. 36 Express Lanes (Phase 2). As discussed earlier, the SH 130 project declared bankruptcy in March 2016, due to lower than expected toll revenues. Commercial debt was a viable financing tool for the U.S. 36 project because it leveraged the toll proceeds from two existing managed lane project, both of which had established and well documented revenue streams. This fact reduced the project revenue risk, allowing the banks to lend money at a more attractive interest rate. The project's risk profile was further reduced because nearly half of its cost was covered by a combination of a public subsidy and private equity.
Figure 4-1: Real Toll P3 Sources of Funding
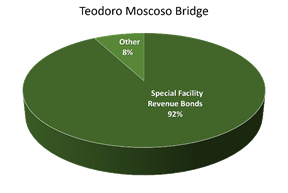
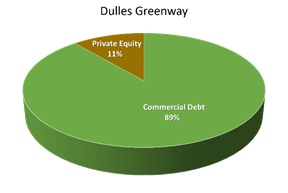
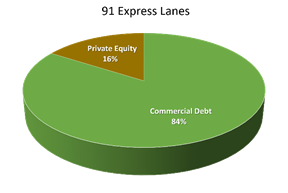
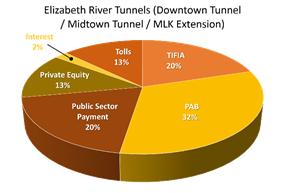
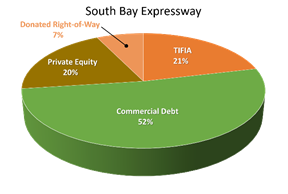
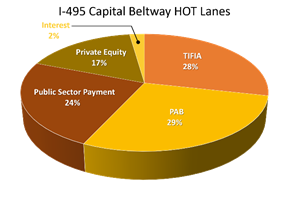
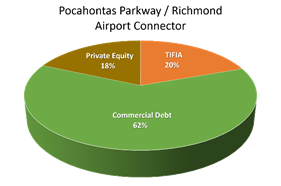
Figure 4-1: Real Toll P3 Sources of Funding (continued)
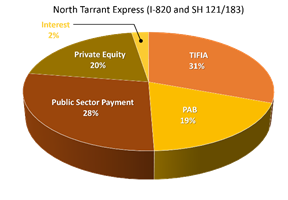
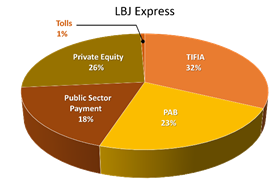
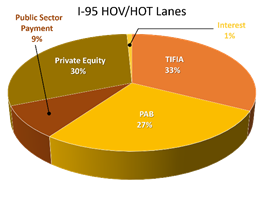
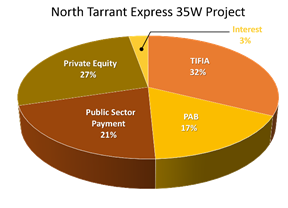
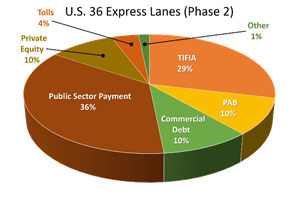
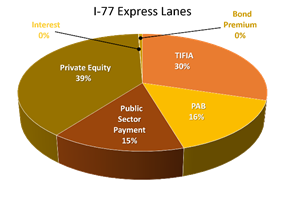
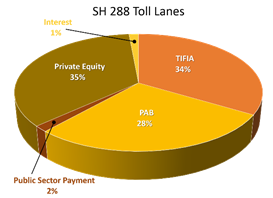
Public sector payments have also been an important funding source for several real toll projects. Increasingly, public sector sponsors recognize that large real toll P3 transactions will not be financially viable without their financial participation. Public subsidies can also play an integral role in the adjudication award of real toll concessions. In some procurements, bidders have been asked to specify the amount of the public subsidy that they would need to be able to complete a deal, and in others they are asked to identify the physical extent of a construction program they would be able to deliver with a fixed subsidy. Public subsidies are often used for larger and more expensive projects, such as managed lane improvements that reconstruct entire highway corridors or complex undertakings such as the Elizabeth River Tunnels.
Other sources of funding for real toll projects can include tolls from other existing facilities that the private partner has been asked to operate as part of a concession. Interest payments earned on the proceeds from loans before they are expended or on project reserves can also provide modest amounts of funding for real toll projects.
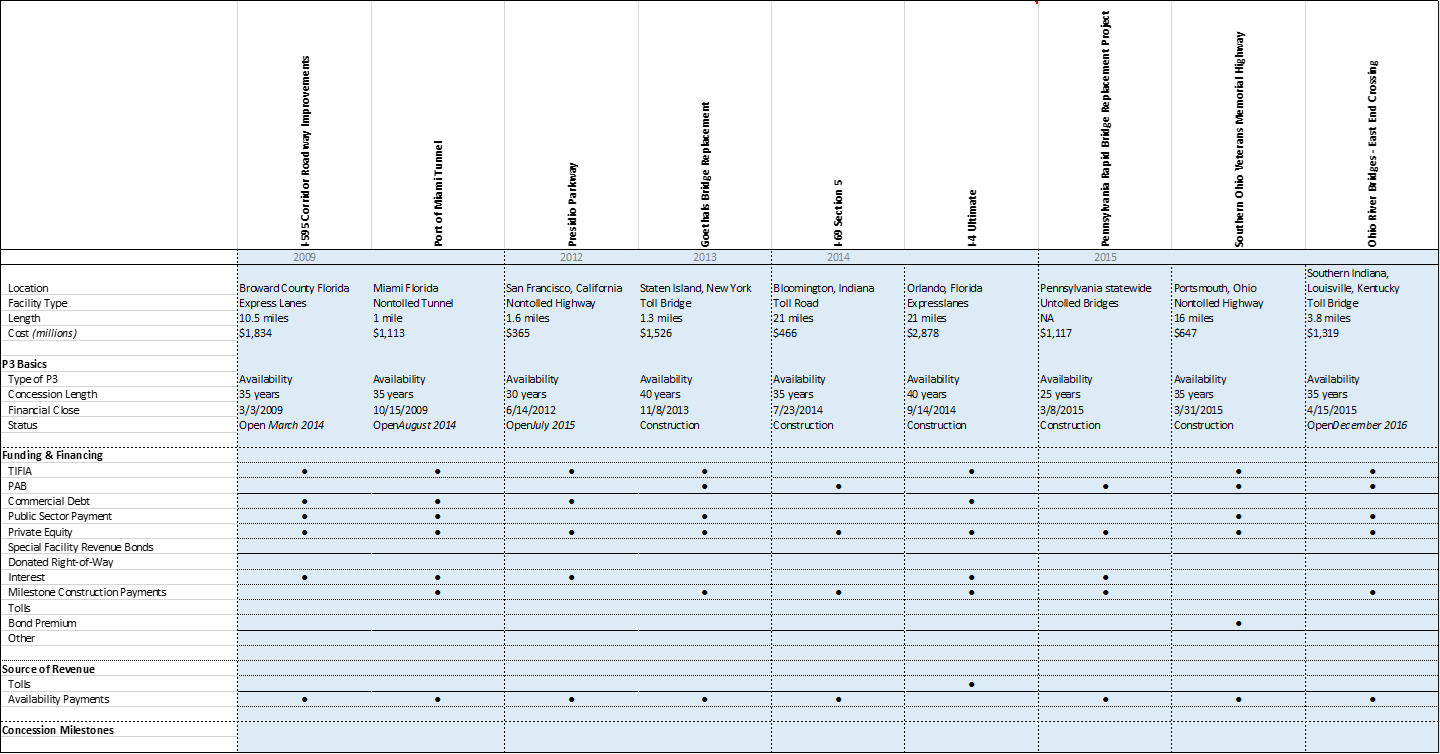
As shown in Table 4.2, a total of nine availability payment P3 concessions have reached financial close in the U.S. The availability payment approach was pioneered in the state of Florida in the mid-2000s with the Port of Miami Tunnel. Due to the complexity and high level of risk associated with the tunnel, the Florida Department of Transportation (FDOT) was keen on procuring the project on a P3 basis. However, it would not be politically feasible to toll the crossing. As a result, FDOT made the decision to use its own funding to make annual payments to a private partner that would design, build, finance, operate and maintain the project and have the private partner raise the necessary financing by leveraging the state's availability payments.
The availability payment DBFOM P3 approach has proven popular with private sector developers as it involves considerably less financial risk compared to real toll concessions. As state financial commitments, availability payment financings essentially leverage the faith and credit of state governments. However, there is the added risk associated with state legislatures obligating monies to DOTs in future budget cycles, and the risk involved with funding the availability payments in state DOT budgets. In addition to non-toll projects, public sector sponsors have also used the availability payment approach to procure toll projects that do not generate adequate amounts of revenue to cover their costs, or in cases where the sponsor wants to retain control of toll rates. Project sponsors use traditional federal and state sources to fund availability payments. These can be supplemented with toll proceeds from projects procured on an availability payment basis, or other state and local transportation funding sources.
Five of the nine availability payment P3 projects in the U.S. remain under construction at the time of this writing. The remaining four have been open to service for less than three years. The following sections provide brief histories of these projects followed by a synthesis of the collective experience to date in the U.S. with availability payment concessions.
Table 4-2: Availability Payment Concessions Through December 2016
 View larger version of Table 4-2
Although the first availability payment P3 projects did not reach financial close until 2009, half of the P3 projects that to have closed since then have been availability payment projects. Concession periods for availability payment projects range between 25 and 40 years, with an average of roughly 35 years. This is nearly 20 years less than typical concession periods for real toll P3 projects and provides an indication of the timeframe public sponsors are willing to extend payment obligations. Over half of U.S. availability payment activity has been concentrated in two states: Florida with three availability payment projects, and Indiana with two. The pace at which availability projects have been developed gained momentum in 2014 and 2015, with five projects reaching financial close in those two years alone. However, deal flow slowed in 2016, and it appears that there may be fewer availability projects in coming years. 6
Transportation agencies have used availability payment procurements to develop a wide array of highway projects. Five of the nine availability payment projects that have reached financial close involve non-tolled projects. They include a tunnel providing truck and vehicular access to the Port of Miami, the approach road to the Golden Gate Bridge, an Interstate highway segment in Indiana, a highway bypass in Ohio and 558 one- and two-span bridges in largely rural regions around the state of Pennsylvania. The remaining four projects involve two priced managed lane projects in Florida and two toll bridges, one connecting New York and New Jersey and the other Kentucky and Indiana.
The expanding use of availability payment P3 procurements has been driven by a number of factors. They have proven an effective strategy to accelerate the completion of large and expensive projects that would otherwise be built in smaller pieces extended over multiple budget cycles. As with real toll projects, they also transfer lifecycle risk to the private partner and incentivize long-term maintenance efficiencies and cost savings. They also engender rigorous competition among the companies bidding for availability payment concessions, given that award decisions are based primarily on cost. They can also be an effective vehicle for providing sponsoring agencies access to international firms with expertise not necessarily available domestically - such as experience with subaqueous, wide-diameter, bored tunnel construction in the case of the Port of Miami Tunnel. One of the strongest motivations for project sponsors to use the availability payment approach is to extend all the benefits described above to high-priority projects that do not generate revenue, and would otherwise be procured using other means.
Although these arguments are all valid, many of the same outcomes can be achieved through design-build contracts. Public sector owners should also be aware of the potential downside to availability payment concessions. While some sponsors may initially have equated availability payments with lease, or off-balance-sheet transactions, all three major rating agencies consider them equivalent to debt obligations. 7 As such, the use of availability payment concessions puts downward pressure on state credit ratings. This pressure can be mitigated to a certain extent if availability payment concessions are used on projects that generate toll revenues covering all or a portion of the state's obligations. However, this is not the case with availability payment procurements for non-revenue generating projects. Therefore, there is a limit on the volume of availability payment activity in order for states to avoid a threat to their credit rating. Because of this dynamic, the use of availability payment procurements is also generally limited to those states with stronger credit ratings.
The growth in the use of availability payment concessions in the U.S. has also clearly coincided with the wake of the 2008 financial crisis. With the tightening commercial credit market and the loss of the bond insurance market, availability payment concessions provided public agencies with a new way to structure P3 transactions that mitigate risks that some private investors may have no longer found acceptable, such as the revenue risks associated with real toll projects. The availability payment approach allowed project sponsors and private partners alike to focus on managing risks associated with construction, operations, and asset management. With the lower risk profile, the public sector may receive more competitive bids providing lower financing and capital costs.
Availability payment concessions are not without financial risk to the private sector. The private partner typically must assume appropriation risk associated with the availability payments themselves. However, state policies often mitigate this to an extent by prioritizing availability payments in their capital or work programs ahead of other agency obligations. Even with such policies, the annual state legislative appropriation process may still present risk to the private partner. In the case of the Presidio Parkway in California, the state legislature chose to commit to a "continuous appropriation" that provides protection against budget delays, because, as a lump-sum appropriation, the funds may be paid regardless of passage of the annual budget.
While availability payment procurements may afford many benefits to project sponsors, the fact that availability payments are prioritized above other needs reduces the sponsor's flexibility to allocate future revenues where they may be most needed. Public agencies should have a clear understanding of the impact availability payment obligations will have on their budgets and the state's credit rating, and they should only use this approach on high priority projects where it will deliver value. Florida has set caps on the overall amount of availability payment activity that can occur in the state. Its current portfolio of availability payment projects is well below the cap, enabling it to maintain the robust confidence of the credit agencies and derive the benefits from the procurement strategy on a small number of complex, high-priority projects.
Availability payment procurements are attractive to private sector developers because they mitigate the troublesome revenue risks associated with real toll projects. However, their upside profit potential is capped by the availability payments, which are fixed for the duration of the concession. Real toll concessions provide the potential for greater profit, but with much higher risks.
Figure 4-2 identifies the funding and financing sources that have been used on the nine availability payment P3 concessions that have reached financial close in the U.S. These projects closed between 2009 and 2015 and had access to all current federal credit programs. Seven of the nine P3 concessions have used TIFIA loans. While TIFIA support is common among availability payment concessions, it is used with slightly less frequency compared to real toll P3 transactions. Both projects that did not use TIFIA loans did have PABs. An additional three projects used both PABs and TIFIA.
Four of the nine availability payment P3 projects have included commercial debt in their financings. This is a higher frequency compared with real toll projects and is likely related to the reduced financial risk profiles associated with availability projects. All four projects using commercial debt also involved TIFIA transactions. To date, no availability payment projects have paired commercial debt with PABs.
As with real toll P3 transactions, all availability payment financings have included private sector equity. However, compared with the 14 real toll projects, the average level of equity is significantly lower with availability payment projects: 9 vs. 22 percent. This higher gearing - the debt to equity ratio - is possible because availability payment projects are less risky. As a result, lenders do not require private partners to contribute as much equity in order to make loans supporting availability payment projects.
Figure 4-2: Availability Payment P3 Sources of Funding
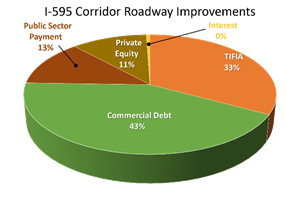
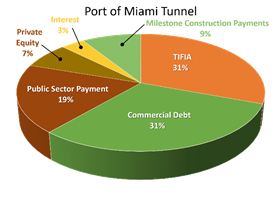
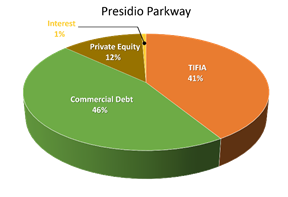
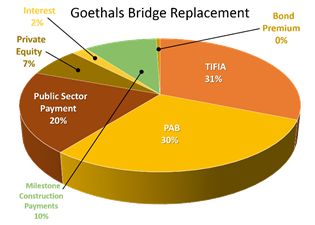
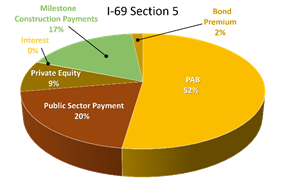
Figure 4-2: Availability Payment P3 Sources of (continued)
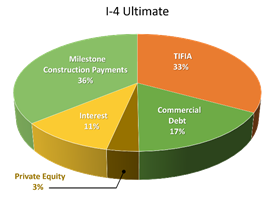
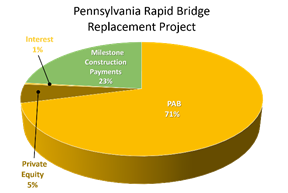
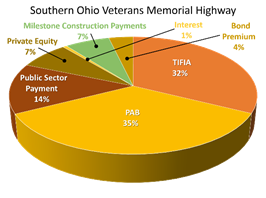
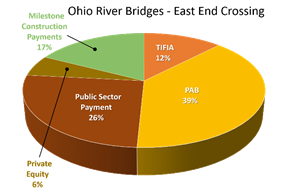
With eight out of the nine availability payment projects, their public sector sponsors have made upfront payments to their private partners, either in the form of an upfront public contribution, milestone construction payments, or a combination of the two. Given that these projects are funded entirely with public money, this is a deliberate choice on the part of their public sponsors. By doing so, they reduce the amount of the annual availability payments they will pay throughout the life of the concession. It is interesting to note that availability payment concession financings tend to include a greater share of public sector funds compared with real toll concessions: 20 vs. 12 percent on average. This trend also reflects the fact that agencies sponsoring availability payment projects assemble their funding from a variety of sources, some of which may be limited for use on capital construction and others restricted to support maintenance needs.
As with real toll projects, availability payment financings can also include modest amounts in interest payments and bond premiums.
A total of five long-term lease concessions have reached financial close in the U.S. beginning with the Chicago Skyway, in 2005. In the following three years, three additional long-term lease transactions took place. Since 2008 only once lease transaction has occurred: the PR-22/PR-5 toll roads in Puerto Rico in 2011. While other project owners have considered leasing toll facilities, no other lease concessions have occurred in the ensuing time.
Long-term lease concession can take several forms. These include:
Table 4-3 summarizes the five long-term lease concessions in the U.S. to date. Concession periods tend to be longer than with real toll DBFOM and availability payment concessions, averaging about 82 years. Only the Puerto Rico lease is less than 75 years, although it was extended from 40 to 50 years in 2016.
Table 4-3: Long-term Lease Concessions through December 2016
View larger version of Table 4-3
All long-term leases include a commitment to operations and maintenance over the concession term. However, unlike similar commitments for availability payment concessions, adhering to established performance standards is not as easily enforced since there are no performance-based availability payments. Two lease transactions have included provisions for facility expansion: the Pocahontas Parkway where the concessionaire constructed a connecting road segment to Richmond International Airport, and the Northwest Parkway, which includes options for two extensions of that facility. Other commitments bundled with long-term leases have included upgrading toll collection systems, capital maintenance, and other safety and system improvements.
Experience with long-term leases in the U.S. has been decidedly mixed. Most long-term lease concessions are no longer held by their original private sector concessionaires. Although the Chicago Skyway's investors sold their interests in the facility for a profit in 2015, 10 years into the lease, both the Indiana Toll Road and Pocahontas Parkway struggled to achieve adequate traffic and revenue levels sufficient to cover their debt repayments. The Indiana Toll Road's concessionaire filed for bankruptcy in 2014, and the lease was subsequently auctioned off to a new private sector consortium. The Pocahontas Parkway's concessionaire ultimately transferred ownership of the roadway to the banks holding its senior debt in 2014, and subsequently VDOT awarded a concession to a new private consortium in October 2016.
The Northwest Parkway's concessionaire reported "favorable" performance evidenced by 15.2 (2014) and 41 (2015) percent increases in toll revenue, along with respective 13.3 and 12 percent growth in traffic due to strong economic activity in the Denver metropolitan area. 8 Nonetheless, prior years of underperformance and an inability to restructure private debt maturing in 2017 led the concessionaire to sell the toll road to new investors in late 2016.
The PR-22 and PR-5 concessionaire refinanced its shorter-term debt in December 2015 extending the payback period and stabilizing the facility's finances. The concession agreement also was extended by 10 years in April 2016 in exchange for an additional payment from the concessionaire to the project sponsors of $115 million. In conjunction, the concessionaire's revenue share was increased from 50 to 75 percent of future toll revenues. Traffic levels have shown recent improvement despite unfavorable economic conditions in Puerto Rico. 9 Ninety-five percent of the concessionaire's five-year investment plan to make operational improvements to the roadways is complete.
While several initial private sector investors have been challenged to realize expected returns from their investments in the near-term, public sector sponsors have generally benefited from their long-term lease transactions. First, changes in lease ownership have not had an impact on facility users or project sponsors since the provisions of the original concession agreements, including commitments to operate and maintain the roadways, to follow established methods for toll rate increases, and to share excess profits still stand. Second, the large, upfront payments secured upon lease execution have provided demonstrable benefits. At a minimum, they helped retire debt on burdensome or troubled assets for all five projects, and in three instances, permitted the project sponsors to make investments elsewhere in their respective region or state. Both the Chicago Skyway and Indiana Toll Road exemplify this outcome, as the City of Chicago and State of Indiana were able to make substantial investments in infrastructure, and in the City of Chicago's case, to parlay the proceeds into social and future income generation benefits as well.
However, in order to achieve these results, each of these sponsors had to forego the income that these existing toll facilities would have provided them over the life of these extremely long concession terms. While it may have been more difficult politically and from a public acceptance perspective, the project sponsors could have implemented toll increases and streamlined operation of their existing toll facilities in ways emulating what their private sector operators have accomplished. With mature legacy facilities such as in Chicago, Indiana and Puerto Rico, the income that has been forfeited for periods up to 99 years is substantial. These sponsors did receive extremely large payments for these leases that provided capital funding for other project needs, and in the case of Indiana to fund the $2.6 billion, 10-year, Major Moves transportation investment program, advancing the benefits of the projects undertaken.
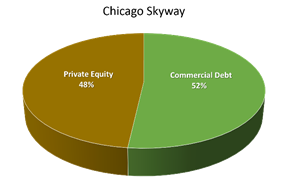
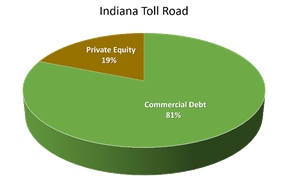
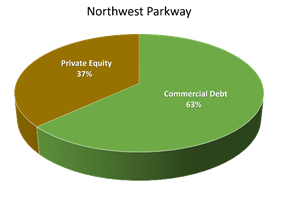
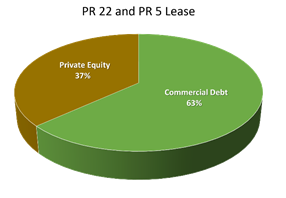
As shown in Figure 4-3 , original financings for long-term lease concessions in the U.S. have all comprised significant private equity investment coupled with taxable long-term debt from commercial banks. The fact that these legacy facilities have well established traffic and revenue histories mitigates traffic risk, thereby making commercial debt a viable option for their private sector operators. Given that federal credit programs must be used on projects involving the expansion of existing facilities or the construction of entirely new projects, they have not been available for use on long-term lease projects. The Pocahontas Parkway lease transaction did include a TIFIA loan, which the concessionaire used to help finance the construction of the Richmond Airport Connector.
The percentage of equity as a share of overall concession cost at initial financial close ranges between 18 (Pocahontas Parkway) and 48 percent (Chicago Skyway), with an average of roughly 32 percent. However, the Chicago Skyway concessionaire refinanced its underlying debt only seven months after financial close, reducing its equity share to 25 percent. This change reduced the average level of equity investment for the five long-term lease transactions to 27 percent.
Figure 4-3: Long-Term Lease Sources of Funding

2 Business Wire, February 27, 2015 https://www.businesswire.com/news/home/20150227005958/en/Fitch-Affirms-North-Tarrant-Express-Mobility-Partners
3 Fitch Ratings, March 30, 2015 https://www.fitchratings.com/site/pr/982134
4 LBJ Express Quarterly Operations and Maintenance Report, Q3 2016 https://emma.msrb.org/ES988641-ES773865-ES1175182.pdf
5 Fitch Ratings, December 2, 2016 https://www.businesswire.com/news/home/20161202005743/en/Fitch-Affirms-Plenary-Roads-Denver-LLCs-PABs
6 "Where Did P3 Deal Flow Go?" Public Works Financing, September 2015, pp 11-15.
7 Jodi Hecht, "Are Availability Payment Obligations Debt?" Public Works Financing, September 2015, pp. 16-18.
8 Brisa 2014 and 2015 Consolidated
Annual Reports. https://www.brisa.pt/Portals/0/Documentos/Relatorios/EN/
RC%20Consolidados/ReCBAE_Cons_2014UK.pdf
9 Abertis 2015 Annual Report. https://www.abertis.com/media/annual_reports/2015/IA2015_abertis_eng_bP7VWsH.pdf