


Patrick DeCorla-Souza
P3 Program Manager
USDOT Build America Bureau and FHWA Office of Innovative Program Delivery

Wim Verdouw
Financial Modeler
IMG/Rebel
Part 1 Overview of Benefit-Cost Analysis (BCA)
Part 2 P3-VALUE 2.1 BCA Enhancements
Part 3 Illustrative Application of Benefit-Cost Analysis
P3-VALUE 2.1 Webinar
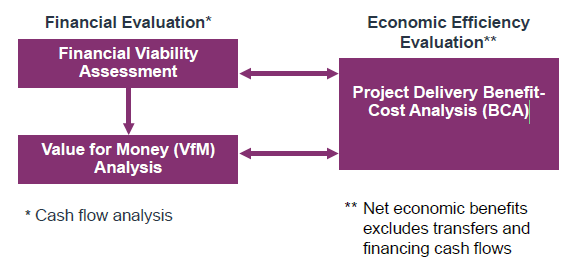
Text of "Types of Project Delivery Evaluation" chart
| Financial Evaluation* | Economic Efficiency Evaluation** | |
| Financial Viability Assessment | ↔ | Project Delivery Benefit-Cost Analysis (BCA) |
| ↓ | ||
| Value for Money (VfM) Analysis | ↔ | |
|
*Cash flow analysis |
** Net economic benefits excludes transfers and financing cash flows |
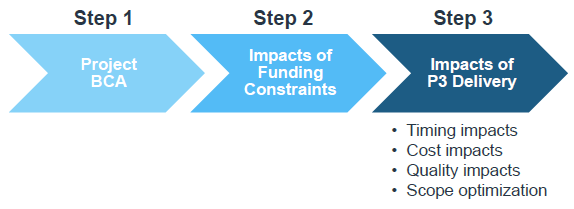
Text of Benefit-Cost-Analysis Process chart
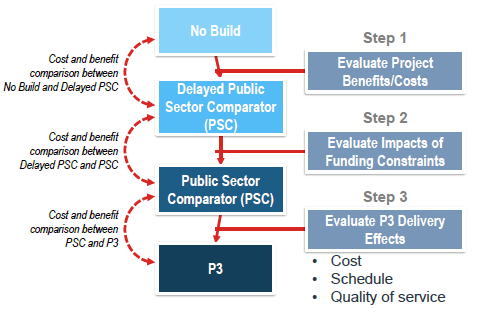
Text of BCA Framework flow chart
| Cost and benefit comparison between No Build and Delayed PSC |
|
No Build | Step 1: Evaluate Project Benefits/Costs |
|
|
|||
| Cost and benefit comparison between Delayed PSC and PSC |
|
Delayed Public Sector Comparator (PSC) | Step 2: Evaluate Impacts of Funding Constraints |
|
|
|||
| Cost and benefit comparison between PSC and P3 |
|
Public Sector Comparator (PSC) |
Step 3: Evaluate P3 Delivery Effects
|
|
|
|||
| P3 |
In P3-VALUE, all three options are compared to No Build
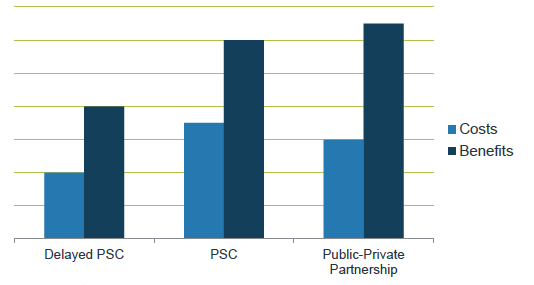
Text summary of Project Delivery BCA Output chart
*Actual numerical values are not indicated on chart.
| Perspective | Financial Analysis (VfM Analysis) | Economic Analysis (BCA) |
|---|---|---|
| Agency | Costs to Agency's balance sheet | Agency costs plus societal benefits |
| State | Costs to State | State costs plus societal benefits |
| National | Societal costs | Societal costs and benefits (true BCA) |
FHWA's Benefit-Cost Analysis for P3 Project Delivery: A Framework
P3-VALUE 2.1 Webinar
P3-VALUE 2.1 Excel Spreadsheet
User Guide, Quick Start Guide, FAQs
Primers & Guidebooks
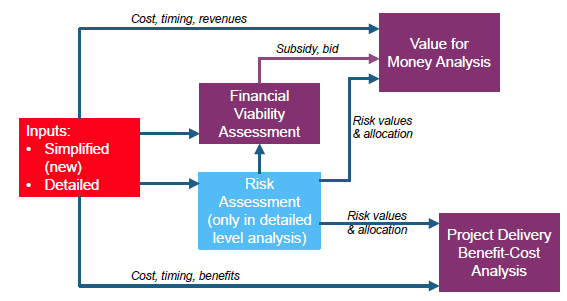
Text description of Tool Structure flow chart
Inputs:
| Benefit Cost Inputs (Transit & Carpool) | No Build | ML/TL | GPL |
|---|---|---|---|
| Additional passengers carried by transit (% of vehicles) | 2.00% | 4.00% | 1.50% |
| Additional passengers carried by carpools (% of vehicles) | 2.00% | 4.00% | 1.50% |
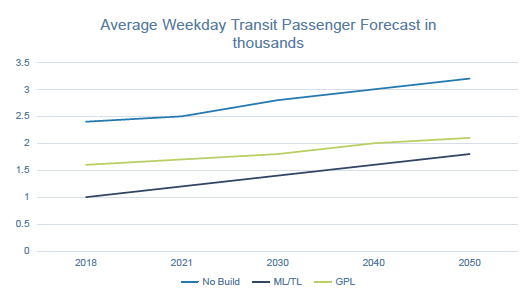
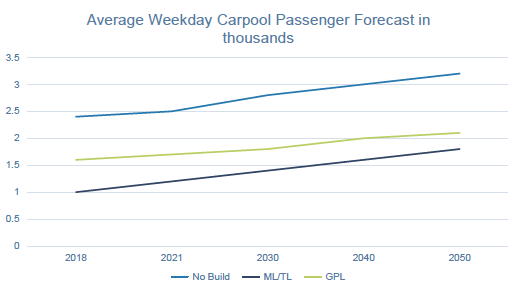
| Transit Passenger Forecast | Year | No Build | ML/TL | GPL |
|---|---|---|---|---|
| Weekday daily transit passengers in model start year (in thousands) | 2018 | 2.4k | 1.0k | 1.6k |
| Weekday daily transit passengers in input year 2 (in thousands) | 2020 | 2.5k | 1.2k | 1.7k |
| Weekday daily transit passengers in input year 3 (in thousands) | 2030 | 2.8k | 1.4k | 1.8k |
| Weekday daily transit passengers in input year 4 (in thousands) | 2040 | 3.0k | 1.6k | 2.0k |
| Weekday daily transit passengers in input year 5 (in thousands) | 2050 | 3.2k | 1.8k | 2.1k |
| Annual transit passengers growth after last input year (in percent) | > 2050 | 0.50% | 1.00% | 0.50% |
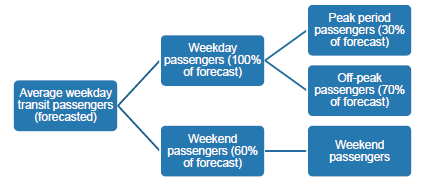
| Transit Passengers Shares | No Build | ML/TL | GPL | |
| Peak transit percentage (of total transit passengers) | 30.00% | 30.00% | 30.00% | |
| Off-peak transit percentage (of total transit passengers) | 70.00% | 70.00% | 70.00% | |
| Weekend transit percentage (of total transit passengers) | 60.00% | 60.00% | 60.00% |
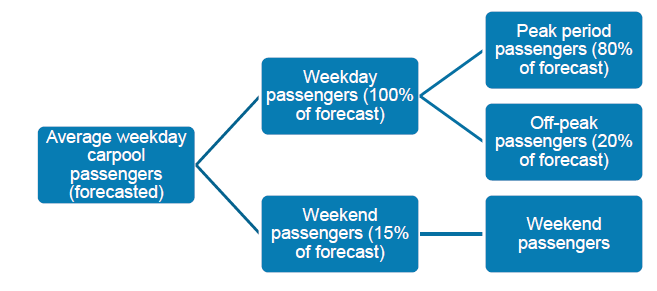
Text of Carpool Travel Forecase Breakdown flow chart
| Carpooling Passenger Forecast | Year | No Build | ML/TL | GPL |
|---|---|---|---|---|
| Weekday daily carpooling passengers in model start year (in thousands) | 2018 | 2.4k | 1.0k | 1.6k |
| Weekday daily carpooling passengers in input year 2 (in thousands) | 2020 | 2.5k | 1.2k | 1.7k |
| Weekday daily carpooling passengers in input year 3 (in thousands) | 2030 | 2.8k | 1.4k | 1.8k |
| Weekday daily carpooling passengers in input year 4 (in thousands) | 2040 | 3.0k | 1.6k | 2.0k |
| Weekday daily carpooling passengers in input year 5 (in thousands) | 2050 | 3.2k | 1.8k | 2.1k |
| Annual transit passengers carpooling after last input year (in percent) | > 2050 | 0.50% | 1.00% | 0.50% |
| Carpooling Passengers Shares | No Build | ML/TL | GPL | |
| Peak carpooling percentage (of total carpooling passengers) | 80.00% | 80.00% | 80.00% | |
| Off-peak carpooling percentage (of total carpooling passengers) | 20.00% | 20.00% | 20.00% | |
| Weekend carpooling percentage (of total carpooling passengers) | 15.00% | 15.00% | 15.00% |
Please stand by while we open the P3-VALUE 2.1 tool to show the enhanced features
P3-VALUE 2.1 Webinar
| Benefit Cost Inputs (Delays & Pavement Quality) | No Build | PSC | P3 |
|---|---|---|---|
| Average duration of construction activity (in hours) | 0.00 hours | 8.00 hours | 7.50 hours |
| Average duration of O&M activity (in hours) | 4.00 hours | 3.00 hours | 2.75 hours |
| Speed adjustment factor for incident delays (in percent) | 18.00% | 9.00% | 8.50% |
| Pavement quality (IRI, in inch/mile) | 150 inch/mile | 140 inch/mile | 130 inch/mile |
| Benefit Cost Inputs (Transit & Carpool) | No Build | PSC | P3 |
| Additional passengers carried by transit (% of vehicles) | 2.00% | 4.00% | 1.50% |
| Additional passengers carried by carpools (% of vehicles) | 2.00% | 4.00% | 1.50% |
| Lifecycle Performance Risk & Revenue Uncertainty Adjustment Inputs | |
|---|---|
| Lifecycle performance risk calculation method (see options below) | Option 1 |
| Lifecycle performance risk aggregate premium (in million $, option 2 only) | $400.0M |
| Revenue uncertainty adjustment calculation method (see options below) | Option 1 |
| Delta between availability payment & toll concession WACC (in percent, option 1 only) | 1.60% |
| Revenue uncertainty adjustment (% of toll revenue collection, option 2 only) | 28.00% |
| Guidance for Valuation Options | |
| Option 1: WACC-based risk premium is calculated to determine the value of lifecycle performance risks/revenue uncertainty adjustment | |
| Option 2: User to provide a risk premium for the value of lifecycle performance risks/revenue uncertainty adjustment | |
| Option 3: Lifecycle performance risks/revenue uncertainty adjustment are ignored in the analysis | |
| Benefits & costs under Delayed Conventional Delivery | NPV @ 2.00% | Real total | ||
|---|---|---|---|---|
| ∆ Travel time cost | $1,828M | $3,251M | ||
| ∆ Delays due to construction | ($48M) | ($57M) | ||
| ∆ Delays due to O&M | $10M | $17M | ||
| ∆ Delays due to incidents | $1,360M | $2,388M | ||
| ∆ Non-fuel costs | $111M | $193M | ||
| ∆ Fuel costs | ($109M) | ($176M) | ||
| ∆ Accident costs | $292M | $507M | ||
| ∆ Emissions cost | ($127M) | ($226M) | ||
| Highway benefits subtotal | $3,318M | $5,898M | ||
| ∆ Transit passenger benefits | $22M | $40M | ||
| ∆ Carpooling passenger benefits | $20M | $36M | ||
| Transit and carpool passenger benefits subtotal | $43M | $76M | ||
|
|
Total benefits | $3,360M | $5,974M | |
| O&M No Build cost savings | $205M | $350M | ||
| Real construction costs | ($370M) | ($435M) | ||
| Real operations costs | ($104M) | ($180M) | ||
| Real base variability | - | - | ||
| Real pure risks | - | - | ||
| Lifecycle performance risk | ($86M) | ($140M) | ||
|
|
Total costs | ($354M) | ($516M) | |
| Total net benefits / (costs) under Delayed Conventional Delivery | $3,006M | $5,458M |
|
|
| Benefit cost ratio under Delayed Conventional Delivery | 9.48 | N/A |
| Benefits & costs under Conventional Delivery | NPV @ 2.00% | Real total | ||
|---|---|---|---|---|
| ∆ Travel time cost | $2,058M | $3,521M | ||
| ∆ Delays due to construction | ($50M) | ($54M) | ||
| ∆ Delays due to O&M | $11M | $19M | ||
| ∆ Delays due to incidents | $1,573M | $2,639M | ||
| ∆ Non-fuel costs | $132M | $217M | ||
| ∆ Fuel costs | ($140M) | ($213M) | ||
| ∆ Accident costs | $345M | $568M | ||
| ∆ Emissions cost | ($147M) | ($250M) | ||
| Highway benefits subtotal | $3,781M | $6,446M | ||
| ∆ Transit passenger benefits | $25M | $43M | ||
| ∆ Carpooling passenger benefits | $23M | $39M | ||
| Transit and carpool passenger benefits subtotal | $48M | $82M | ||
|
|
Total benefits | $3,829M | $6,528M | |
| O&M No Build cost savings | $248M | $400M | ||
| Real construction costs | ($408M) | ($435M) | ||
| Real operations costs | ($128M) | ($210M) | ||
| Real base variability | - | - | ||
| Real pure risks | - | - | ||
| Lifecycle performance risk | ($104M) | ($160M) | ||
|
|
Total costs | ($392M) | ($516M) | |
| Total net benefits / (costs) under Conventional Delivery | $3,437M | $6,012M |
|
|
| Benefit cost ratio under Conventional Delivery | 9.76 | N/A |
| Benefits & costs under P3 Delivery | NPV @ 2.00% | Real total | ||
|---|---|---|---|---|
| ∆ Travel time cost | $2,103M | $3,569M | ||
| ∆ Delays due to construction | ($36M) | ($38M) | ||
| ∆ Delays due to O&M | $14M | $22M | ||
| ∆ Delays due to incidents | $1,673M | $2,780M | ||
| ∆ Non-fuel costs | $136M | $221M | ||
| ∆ Fuel costs | ($148M) | ($221M) | ||
| ∆ Accident costs | $356M | $580M | ||
| ∆ Emissions cost | ($151M) | ($255M) | ||
| Highway benefits subtotal | $3,946M | $6,660M | ||
| ∆ Transit passenger benefits | $26M | $44M | ||
| ∆ Carpooling passenger benefits | $23M | $40M | ||
| Transit and carpool passenger benefits subtotal | $49M | $83M | ||
|
|
Total benefits | $3,995M | $6,743M | |
| O&M No Build cost savings | $257M | $410M | ||
| Real construction costs | ($388M) | ($410M) | ||
| Real operations costs | ($119M) | ($193M) | ||
| Real base variability | - | - | ||
| Real pure risks | - | - | ||
| Lifecycle performance risk | ($90M) | ($136M) | ||
|
|
Total costs | ($340M) | ($516M) | |
| Total net benefits / (costs) under P3 Delivery | $3,655M | $6,227M |
|
|
| Benefit cost ratio under P3 Delivery | 11.73 | N/A |
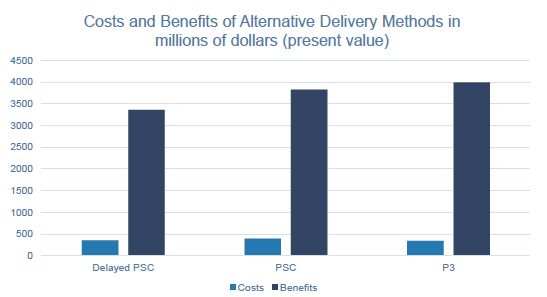
| Delayed PSC | PSC | P3 | |
|---|---|---|---|
| Costs | ~400 | ~450 | ~390 |
| Benefits | ~3400 | ~3700 | ~4000 |
P3 Program Manager
USDOT Build America Bureau
& FHWA Center for Innovative Finance Support
(202) 366-4076
Patrick.DeCorla-Souza@dot.gov