Understand Value Capture Tools and Federal Resources https://collaboration.fhwa.dot.gov/dot/fhwa/WC/SitePages/Register.aspx?WCID=2027
June 20, 2019
1:00 pm - 2:30 pm ET
Value Capture: Developer Contributions Techniques and Case Studies https://collaboration.fhwa.dot.gov/dot/fhwa/WC/SitePages/Register.aspx?WCID=2036
June 27, 2019
1:00 pm - 2:30 pm ET
Value Capture: Capital Improvement Plan https://collaboration.fhwa.dot.gov/dot/fhwa/WC/SitePages/Register.aspx?WCID=2037
July 18, 2019
1:00 pm - 2:30 pm ET
Value Capture: Special Assessment Techniques and Case Studies https://collaboration.fhwa.dot.gov/dot/fhwa/WC/SitePages/Register.aspx?WCID=2038
July 24, 2019
1:00 pm - 2:30 pm ET
Value Capture: Incremental Growth Techniques and Case Studies https://collaboration.fhwa.dot.gov/dot/fhwa/WC/SitePages/Register.aspx?WCID=2039
August 22, 2019
1:00 pm - 2:30 pm ET
Value Capture: Joint Development, Use ROW Agreement, and Case
Studies https://collaboration.fhwa.dot.gov/dot/fhwa/WC/SitePages/Register.aspx?WCID=2040
September 19, 2019
1:00 pm - 2:30 pm ET
Value Capture: Capture Value from Existing Assets to Fund Previously Unfunded Infrastructure Projects and Case Studies
https://collaboration.fhwa.dot.gov/dot/fhwa/WC/SitePages/Register.aspx?WCID=2041
October 24, 2019
1:00 pm - 2:30 pm ET
Value Capture: Advertising, Naming Rights, and Case Studies https://collaboration.fhwa.dot.gov/dot/fhwa/WC/SitePages/Register.aspx?WCID=2042
November 21, 2019
1:00 pm - 2:30 pm ET
Presentation 1 -
Value Capture: Capitalizing on the Value Created by Transportation
Forced contribution to raise revenue for the maintenance
of governmental services offered to the general public
Levied whether or not one uses a particular service
Value Capture (Fees/Assessments/Incremental Growth Tools)
Paid in exchange for a special service, benefit, or privilege
not conferred upon the general public
Not a revenue measure but a means of compensating the government
for the cost of offering and regulating the special service
or benefit
Payment of a fee is voluntary (can refuse the special service,
benefit, or privilege)
Value Capture Overview
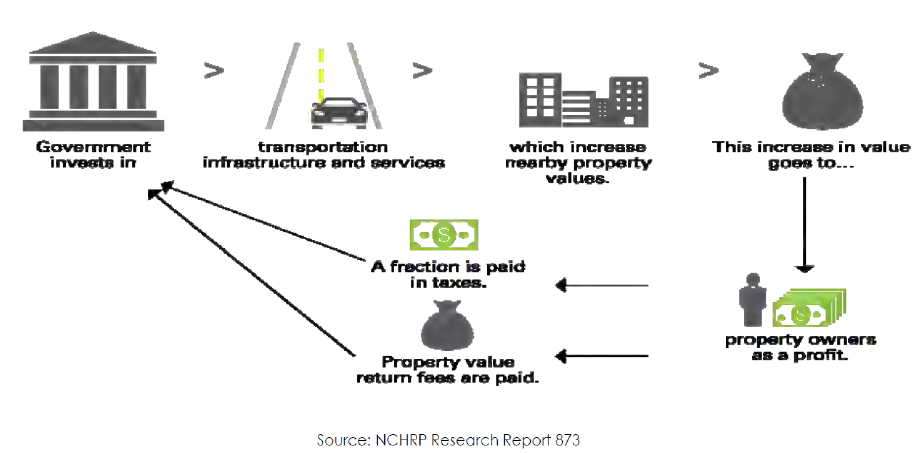
What is Value Capture?
"Value capture" refers to a toolbox of strategies used by public agencies to recover a portion of the increased property value created as a result of public infrastructure investment.
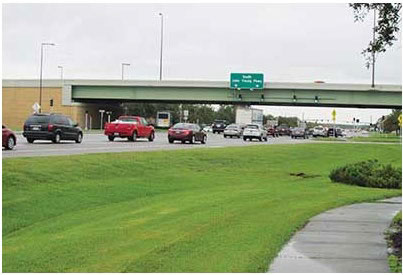
Examples of Transportation Improvements that Create Value
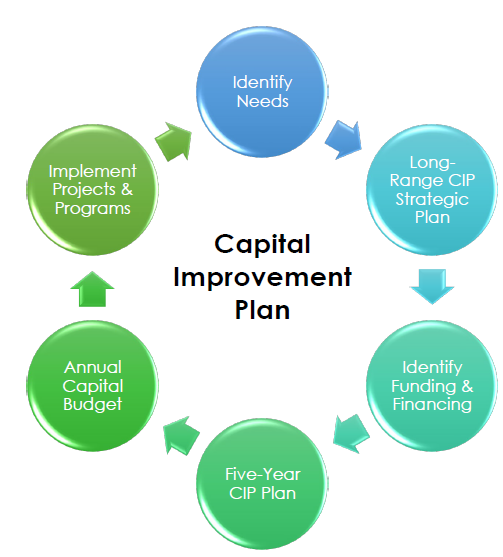
Identify Needs > Long-Range CIP Strategic Plan > Identify Funding & Financing > Five-Year CIP plan > Annual Capital Budget > Implement Projects & Programs > repeat ...
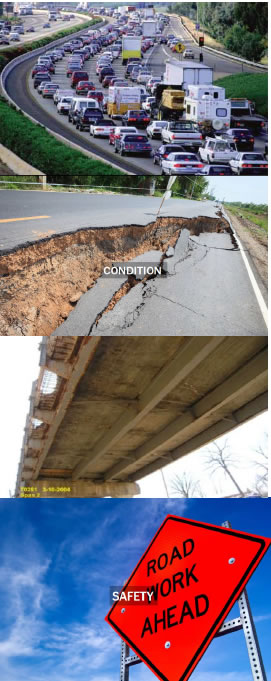
Why is Value Capture Needed?
Capacity & Conditions Funding Challenges
Two out of every five miles of America's urban interstates are
congested
Cost the country $160 billion in wasted time and fuel
One out of every five miles of highway pavement is in poor condition
$836 billion backlog of highway and bridge capital needs
35,092 people killed in motor vehicle crashes
Pedestrian deaths on US roads increased 11% since 2015; (5,977
in 2017)
Condition and Aging of the Bridges
(FHWA, 12/31/2018)
Year Built
Age
Total
Poor
No Value
No Value
25
25
1899 and earlier
119 or more
1,731
514
1940-1949
109-118
5,876
1,840
1910-1919
99-108
5,692
2,055
1920-1929
89-98
17,923
3,895
1930-1939
79-88
41,275
7,057
1940-1949
69-78
25,487
4,034
1950-1959
59-68
63,159
7,664
1960-1969
49-58
99,041
260,209
8,996
36,055
1970-1979
39-48
81,671
5,390
1980-1989
29-38
78,112
3,043
1990-1999
19-28
81,393
1,486
2000-2009
9-18
71,666
449
2010-present
0-8
43,445
91
Total
616,496
46,914
Condition of Roads (D+)
45% of America's major roads are in poor or mediocre condition
15% of U.S. rural roads are rated in poor condition, while 21%
are in mediocre condition
Ownership
Federal-Aid Highways (miles)
Non-Federal- Aid Highways (miles)
Total (miles)
Rural
668,082
2,280,612
2,948,696
Small Urban Area
71,792
151,935
223,7327
Urbanized
287,974
723,310
1,011,285
Urban
359,767
875,245
1,235,012
Total
1,027,848
3,155,858
4,183,707
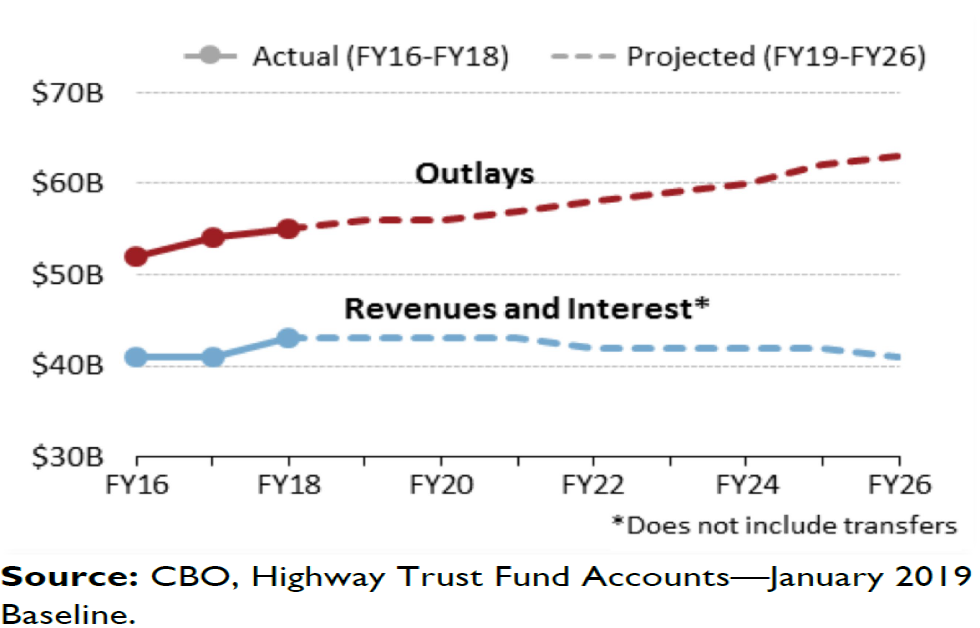
Highway Trust Fund is Unsustainable
Value Capture Mechanisms & Examples
Value Capture Techniques Summary
Developer Contributions
Special Assessments
Fees
Incremental Growth
Joint Development
Concessions
Advertising and Naming Rights
One-time charges collected by local governments from developers to offset the cost of infrastructure and services necessitated by new development.
An additional fee or tax assessed on businesses or residents in specified geographic areas benefiting proximity to a highway or other transportation facility or corridor.
Similar to a utility fee, transportation fees are assessed based on how individual businesses and households use transportation facilities.
A mechanism allocating back to infrastructure from some specified portion of increased property tax revenues fostered by new infrastructure - often for a specified period of time.
Sale or lease of land or air rights on or adjacent to transportation facilities. This can include donations of land or other in-kind resources from the private sector in ongoing commercial operations.
Sale or lease of government owned assets - such as toll roads or bridges - to private-sector investors/operators.
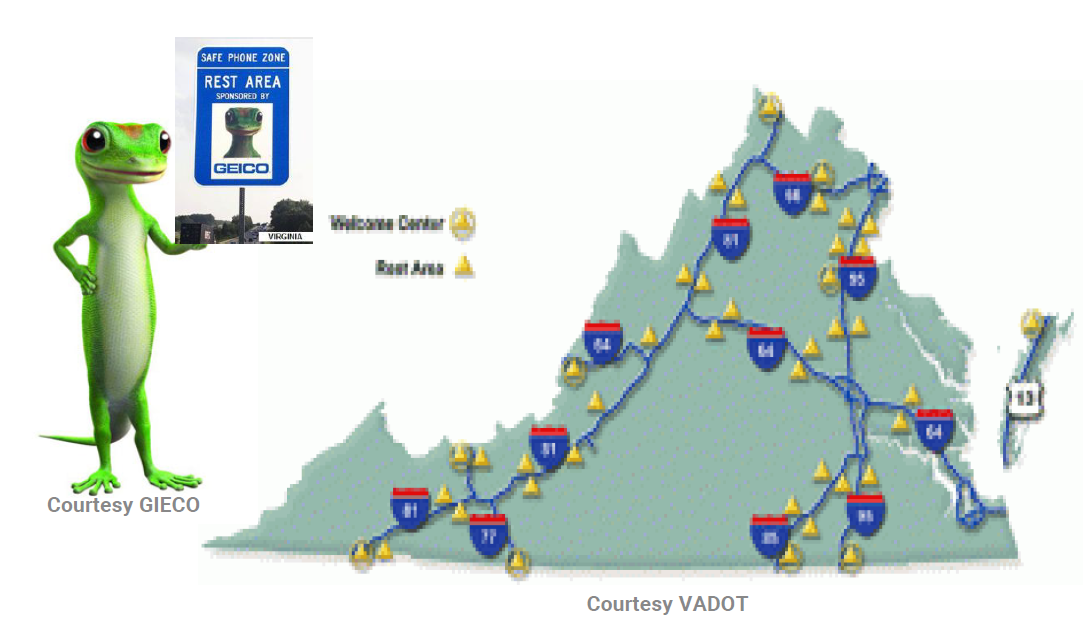
Sale of advertising space or naming rights on a transportation facility. Note: Commercial uses within Interstate Highway System right of way, including rest areas, is prohibited by law; however, they may be allowed on toll facilities and in transit stations.
Value Capture Techniques
Category
Technique
Purpose
Fund or Finance
Developer Contributions
Impact fees
Capital Expenses
Fund
Negotiated Exactions
Capital Expenses
Fund
Special Assessments
Special Assessment Districts
Capital Expenses
Fund or Finance
Business Improvement Districts
Capital or Maintenance
Fund or Finance
Sales Tax Districts
Capital or Maintenance
Fund or Finance
Land Value Taxes
Capital or Maintenance
Fund or Finance
Fees
Transportation Utility Fees
Operations and Maintenance
Fund
Incremental Growth
Tax Incremental Finance
Capital Expenses
Fund or Finance
Transportation Reinvestment Zones
Fund or Finance
Tax Allocation District
Fund or Finance
Joint Development
At Grade
Capital Expenses
Fund or Finance
Below Grade
Capital Expenses
Fund or Finance
Above Grade (Air Rights)
Capital Expenses
Fund or Finance
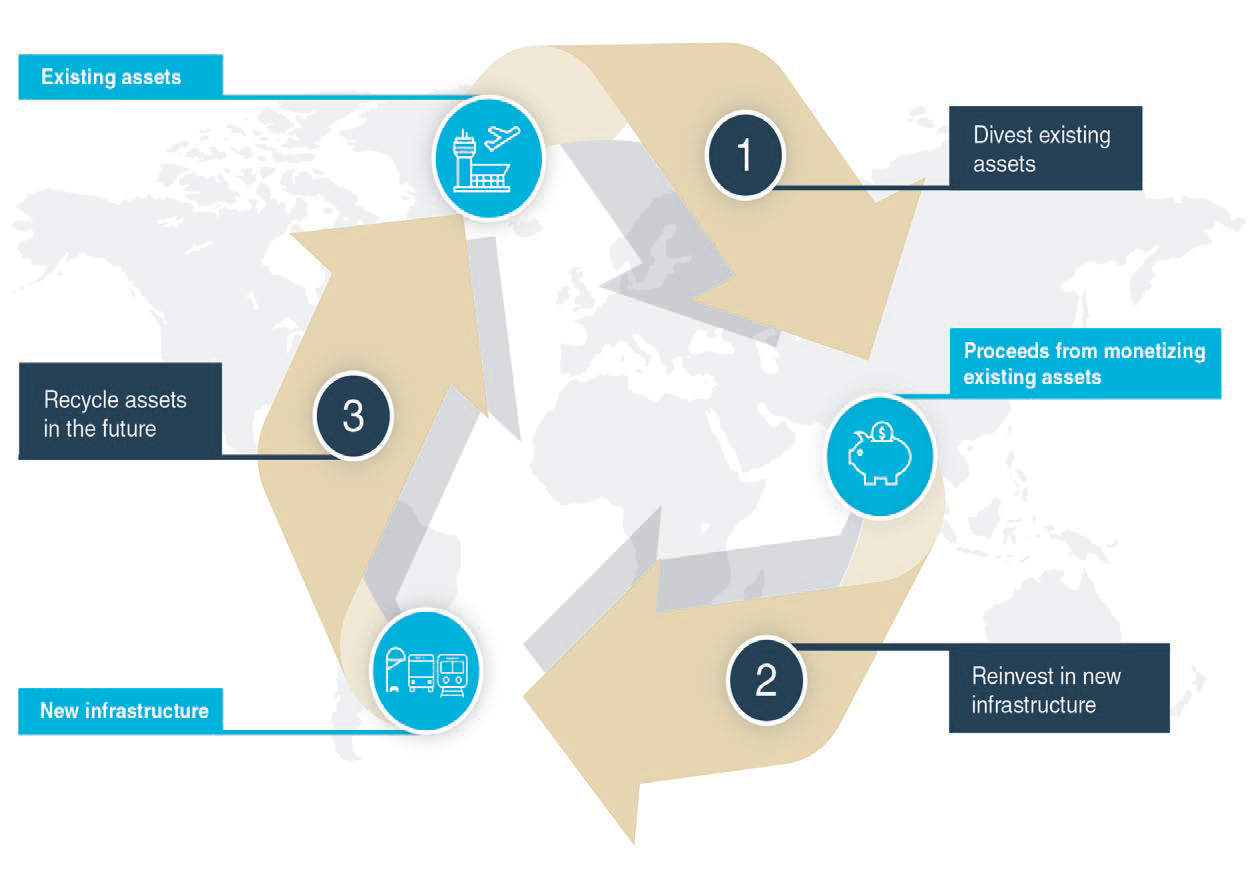
Concessions
Asset Recycling
Capital Expenses
Fund or Finance
Advertising & Naming Rights
Advertising
Capital or Maintenance
Fund
Naming Rights
Capital or Maintenance
Fund
Developer Contributions / Impact Fees
A one-time fee assessed on new development
Intended to pay the cost of expanding & extending public
services resulted from new development
Assessed at the time a building permit is issued and are paid
prior to the issuance of a Certificate of Occupancy
Rational nexus required
No voter approval is required
Covers the cost of new capital facility capacity
Used for roadways, less frequently used in transit
Osceola County Road & Bridge Program, Florida
Value Capture: Impact Fees
Created in 1987
Covering 1,506 square miles
Scope: Bundled 11 road projects with 13 bridges in Osceola County
Project Cost: $350 million
Funding: 100% locally funded by impact fees
Benefits: Nine out of every 10 construction dollars going to
local contractors. Speed up delivery and save money ($36 million
saving)
Special Assessment Districts
A special fee imposed by a local government to property owners
to pay for infrastructure development
Creates zone or geographical area
Property owners pay an assessment for specific improvements
or services
The assessment represents a portion of the estimated benefit
to properties in close proximity to the public project
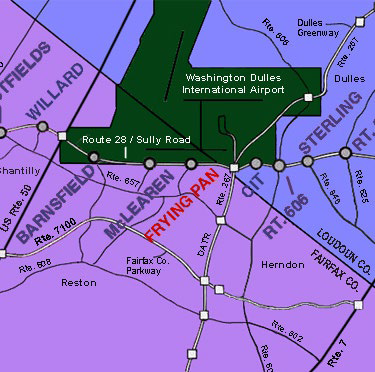
Virginia Route 28 Transportation Improvement District
District formed in 1987 jointly by Loudon and Fairfax Counties
Covers 10,204 acres of land, in an apprx. 14-mile-long corridor
Maximum tax rate of $0.20 per $100 of assessed value
Raises ~ $23 million in revenue
$138 million, 14 - mile widening from two to six lanes completed
in 1991
District and State share project costs 75/25
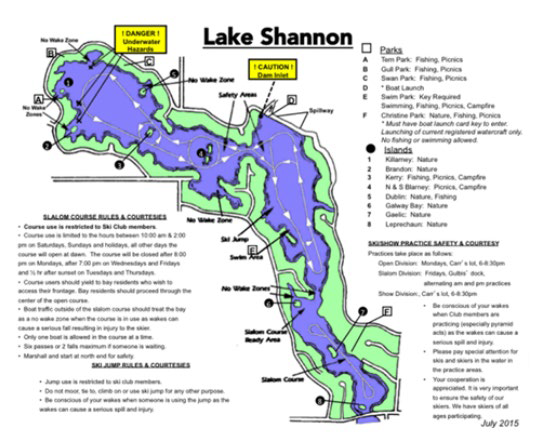
Lake Shannon Road Improvement, Tyrone Township, MI
Petition for repaving roads in exchange for a 10-year tax assessment
Assessment will be paid in 10 annual installments starting in 2018
Total cost $1,310,000 in special assessment bonds
Source: Lake Shannon Assoc.
Fees/Transportation Utility Fees
Applies to all residents and businesses
Paid by property occupants rather than property owners
Based on the estimated number of roadway trips generated by
a property
Fees are typically added to city utility bills
36 cities levying TUFs in five states: Oregon (23), Texas, Colorado,
Kansas, and Utah
All of the cities have populations under 100,000 people,
and nearly half have populations below 10,000
City of Newberg, Oregon
Used Transportation Utility Fee to pay for street repairs, routine
maintenance, and pavement preservation
Adopted the fee in May 2017
Fees
Single Family: $4.99/month
Multi Family: per unit
Non Residential: 6 classes based on vehicle trips generated,
per sq. ft.
Generated approximately $1.2 million for road maintenance
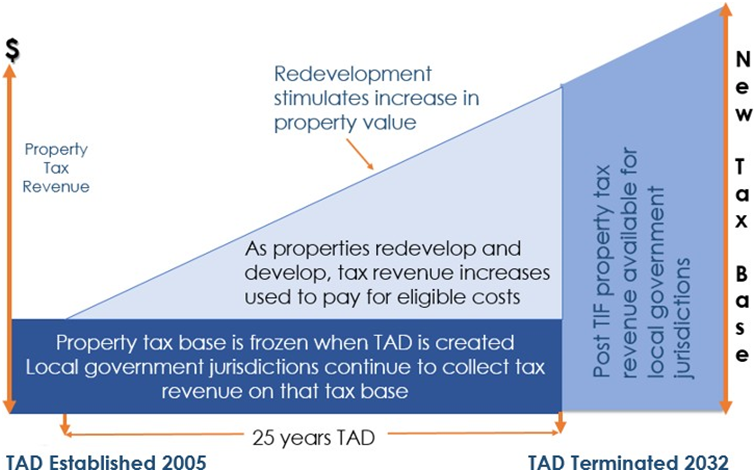
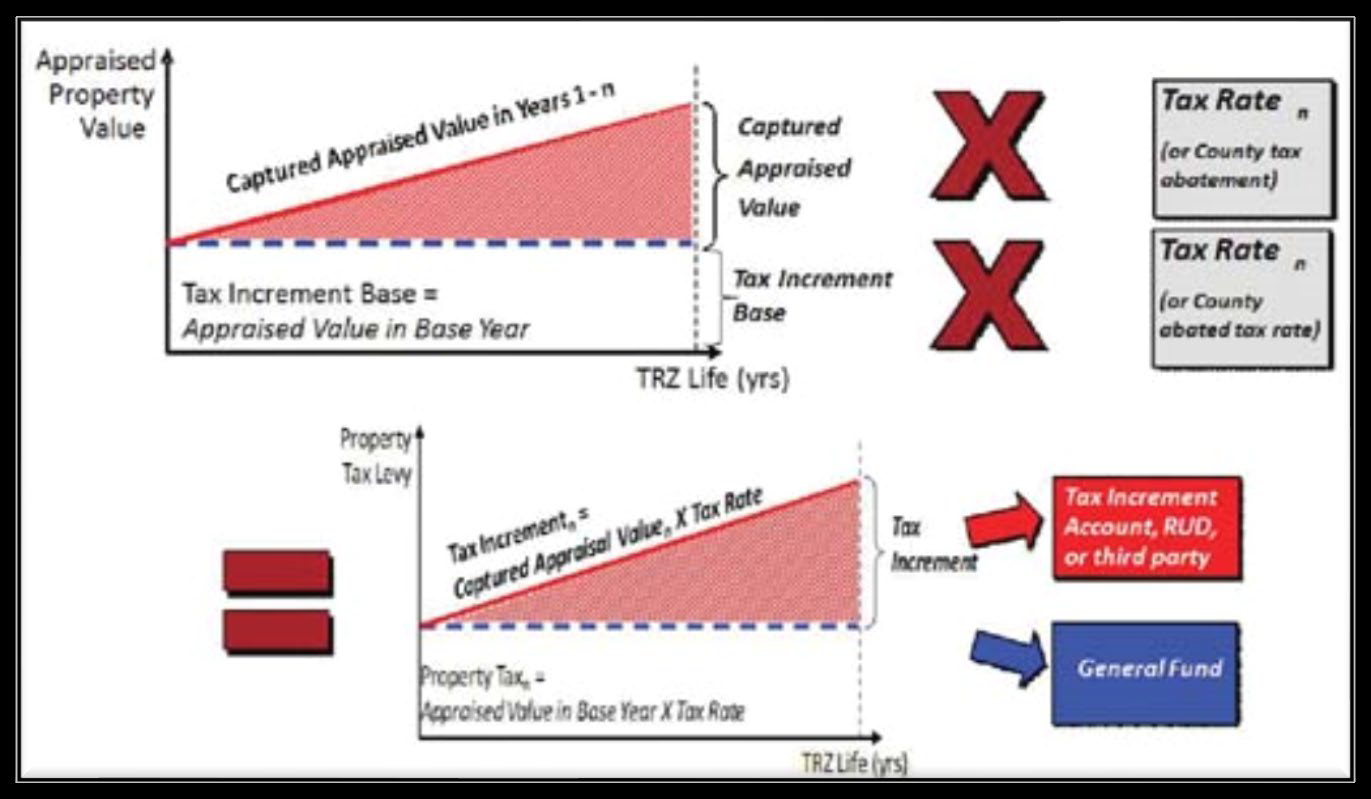
Incremental Growth: Tax Incremental Finance
Uses the incremental increase in property tax revenues to finance
new infrastructure and services
Authorized by state statutes in 49 states and the District of
Columbia
Requires the "but for" test - no growth/development
would happen but for the use of Tax Incremental Finance
Offers a source of long-term revenues and generates significant "gap
financing"
Flexible, powerful tool to foster high quality development and
redevelopment
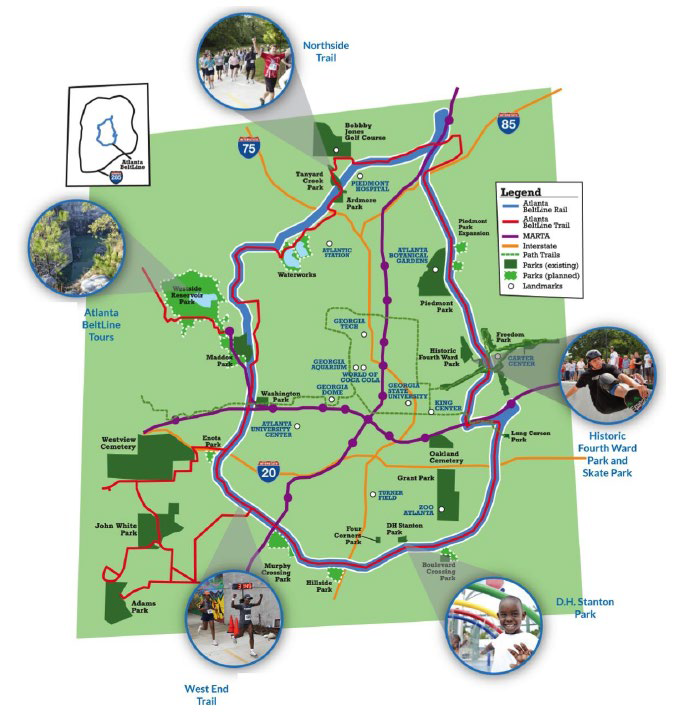
Atlanta Beltline Project
Value Capture: Tax Allocation District (TAD)
Adopted in 2005; Sunset in 2032
Length: 25 years
Scope: Redevelopment 6,500 acre area
Project Cost: $4.8 billion
Funding:
TAD: $1.75 billion
Federal: $1.45 billion
Private: $0.28 billion
City/State: $0.34 million
City/Park: $0.18 million
Others: $0.80 million
Finance: Tax-exempt bonds
I-10/Loop 375 Americas Interchange, El Paso, TX
Value Capture: Transportation Reinvestment Zones
Texas Legislation, 2007
El Paso established TRZ in 2008
Scope: I-10/Loop 375 Americas Interchange in the city of El Paso
Project Cost: $146 million (phase I)
Funding:
$96 million from ARRA
$30 million in SIB Loan
$5 million from TxDOT
$15 million from Border Infrastructure (CBI) funds
Joint Development
Involves a partnership between a public entity and a private
developer to develop certain infrastructure assets
At Grade - Development on the land near the
facility or at the facility
Below Grade - The ROW is leased to private
sector
Above Grade - The public agency sells or leases
the air rights for development
Plays key role in some urban projects
Often practiced in transit agencies
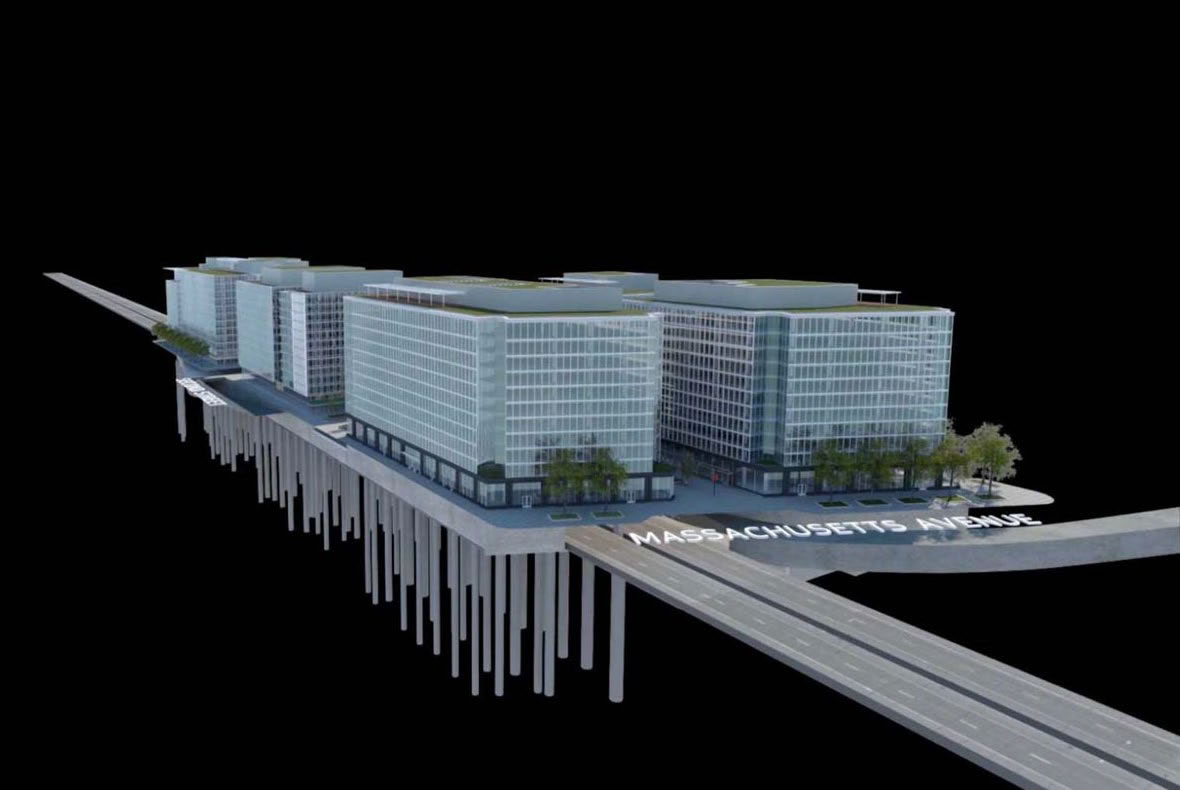
Capitol Crossing Air-Right Development Project, Washington, D.C.
Value Capture: Above Grade - Air Right
Sold the right to develop the property to Property Group
Partners (PGP) in 2012 for $120 million
Generate $40 M in new property taxes when completed
Scope: Seven-acre decked development site above I-395
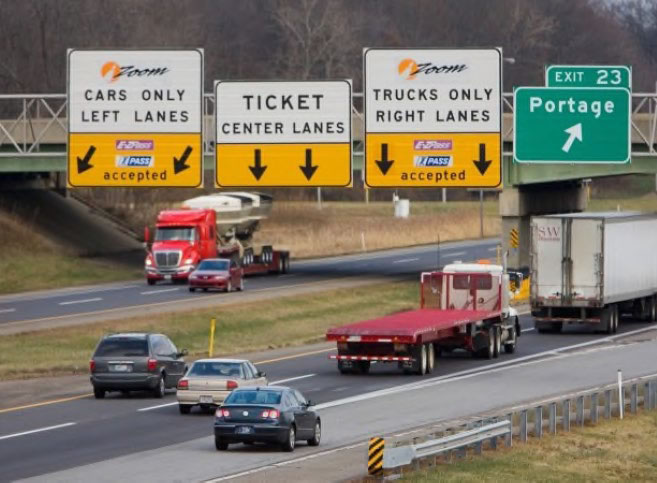
Owned by the State, but leased to concessionaire for 75 years - $3.8
billion
Funded 10 transportation plan
Retained all public employees
Performance Based Maintenance Standards
As of 2013, over $300 million has been invested in improvements
to the ITR
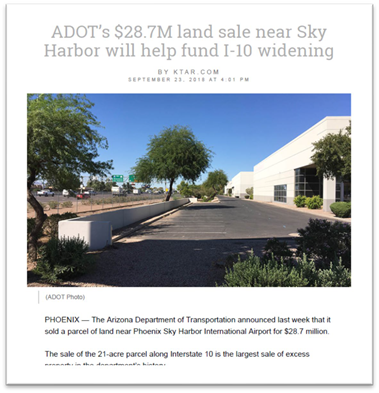
Arizona Land Sale
ADOT sold a 21-acre parcel of land along the north side of Interstate-10
near Phoenix Sky Harbor International Airport for $28.7 million
Proceeds will be used for the I-10 widening project
Advertising/Naming Right
Naming Right/Sponsorship: A financial transaction
and form of advertising whereby a corporation or other entity purchases
the right to name a facility or event, typically for a defined period
of time.
Advertising: Revenue derived by selling space
on transportation facility assets such as inside/outside transit
vehicles, transit stations, bus stops, and roadway billboards
Thay Bishop, FHWA Office of Innovative Program Delivery
Stefan Natzke, FHWA Office of Planning, Environment, and Realty
Members
Jennifer Ahlin, Virginia Department of Transportation
Janine Ashe, FHWA District of Columbia Division
David Cohen, FHWA Office of Project Development & Env. Review
John Duel, FHWA Office of Planning, Environment, and Realty
Kathleen Hulbert, FHWA Infrastructure Office
Chip Millard, FHWA Freight Management & Operation
Diane Mobley, FHWA Chief Counsel Office
Kevin Moody, FHWA Resource Center
Ben Orsbon, South Dakota Department of Transportation
Jill Stark, FHWA Office of Planning, Environment, and Realty
Lindsey Svendsen, FHWA Office of Planning, Environment, and
Realty
Jim Thorne, FHWA Office of Planning, Environment, and Realty
Bingxin Yu, FHWA Transportation Policy Studies
VCIT Focus Areas
Communication - Developing the tools to help
FHWA staff and others promote Value Capture to local public agencies
(Value Capture Implementation Manual)
Technical Assistance - Providing technical
assistance to agencies interested in pursuing Value Capture (Peer
Program)
Clearing House (website)
- Identification of best practices and lessons learned and promoting
further discussion on innovative funding options for local public
agencies, lessons learned from past and current efforts, etc.
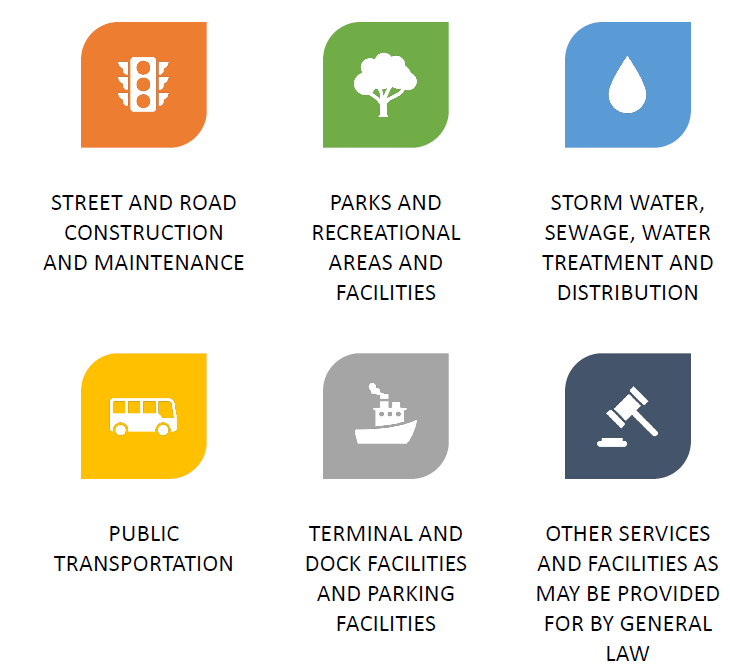
STORM WATER, SEWAGE, WATER TREATMENT AND DISTRIBUTION
PUBLIC TRANSPORTATION
TERMINAL AND DOCK FACILITIES AND PARKING FACILITIES
OTHER SERVICES AND FACILITIES AS MAY BE PROVIDED FOR BY GENERAL LAW
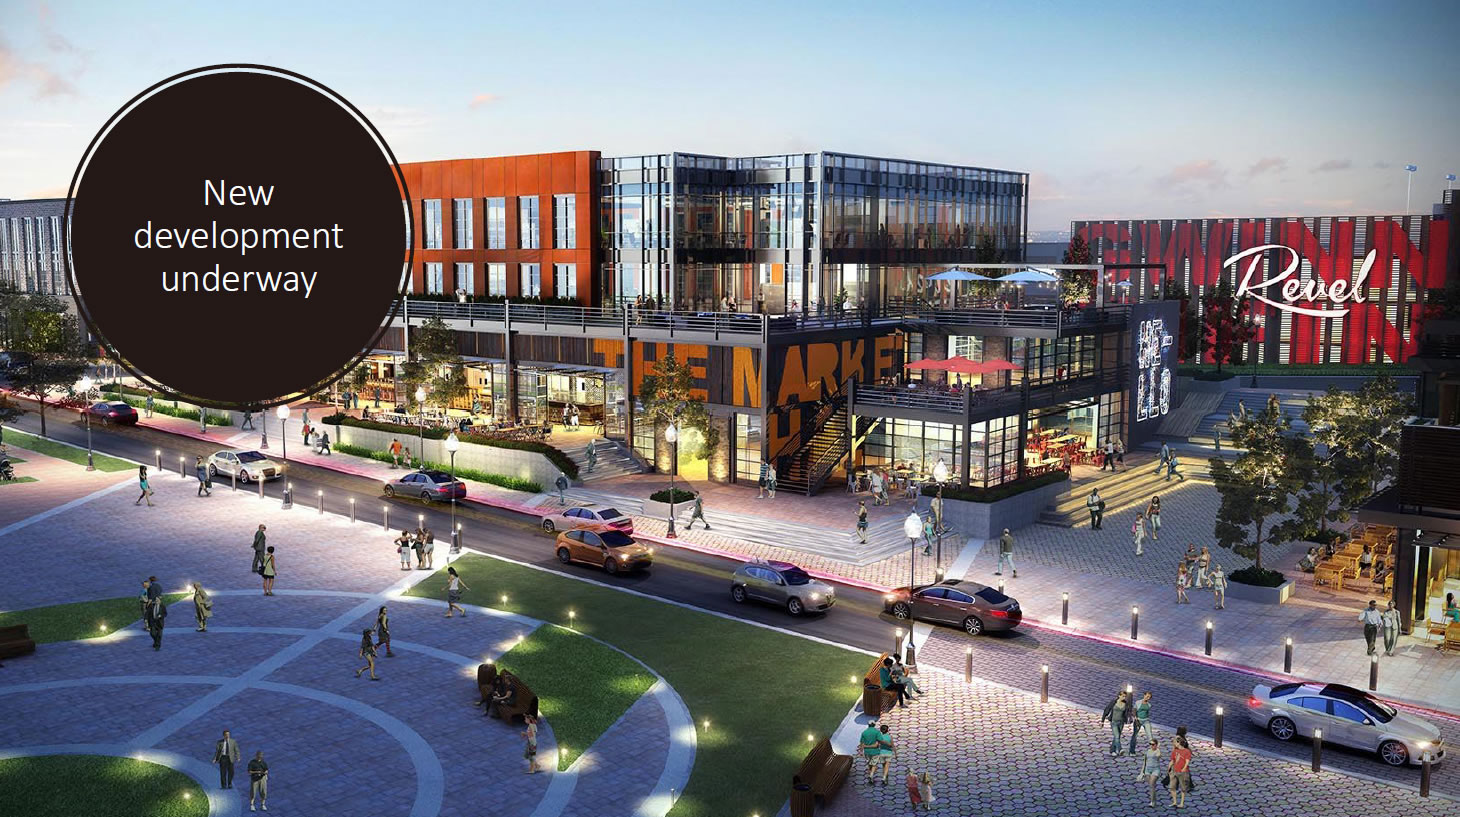
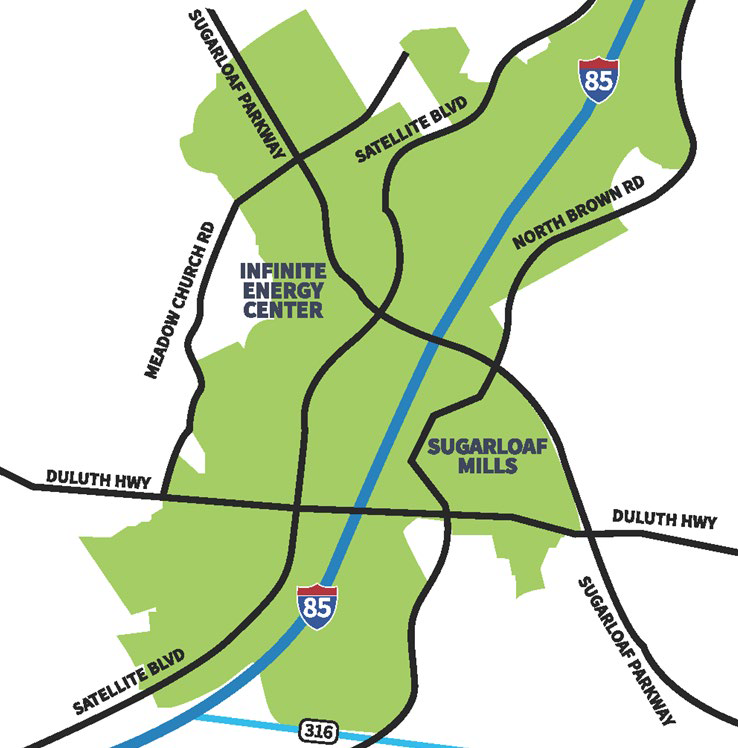
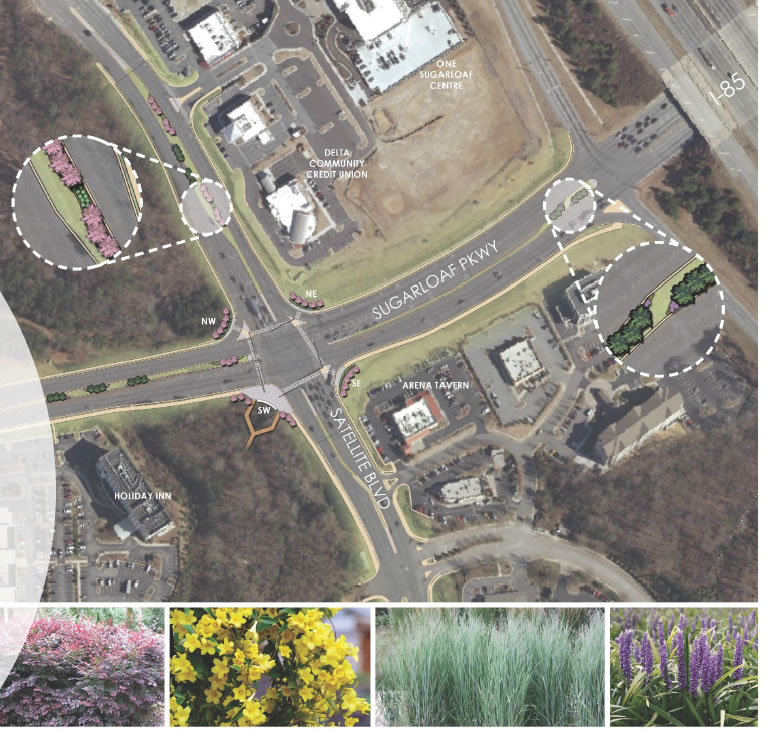
Sugarloaf CID Context
Formed in 2016
71 parcels
Millage rate: 3.5
Business and entertainment district:
23,544 jobs
Infinite Energy Center (over 1M visitors each year)
New development underway
Task
#1: Identify initial projects for SPLOST funding opportunities
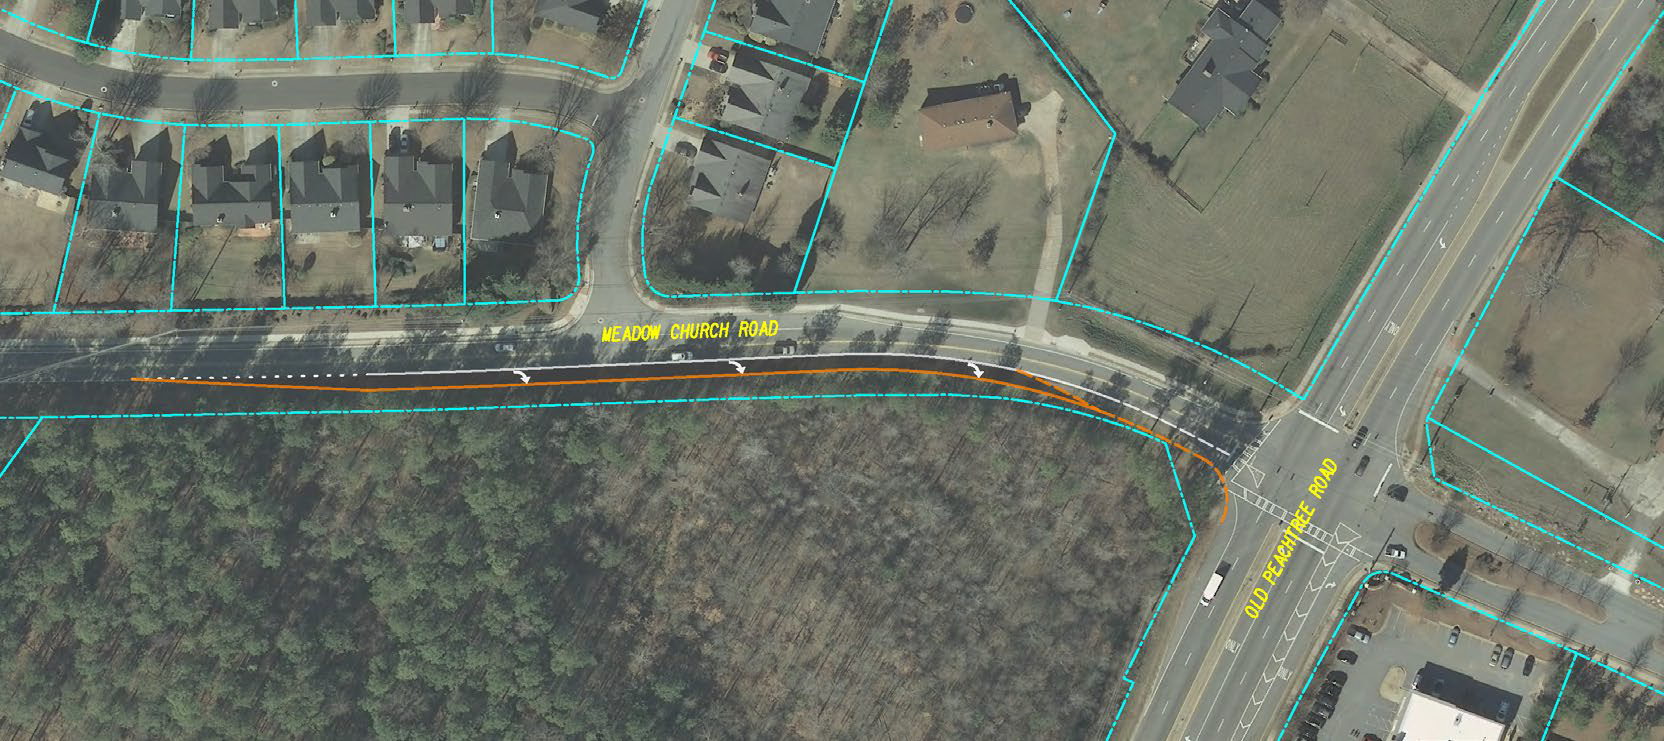
Over $7M leveraged for intersection and pedestrian projects in our
CID
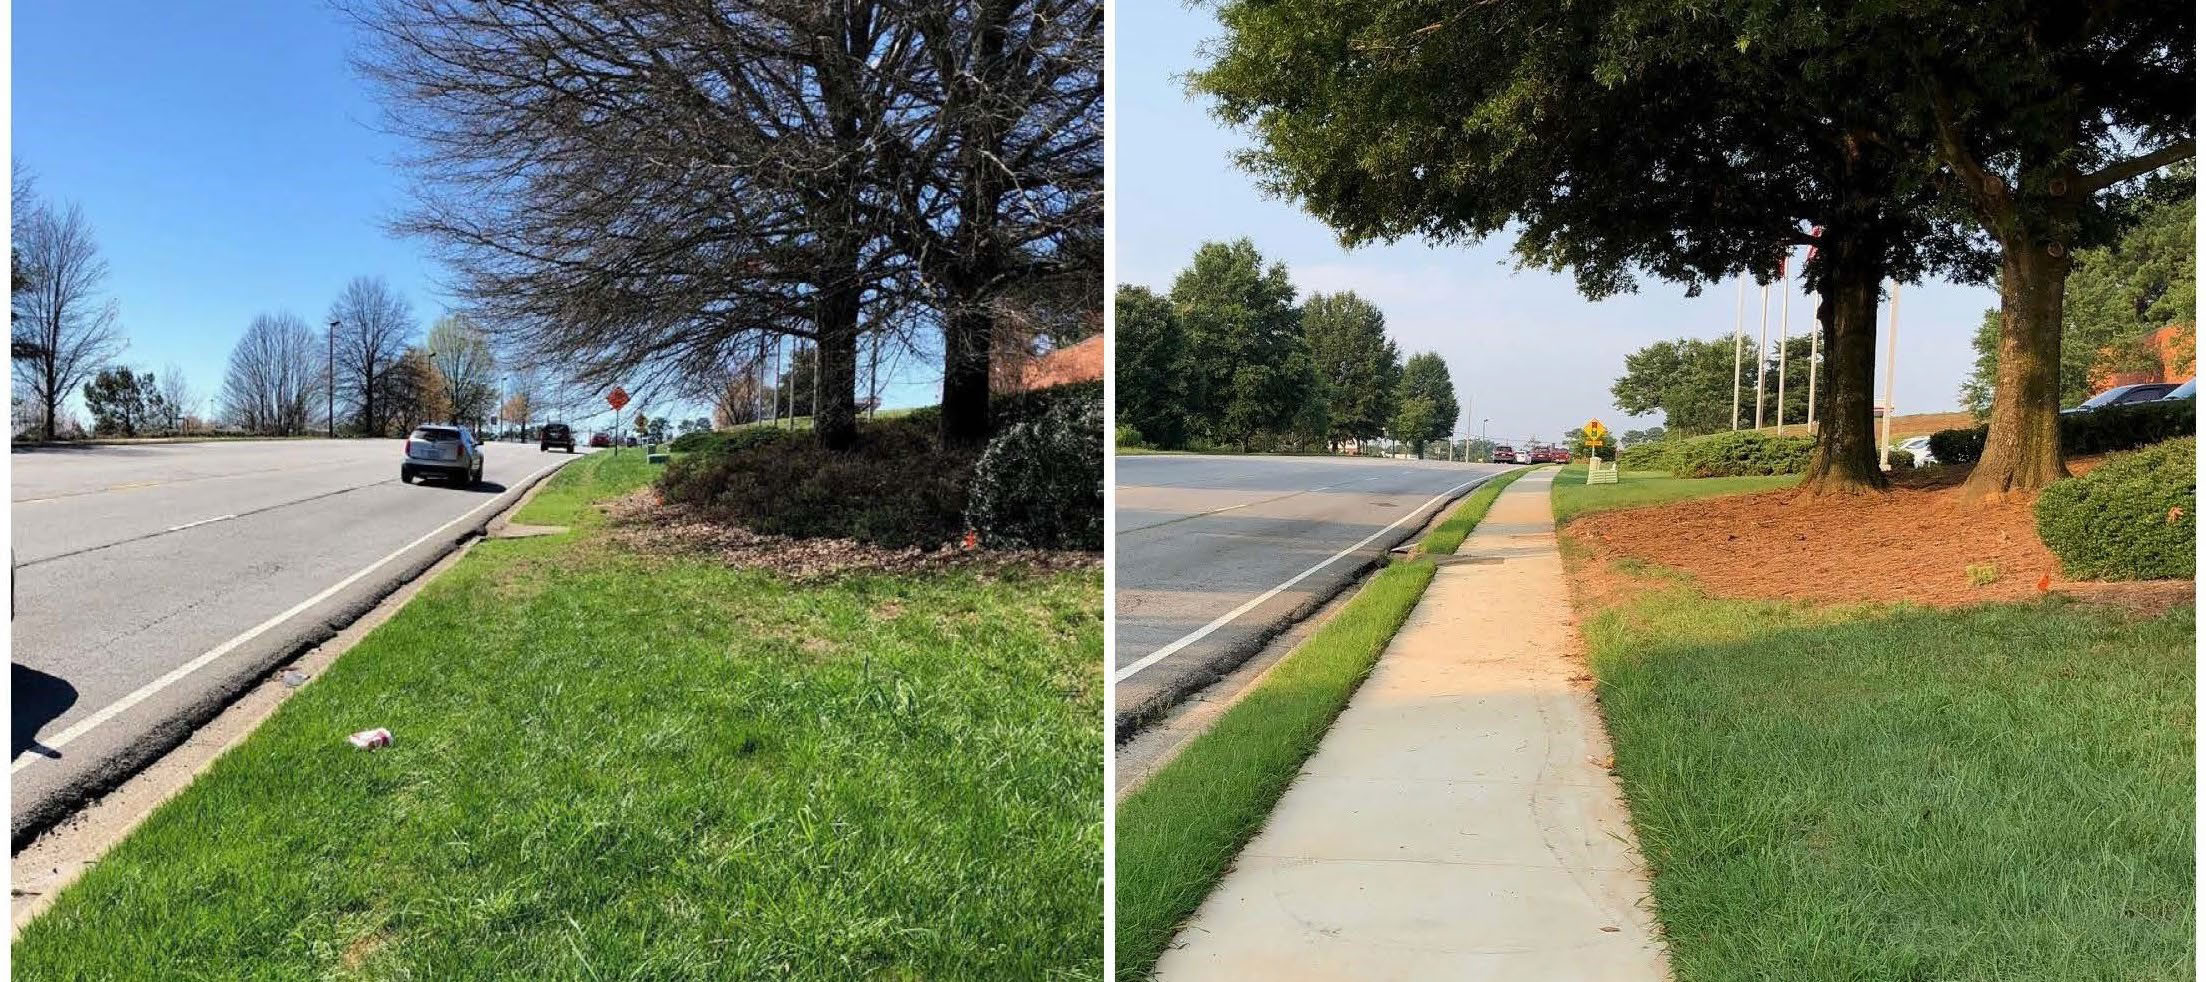
Initial projects completed
Right turn lane built through Gwinnett DOT quick fix program at no cost
to the CID
Three sidewalk projects completed with SPLOST funds
Project underway: Sugarloaf at Satellite intersection improvements
Additional lanes/turn lanes funded by SPLOST ($4M)
Aesthetic upgrades funded by CID (cost TBD):
Mast arms
Pavers
Landscaping
Loop Trail
Regional trail project connecting the Sugarloaf CID to parks,
cities, and the Gwinnett Place CID
$100,000 grant from the Atlanta Regional Commission for a feasibility
to advance the project - the CID is contributing $12,000 for the local match
Project is in partnership with Gwinnett County DOT
Sugarloaf Livable Centers Initiative Master Plan
Funded by the CID and Gwinnett County
Projects in the plan are eligible for grant funding
BRT Corridor Study
$400,000 grant to plan for land use and development for bus
rapid transit service connecting Jimmy Carter Boulevard to Sugarloaf
Parkway
Connects three CIDs
Local match:
$325,000 from Gwinnett County
$25,000 from each CID
Other CID initiatives
Security, landscaping, and signage
CIDs are critical champions for advancing projects.
Presentation 3 -
TRANSPORTATION REINVESTMENT ZONES
How communities can leverage
local funds for transportation projects
Date: June 20, 2019
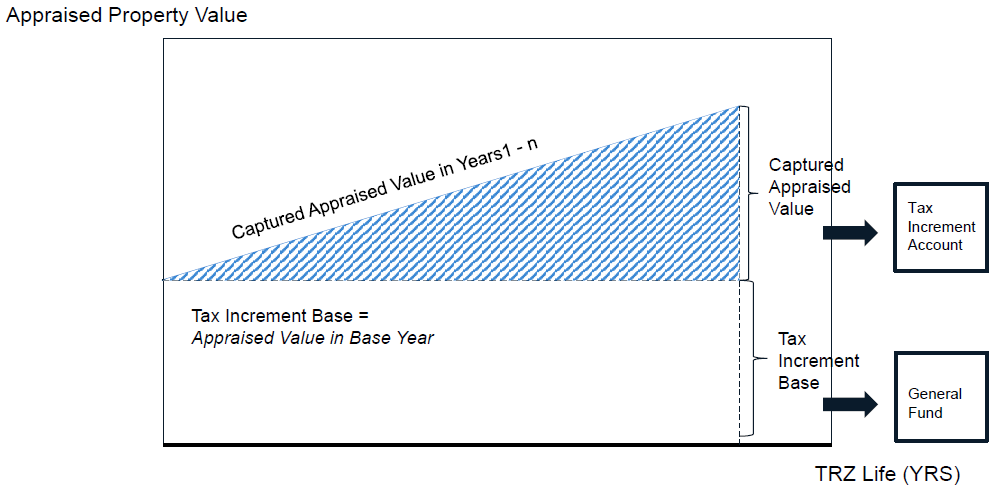
BACKGROUND: WHAT IS A TRZ ?
What is a Transportation Reinvestment Zone
Transportation Reinvestment Zones are a tool that were created
in the 2007 legislative session (Senate Bill 1266) as a value capture method for transportation projects where
VC revenues are set aside to finance a project
House Bill 563 (2011) - introduced significant
changes that increased implementation flexibility. Previously tied
to Pass Through projects, but have steadily gained interest since
the tool became more flexible.
A TRZ is a specific contiguous zone around a planned
transportation project that is established as a method to facilitate
capture of the property tax increment arising from the planned project
Currently there are three taxing entities that can create a
TRZ in Texas: County, Municipality, and Port Authority/Navigation
Districts
Value Capture Mechanism
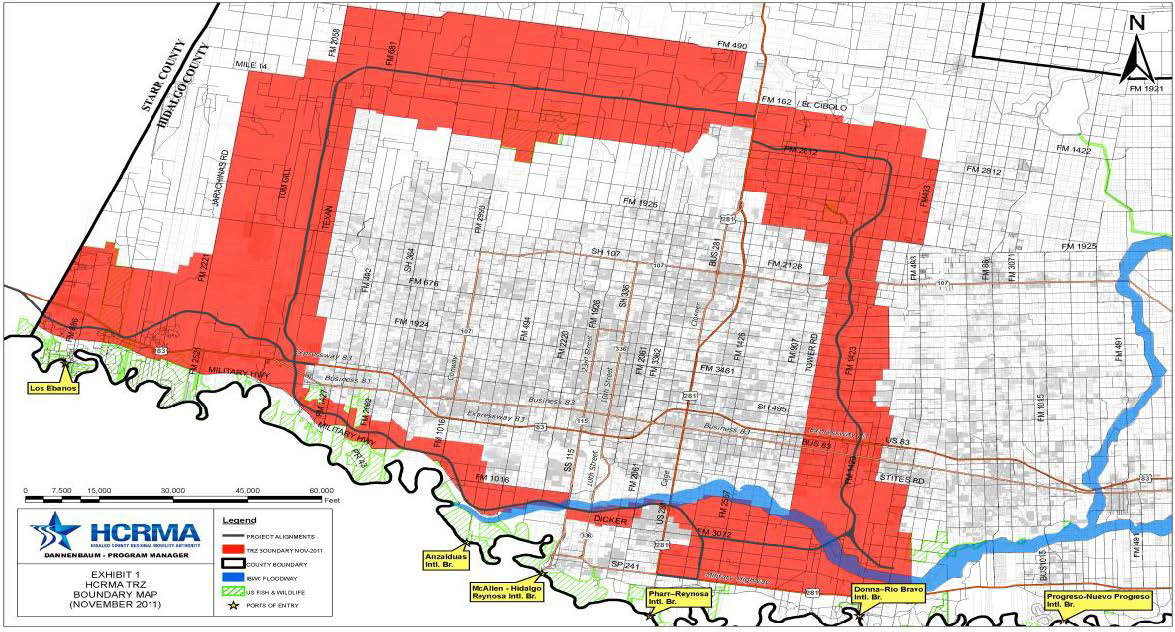
Hidalgo County TRZ No 2
What is a Transportation Reinvestment Zone
Why use a TRZ and how to find the appropriate project:
Allows a community to capture both existing economic
growth as well as expected growth generated from the
transportation project.
A TRZ can be used in conjunction with other financing mechanism
to fund a transportation project.
Why haven't they been used more?
Has only been detached from Pass Through Toll project
since 2011
Communities are familiar with TIRZ/TIF
What's the difference with a TIRZ
TIRZ/TIF typically used to support non-transportation
tools, primarily seen in urban areas
A TRZ does not require a board
What should be included/considered in a TRZ feasibility analysis
The following are recommended items to include and consider in the preparation
a TRZ capacity analysis:
Clear overview of the zone, map, zone delineation, parcel listing
(if available)
List of Participating local governments considering a TRZ for
the project (city, multiple cities, etc.)
Assumptions of the study:
The percentage of the property tax value increment in the
Zone that is under consideration by the local government
Number of years included in the analysis
Assumed base year of establishment of the TRZ
Parcel analysis, including zoning types considered and current
breakdown of zoning included in the potential TRZ (e.g: residential,
commercial etc.)
The netting out of existing properties that would not contribute
to the revenues (ie: other TIRZ, TIF, abatement agreements, or tax-exempt
property)
30 years of revenue estimates, including a cash flow table in
both nominal and NPV figures
Historical property value growth trend analysis, based on Central
Appraisal District data
Multiple Economic growth models, i.e. pessimistic, base and
optimistic revenue estimate scenarios
FINANCING
Can a TRZ finance a transportation project in its entirety?
A local government with a created TRZ can use the captured funds
directly toward a transportation project or as a pledge for a method
of financing (for cities and ports that could include bond issuance)
Tax Increment Bonds
Tax increment bonds can have high costs due to ratings when
compared to other municipal debt mechanisms
TxDOT State Infrastructure Bank Loans
The SIB program allows borrowers to access capital funds
at or lower-than-market interest rates.
GO backstop required
Work eligible for the program's funding includes: planning
and preliminary studies; feasibility, economical and environmental
studies; right of way acquisition; surveying; appraisal and
testing; utility relocation; engineering and design; construction;
inspection and construction engineering.


 Hidalgo County TRZ No 2