Developer Contributions - One-time charges collected by local governments from developers to offset the cost of infrastructure and services necessitated by new development.
Special Assessments - An additional fee or tax assessed on businesses or residents in specified geographic areas benefiting proximity to a highway or other transportation facility or corridor.
Fees - Similar to a utility fee, transportation fees are assessed based on how individual businesses and households use transportation facilities.
Incremental Growth - A mechanism allocating back to infrastructure from some specified portion of increased property tax revenues fostered by new infrastructure - often for a specified period of time.
Joint Development - Sale or lease of land or air rights on or adjacent to transportation facilities. This can include donations of land or other in-kind resources from the private sector in ongoing commercial operations.
Concessions - Sale or lease of government owned assets - such as toll roads or bridges - to private-sector investors/operators.
Advertising and Naming Rights - Sale of advertising space or naming rights on a transportation facility. Note: Commercial uses within Interstate Highway System right of way, including rest areas, is prohibited by law; however, they may be allowed on toll facilities and in transit stations.
Outline of Presentation
Key Distinctions
Special Assessments Overview
Why is Special Assessment Needed?
Transportation Improvement District
Community Development District
Federal Roles
Case Studies
Q&A
Key Distinctions: Funding vs. Financing
Revenue/Funding: Where does the funding come from?
Traditional: Federal-aid (HTF) & State grants
Innovative: Other than traditional i.e. Value Capture
Financing: Pay-As-You-Go versus Borrowing
Pay-as-you-go
Public borrowing (Innovative Finance)
Private equity
Project Delivery: Shifting responsibility & risk
Traditional (design-bid-build)
Construction Manager/General Contractor (CM/GC)
Design-Build (DB)
Public-private partnerships (P3s)
Key Distinctions: Taxes vs. Assessments
Is an assessment a tax? No.
Differences
Taxes
Assessments
Primary purpose is to raise revenue
Primary purpose is to recover costs
Need not benefit property owners
Must specifically benefit property owners
Authorization by general law
Authorization by home rule powers
Legislature must prescribe a tax base
Local Governments may develop the rate of assessment and method of apportioning costs
Proportionality not required
"Reasonableness" required
Why is Special Assessment Needed?
Capacity & Conditions Funding Challenges
Two out of every five miles of America's urban interstates are congested
Cost the country $160 billion in wasted time and fuel
One out of every five miles of highway pavement is in poor condition
$836 billion backlog of highway and bridge capital needs
35,092 people killed in motor vehicle crashes
Pedestrian deaths on US roads increased 11% since 2015; (5,977 in 2017)
Condition and Aging of the Bridges
(FHWA, 12/31/2018)
Year Built
Age in years
Total bridges
Poor quality
No Value
No Value
25
0
1899 and earlier
119 or more
1,731
514
1940-1949
109-118
5,876
1,840
1910-1919
99-108
5,692
2,055
1920-1929
89-98
17,923
3,895
1930-1939
79-88
41,275
7,057
1940-1949
69-78
25,487
4,034
1950-1959
59-68
63,159
7,664
1960-1969
49-58
99,041
8,996
1899-1969
119-49
260,209
36,055
1970-1979
39-48
81,671
5,390
1980-1989
29-38
78,112
3,043
1990-1999
19-28
81,393
1,486
2000-2009
9-18
71,666
449
2010-present
0-8
43,445
91
Total
616,496
46,914
Condition of Roads (D+)
45 % of America's major roads are in poor or mediocre condition.
15% of U.S. rural roads are rated in poor condition, while 21% are in mediocre condition
Ownership
Federal-Aid Highways
Non-Federal-Aid Highways
Total
Rural
668,082
2,280,612
2,948,696
Small Urban Area
71,792
151,935
223,7327
Urbanized
287,974
723,310
1,011,285
Urban
359,767
875,245
1,235,012
Total
1,027,848
3,155,858
4,183,707
Highway Trust Fund is Unsustainable
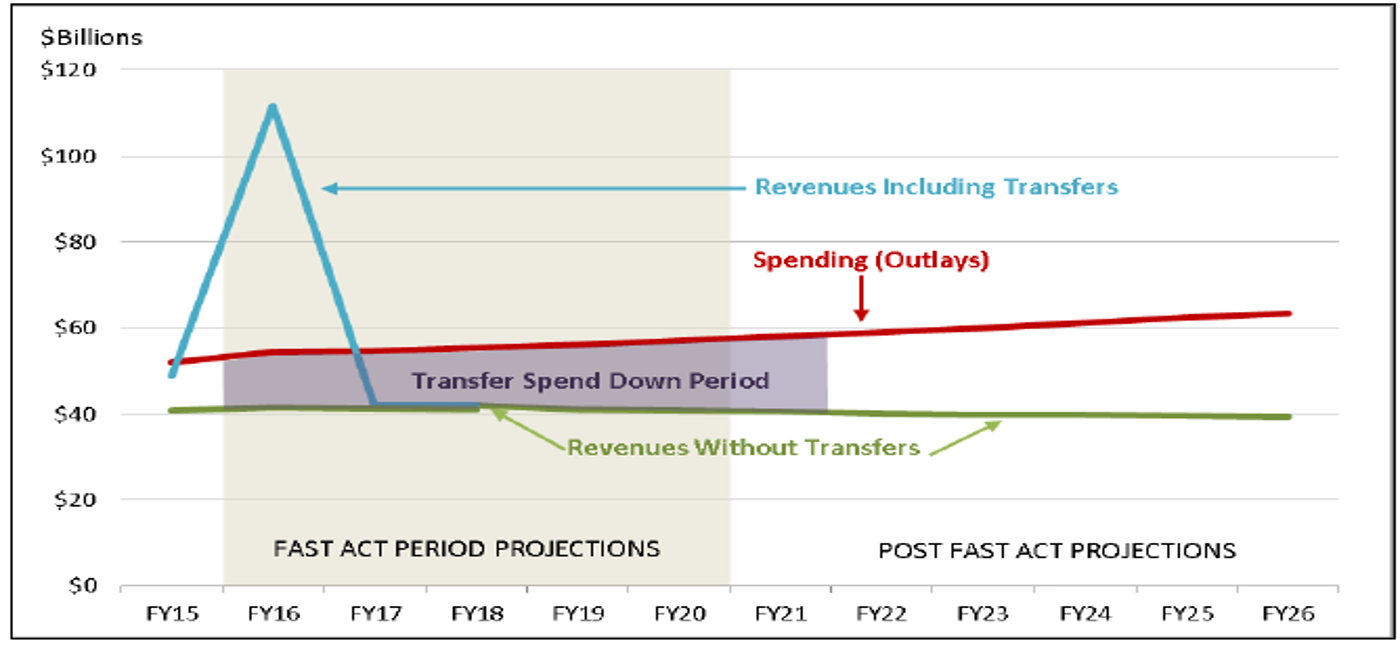
Special Assessment Districts
Special Assessment Districts Overview
A fee imposed on property owners to help pay for public infrastructure improvement
Authorized in 50 States and accessed by Local Governments
A defined geographic areas determined to benefit from special services or improvements
Assessment must in proportion to the special benefits received from the improvements
Must have majority support of those properties being accessed to be effective
Operated by a separate political subdivision with a board of directors
Benefits: Special Assessment Districts
Promotes economic development, job creation, and an increased tax base for local governments
Alleviate burden of increase in property taxes to the entire community
Preserves debt capacity of jurisdictions
New source of capital funding
Provide a reliable source of funding for local governments
Competitive advantage among public agencies
Access to Federal Innovative Finance Program
Source of matching state & Federal grants
Structures/Models: Two Types
Government Districts (Transportation Improvement District/Transportation Development District)
Initiated by the local government (sometime self assessed)
Establish specific assessment duration
Community Improvement District (Business Improvement Districts/Neighborhood Districts)
Voluntarily imposed assessment/fee by the property owners
Establish specific assessment duration
Transportation Improvement Districts
Government Special Assessment Districts By Any Other Name...
Special Assessment District (SAD)
Community Facilities District (CFD)
Community Development District (CDD)
Special Service District (SSD)
Transportation Improvement District (TID)
Transportation Development District (TDD)
Others
Overview
Formed as a separate political subdivision with a board of directors
Can levy special assessments and/or collect sales taxes on retail sales within the district
Focus on transportation infrastructure improvements & services within the district
Fixed amount of time
Notice and public hearing is required if sales tax levy is involved, but not if only special assessment
Must be uniformly applied to the same class of property
Subject to voter referendum
Transportation Improvement District & Innovative Finance
Matching Share for Federal & State grant
Federal Credit Assistance Program
TIFIA/RRIF
TIFIA/State Infrastructure Bank
Section 129 Loans
State Infrastructure Banks
Capital Market
Revenue Bonds
General Obligation Bonds
Private Equity
Project Delivery: DBB, DB, CMGC, P3s
Steps in Establish Special Assessment District
Determine Boundary & Improvement (Review State, Local, and MPO Plans and Policies)
Stakeholder/ Community Outreach
Feasibility Study Engineer's Report (cost & budget)
A six-year property assessment to all property owners benefits of street light system improvements
Applied to all property owners, residential, commercial, and industrial properties
Project scope: Provide a standardized public street lighting system citywide that will promote safety and security in our neighborhoods, business districts, and across the city's 1,800 lane-miles of roadways.
Project Cost $18 million for six-years
No assessment to neighborhoods without street lighting and neighborhood-supported street lighting
U.S. Highway 36 - Interstate 72 Corridor Transportation Development District
Value Capture: Sales & Use Tax Districts/Transportation Development District
Voters approved a half-cent sales tax on all taxable transactions in April 2005 to construct Route 36/I-72
Within the boundaries of the district.
Length 15 years
The four-lane was finished in 2010
Repealed in August 2017 after paid off debt obligation
Scope: 52 - mile expansion project of U.S. Highway 36 from two to four lanes
Project Cost: $75.5 million
$34.3 million borrowed from Missouri Transportation Finance Corporation (MTFC) in 2008
Community Improvement Districts
Community Improvement Districts By Any Other Name...
Local Improvement District
Public Improvement District
Special Service Area (SSA)
Community Improvement District (CID)
Neighborhood Business District (NBT)
Special Improvement District (SID)
Business Improvement District (BID)
Business Improvement Area (BIA)
Business Revitalization Zone (BRZ)
Tourism Public Improvement District
Community Improvement Districts
A development tool that allocates costs according to the benefits received
Formed by local business and property owners
Self-imposed and self-governed assessment to fund infrastructure improvements and services
Not a political subdivision of the state, county or municipality- No separate taxing authority
Only property in the district impacted; No other property effected
Requires majority support from property owners (>50%)
Benefits: Community Improvement Districts
Can finance a wide variety of services including transportation improvements
Provide economic development services by working to attract, retain and expand businesses
Leveraging resources
Can provide cap on assessments and periodic review to ensure that CID services are effective
Creating a unified voice to increase a business district's influence
Creating and maintaining a cleaner, safer and more attractive business district
Creation of Community Improvement District (Local Level)
CID Enabling Legislation
Buy-In
Obtain Signatures from >50% of Property Owners
Certification
Submit Consent Forms & Map to Tax Commissioner(s) for Certification
Petition
Submit Tax Commissioner Certification(s) Consent Forms, and Map to Jurisdiction(s)
Resolution
Each Jurisdiction Approving the CID Adopts a Resolution Approving Creation of that CID
Cooperation Agreement
CID Elects a Board and Develops a Cooperation Agreement with Each Jurisdiction
Governance & Administration
The CID is governed by a Board of Directors (5 - 30)
Elected by registered voters living within the CID's boundaries, but if there are no registered voters, then the property owners within the district (who have one vote per acre of real estate owned)
Has to be either an owner of real estate within the district or of a business operating within the district or be the authorized representative of same, or be a registered voter residing within the district
Administration: Most have a management company or staff
What Powers Does the CID Have?
To acquire real estate within its boundaries
To sell real or personal property
To borrow and loan money
To receive grant from State, Federal and Private Sector
To construct, install, maintain, and equip any of the public improvements and services
Ongoing CID Responsibilities
Sunshine Law compliance
Annual budget submittal
Annual meeting
Report to municipal clerk and Dept. of Economic Development
Report to State Auditor's office
Board member elections/appointments
Cooperative Agreement compliance
Accountable to those who pay consisting of property and business owners within the district
Federal Roles
Federal's Role in Value Capture Strategies
Value Capture Implementation Team
Co-Leads
Thay Bishop, FHWA Office of Innovative Program Delivery
Stefan Natzke, FHWA Office of Planning, Environment, and Realty
Members
Jennifer Ahlin, Virginia Department of Transportation
Janine Ashe, FHWA District of Columbia Division
David Cohen, FHWA Office of Project Development & Env. Review
John Duel, FHWA Office of Planning, Environment, and Realty
Kathleen Hulbert, FHWA Infrastructure Office
Chip Millard, FHWA Freight Management & Operation
Diane Mobley, FHWA Chief Counsel Office
Kevin Moody, FHWA Resource Center
Ben Orsbon, South Dakota Department of Transportation
Jill Stark, FHWA Office of Planning, Environment, and Realty
Lindsey Svendsen, FHWA Office of Planning, Environment, and Realty
Jim Thorne, FHWA Office of Planning, Environment, and Realty
Bingxin Yu, FHWA Transportation Policy Studies
VCIT Focus Areas
Communication - Developing the tools to help FHWA staff and others promote Value Capture to local public agencies (Value Capture Implementation Manual)
Technical assistance - Providing technical assistance to local public agencies interested in pursuing Value Capture (Peer Program)
Clearing House (website) - Identification of best practices and lessons learned and promoting further discussion on innovative funding options for local public agencies, lessons learned from past and current efforts, etc.
July 24, 2019
Noelle Dominguez, Coordination Section Chief Fairfax County Department of Transportation
Route 28 Tax District
Virginia Route 28 runs through several jurisdictions in Northern Virginia and is a major thoroughfare connecting Virginia residents and employees to various activity centers in the region, as well as to Dulles International Airport, located the Fairfax County and Loudoun County boundary.
Business owners along Route 28 in Fairfax and Loudoun Counties recognized a need for improved transportation infrastructure along the Route 28 segment that traverses their jurisdictions to support planned and projected growth.
Virginia Code allows for the creation of independent taxing districts to support the financing of transportation infrastructure improvements.
Such a district may be formed only upon the joint petition of owners of at least 51 percent of the land area in each county located within the boundaries of the adopted district, and which has been zoned or is used for commercial or industrial purposes.
Route 28 Tax District - Creation
December 21, 1987 - Boards of Supervisors from Fairfax and Loudoun Counties created the Route 28 Highway Transportation Improvement District (Route 28 Tax District) to fund improvements to Route 28, including widening and construction of ten grade-separated interchanges.
The segment incorporated by the Tax District connects State Route 7 in eastern Loudoun County to south of U.S. Route 50 in western Fairfax County.
The roadway continues through Fairfax County and further south, though that segment is not included in the Tax District.
Route 28 Tax District - Governance
Route 28 District Commission is comprised of 9 members - four members from each of the Loudoun and Fairfax Boards and the Commonwealth of Virginia's Secretary of Transportation (or his designee).
Route 28 District Landowners Advisory Board is comprised of twelve landowner representatives.
Six of the Advisory Board members (three from each County) are elected by the taxpaying landowners to serve four-year terms.
Six members (three from each County) are appointed by the Boards of Supervisors to fill a four-year term.
The Advisory Board and the Commission generally meet annually, though additional meetings can be called if necessary.
Completed Tax District Projects
Numerous project have been completed within the Tax District, including:
Route 28 at Air & Space Museum Parkway - December 2003
Route 28 at Westfields Blvd - March 2006
Route 28 at McLearen Road - June 2006
Route 28 at Sterling Blvd - November 2006
Route 28 at Innovation Avenue: Right in and Right out Ramps - October 2007
Route 28 at Nokes Blvd - May 2009
Route 28 at Frying Pan Road - July 2009
Route 28 NB Bridge over the Dulles Toll Road (DTR) - August 2015
Route 28 SB Bridge over DTR - August 2015
Route 28 SB Widening, Sterling Blvd to DTR - August 2017
Route 28 SB Widening, DTR to Route 50 - August 2017
Route 28 NB Widening, McLearen Road to DTR - August 2017
Route 28 Tax District - Revenue History
Route 28 Tax District - Implementation
The Route 28 Tax District is required by legislation to contribute 75 percent of the funding for all projects in the district, state funds cover the remaining 25 percent
Route 28 Tax District has worked with Fairfax and Loudoun Counties to issue bonds to support identified projects as prescribed
Route 28 Tax District revenues and State funds have been collected and used to cover debt service payments.
Route 28 Tax District - Other Partners
In 2013, the Virginia General Assembly passed a transportation funding package (HR 2313), which began the collection of regional revenues to address local and regional transportation needs in Northern Virginia. The Northern Virginia Transportation Authority (NVTA) allocates 70% of these funds to regionally significant transportation projects – of which Route 28 qualifies.
30% are provided to individual localities where they are collected to be allocated by local governing bodies on eligible transportation projects.
Fairfax County and Loudoun County have applied and received funding for several projects that would otherwise be funded by the Tax District.
The funding provided by NVTA, along with the fact that Route 28 Tax District tax revenues have also increased, has allowed for the completion of the final identified projects.
Advantages/Lessons Learned
Utilization of a taxing district can be advantageous for large-scale, high-cost projects
Taxing districts can be vulnerable to larger economic trends
The Route 28 Tax District accelerated the pace of improvements
Use of a Landowners Advisory Committee helps guarantee stakeholder buy-in over the life of the project
Annual meetings to update and seek input from Advisory Committee members are extremely important
Annual Commission meetings to update, allow for debate, vote, and make executive decisions regarding the policies and operations of the tax district are critical
Professional staff to both manage the issuance of bonds and other financial strategies and to plan and construct projects, are vital to success.
Presentation 3
DC Business Improvement Districts
What is a Business Improvement District?
A BID is organized and established by property and business owners to enhance the economic vitality of commercial areas and to provide amenities and services that make the neighborhood a more attractive place to work, to visit, to live and to invest in.
Property owners within a defined geography pay a special assessment, collected by the city but administered by the BID, to provide services and programs that go above and beyond what the city provides.
BIDs have proven to be a successful tool in fostering more vibrant, well-managed, healthier business districts and high-quality neighborhoods.
What Makes a Business Improvement District?
Provides Services within a Defined Geography
Property Owner Initiated and Centered
Governed by a Board of Directors
Private Non Profit Organization
A Taxing District
Limited government oversight*
*depends on jurisdiction
Advantages of the BID Funding Mechanism
Avoids the Free Rider Problem
Avoids the Political Uncertainties of Municipal Budgeting
Advantages of the BID Governance Model
Board Members with skin in the game
Creates framework for community, business and government collaboration
Advantages of BID Leadership Models
Can Pilot Ideas that may then be scaled to meet broader municipal needs
Can build bridges between private and public sector
Map of DC BIDs
In 2018, DC BIDs collectively invested over $34 Million to enhance and maintain 11 DC communities and commercial Districts.
What BIDs Do
Place Management
Placemaking
Place Branding
Economic Development Research and Planning
Place Management: Cleaner and well-managed public spaces
Litter Removal and Sidewalk and Gutter sweeping
Treebox Maintenance
Graffiti Removal
Defect reporting and tracking
Coordinating with City agencies to receive higher level of municipal services
Every day DC BID workers clean and maintain:
39 Acres of park
138 Miles of sidewalk
PlaceMaking: Creating a more dynamic and vibrant public realm
BIDs organize special events, coordinate public art projects, work on transportation planning initiatives, all to enhance their districts and provide the type of amenities that make them more attractive to tenants.
Every day DC BID workers clean and maintain:
Planting and landscaping services
Installing public Art
Installing bike racks
Coordinating with the city to improve public spaces
Activating public spaces with events and activities
Street pole decorations and street banners
Place Branding: Defining and promoting what makes an area special to attract more visitors, business and investment
Development of a cohesive marketing strategy that builds upon the area's unique identify and attracts visitors and foot traffic
An events strategy that draws visitors, builds community and supports business success
Retail retention and attraction strategy
Economic Development and Planning
Educating and engaging BID stakeholders around economic development and planning issues
BIDs have a ground-level view of the economic dynamics and development activities within their geographies.
BIDs gather economic intelligence and produce analysis that informs economic development and planning efforts.
What is the BID Value Proposition
Businesses
Benefit from collective marketing of the area
A cleaner and more well managed public environment
Amenities created by public programming and street activations
Assistance resolving public space and other place based issues
Local Government
Can partner with BIDs to pilot innovations
Can get valuable insights about hyper local ecosystems to inform policy decisions
Can benefit from growing tax base that BIDs contribute to growing
Residents
A cleaner more well managed public realm
Public parks and spaces activated
Programming focused on community building strengthens social ties.
Joint marketing efforts that draw visitors, investment and new residents
Property Owners
Can target collective resources to improve the public environment.
BIDs can act as "honest brokers" marketing the area to fill vacancies
Grow property values and lease rates.
How do you measure it?
Whether property owners who pay assessment agree to form or renew
Testimonials
Comparative analysis of districts with and without BIDs (property values, lease rates, etc)
The Net Fiscal Impact of the Future Cities Area on Arlington County's General Fund
Jeannette Chapman
Deputy Director and Senior Research Associate
Stephen S. Fuller Institute
Schar School of Policy and Government
George Mason University
September, 2018
2007
first study of its kind to estimate the impact of forming a BID on sales prices within a BID's boundaries.
Researchers found that BIDs have a significant positive impact on commercial property values.
On average, the value of commercial property within a BID increases by approximately 15 percentage points more than comparable properties in the same neighborhood but outside the BID.
2009
Found that commercial corridors under BID management showed stronger growth in real estate values
Compared to those lacking a BID or similar management entity.
BIDs were shown as one of the most effective interventions in terms of boosting property values and retail sales growth.
Study found that residences located in a business improvement district have a 30 percent price premium compared to other areas.
Fiscal Impact Study Example
Study Area
FY 2018 Net Fiscal Impact in Millions
Crystal City
Rest of Future Cities
Future Cities, Total
Revenues
$ 94.90
$ 105.34
$ 200.24
Expenditures*
$ 65.65
$ 77.18
$ 142.83
Net Fiscal Impact
$ 29.25
$ 28.16
$ 57.41
% of General Fund Revenues Generated in the Area
8.4%
9.3%
17.8%
*Includes transfers to APS
Future Cities as a Share of Key Activities in Arlington County
Crystal City
Rest of Future Cities
Future Cities, Total
Residents
2.3%
5.1%
7.5%
Households
3.0%
7.0%
10.0%
Jobs
12.2%
8.7%
20.9%
Real Estate Taxes
8.2%
7.1%
15.3%
General Fund Revenue
8.4%
9.3%
17.8%
Sources: U.S. Census Bureau (v2017 Population Estimates, 2012-2016 ACS; LEHD); Arlington County Assessments; The Stephen S. Fuller Institute at the Schar School, GMU
Key Takeaways
The Future Cities area is a net generator of tax revenues for Arlington County.
This is primarily because of the density of commercial activity, which typically have larger real estate tax revenue benefits relative to services that they consume.
The total net fiscal impact of $57.41M was nearly the total expenditures on the
Fire Department ($59.79M), or
the Sheriff, Economic Development, and County Manager Departments, combined ($57.45M).
Handout
Value Capture: Capitalizing on the Value Created by Transportation
Value capture presents an opportunity to meet funding challenges for transportation projects at a local and State level.
Value capture refers to a set of techniques that take advantage of increases in property values, economic activity, and growth linked to infrastructure investments to help fund current or future improvements.
Benefits
Accelerates project delivery. -
Value capture techniques can bring revenue to a project prior to or during the project implementation.
Generates sustainable long-term revenue. Value capture techniques can provide a sustained revenue source to support operations and maintenance or finance transportation improvements.
Provides supplemental funding for transportation needs. Value capture techniques can bring more revenue sources to a project by sharing the financial burden with developers and owners who benefit from the transportation investment.
Supports economic development & redevelopment. Value capture techniques can provide a creative solution to funding infrastructure in "real-time," therefore meeting the needs of developers and stimulating economic growth.
Techniques
The following techniques demonstrate powerful tools that can address funding gaps.
Developer Contributions include Impact Fees and Negotiated Exactions. They are one-time charges collected by local governments from developers to offset the cost of infrastructure and services necessitated by new development.
Special Assessments include Special Assessment Districts, Business Improvement Districts, Sales Tax Districts, and Land Value Taxes. These are additional fees or taxes assessed on businesses or residents in specified geographic areas benefiting proximity to a highway or other transportation facility or corridor.
Fees include Transportation Utility Fees which are similar to a utility fee and are assessed based on how individual businesses and households use transportation facilities.
Incremental Growth includes Tax Incremental Finance, Transportation Reinvestment Zones, and Tax Allocation Districts. These mechanisms allocate back to infrastructure from some specified portion of increased property tax revenues fostered by new infrastructure - often for a specified period of time.
Joint Development includes At Grade, Below Grade, and Above Grade (or Air Rights). This is the sale or lease of land or air rights on or adjacent to transportation facilities. This can include donations of land or other in-kind resources from the private sector in ongoing commercial operations.
Concessions include Asset Recycling. This is the sale or lease of government-owned assets - such as toll roads or bridges - to private-sector investors/ operators.
Advertising and Naming Rights are the sale of advertising space or naming rights on a transportation facility. Note: Commercial uses within Interstate Highway System right of way, including rest areas, is prohibited by law; however, they may be allowed on toll facilities and in transit stations.
Value capture returns a portion of land value created by transportation to be used for future investments.
State Of The Practice
States such as California, Colorado, Florida, Georgia, Massachusetts, Missouri, Ohio, Oregon, Pennsylvania, Texas, and Virginia, as well as the District of Columbia, are using value capture options successfully. The following are examples of different value capture applications supporting highway improvements across the United States:
Several small towns in Oregon have instituted transportation utility fees through monthly utility bills that fund programs paying for local road maintenance and safety projects.
The Cap at Union Station project over I-670 in Columbus, OH, is an example of joint development and right-of-way use agreements to improve traffic operations and transform the void caused by I-670 into an urban streetscape with retail shops and restaurants.
California's Orange County Transportation Corridor Agencies (TCA) are using development impact fees to generate funds that have provided seed capital for transportation facilities and continue to be an integral feature of TCA's debt management strategy.
In Texas, the Fort Worth City Council established transportation impact fees in July 2008 on new development projects to help fund transportation improvements. In April 2013, the council approved a transportation impact fee increase from $2,000 to $3,000 on new, singlefamily homes.
In Illinois, the city of Chicago used tax increment financing districts to fund a variety of projects, including street improvements, transit stations, and neighborhood redevelopment.
In Missouri, residents of four counties approved the creation of a transportation development district that levied a dedicated sales tax mileage in their district to generate half the funding for expansion of a 52-mile upgrade to U.S. Highway 36, widening it from two to four lanes.
Salina, KS, with a population of less than 50,000, is combining the value capture strategy of a tax incremental finance property tax with a community improvement sales tax and private funding for its $154 million downtown redevelopment project.
A new or improved highway that connects to economic activity will benefit adjacent parcels. Similar parcels without those connections do not increase in value.