


List of Figures
The following graphics were created by Joe Minicozzi of Urban3. They compare the growth in population, infrastructure and average income for Lafayette Louisiana from 1949 until 2015.
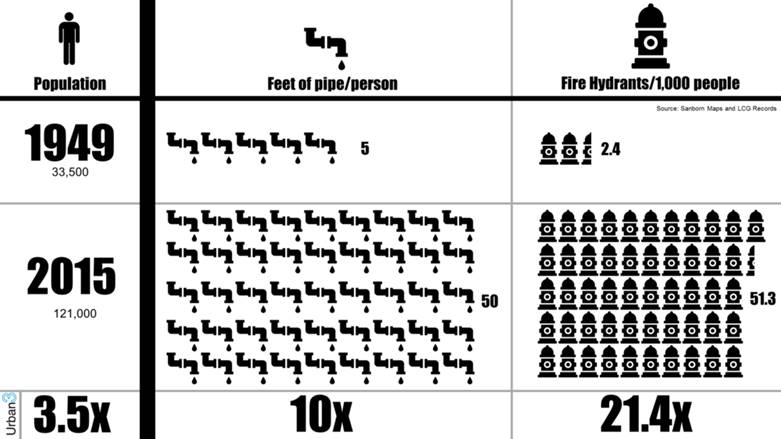
Source: © 2021 Joseph Minicozzi, Urban3. Used by permission.
In Figure 5, median household income is expressed in constant (inflation-adjusted) dollars.
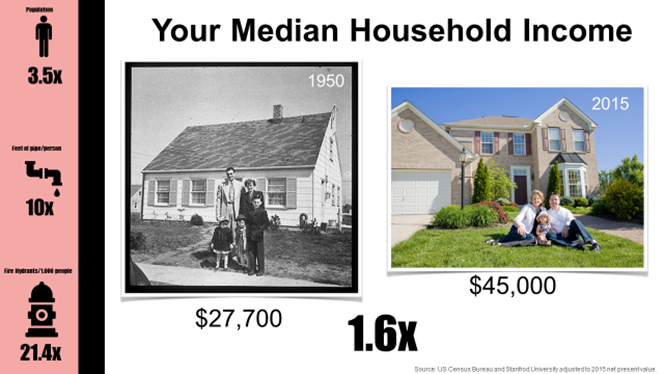
Source: © 2021 Joseph Minicozzi, Urban3. Used by permission.
Here is a graphic from Halifax Canada, showing the different costs per household for various public facilities and services depending on whether the household was located in the urban core or in the suburbs. On average, the suburban costs per household are 2.5 times more than the urban cost per household.
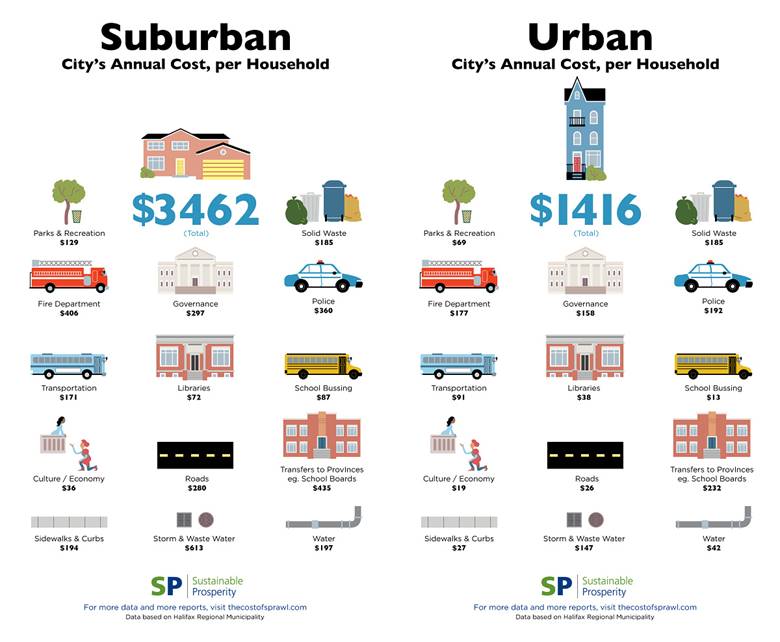
Source: Sustainable Prosperity Image via streetsblog.org. https://usa.streetsblog.org/2015/03/05/sprawl-costs-the-public-more-than-twice-as-much-as-compact-development/
The difference in cost is primarily related to differences in density. In other words, for each suburban household, there are more lane miles of road, more feet of water and sewer pipe, more libraries and fire stations than for each urban household.
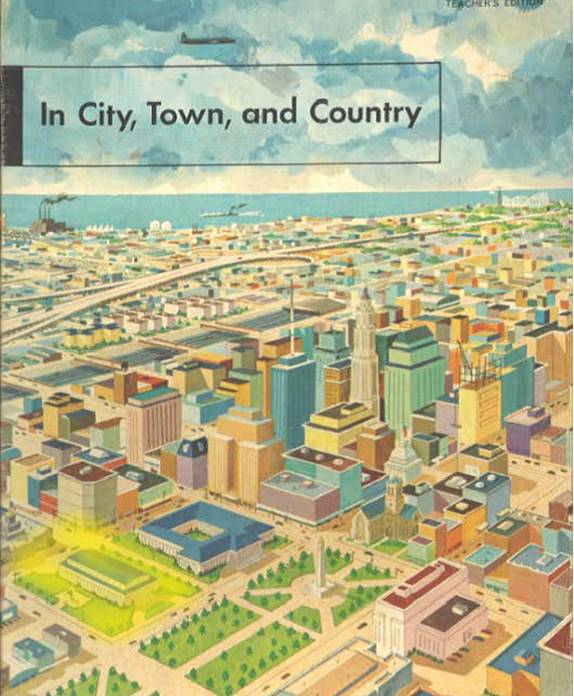
The following illustrations are from the 1959 In City, Town, and Country by Paul R. Hanna (Scott, Foresman & Co.). Figure 7 shows the front cover.
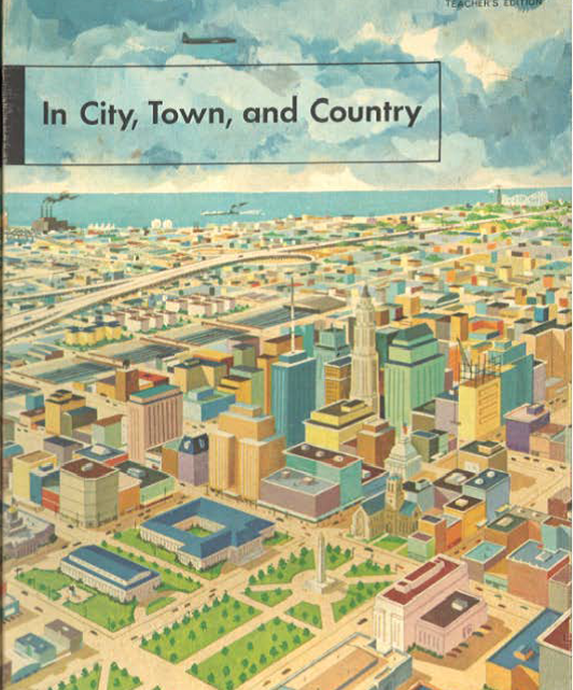
Source: From "In City, Town and Country" © 1959 SAVVAS LEARNING COMPANY LLC. Used by permission. All Rights Reserved. https://www.savvas.com/
In the next image, a property in the lower left corner has been highlighted.
Source: From "In City, Town and Country" © 1959 SAVVAS LEARNING COMPANY LLC. Used by permission. All Rights Reserved. https://www.savvas.com/
The highlighted property occupies an entire city block. It appears to be an institutional use with substantial open space all around. On one side, across the street, there is a memorial park complex. Assume that this property is privately owned, and the owners decide to raze the building and construct a new set of office and retail buildings to replicate the development immediately above it in the illustration. In other words, several buildings of greater height and density, no setbacks and no open space. Such new development will intensify the use of this site. Users will consume additional public resources related to transportation, water, sewer, police and fire protection. But the water pipes are already there. The streets are already there. The police and fire department are already nearby. Transit buses are probably already operating nearby if not on one of the adjacent streets. The new development will pay more taxes, and that should cover the additional operating expenditures associated with the new development.
The next image, from the back cover, shows the urban fringe. Residential and modest commercial or industrial properties give way to farms and other rural land uses.
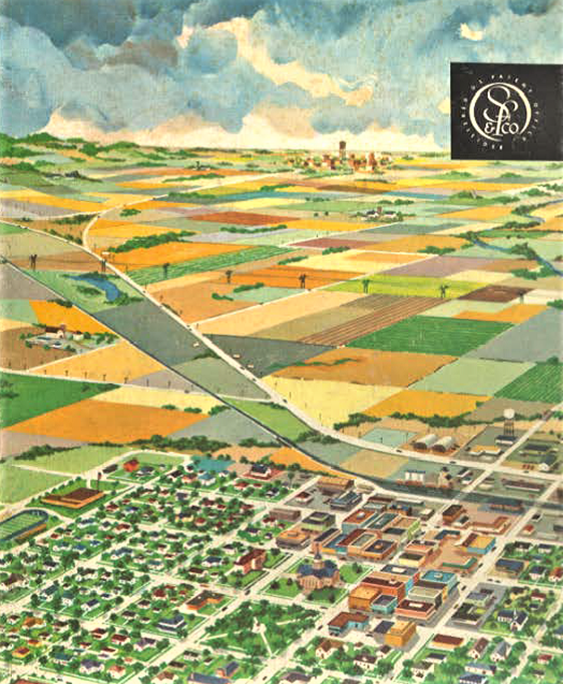
Source: From "In City, Town and Country" © 1959 SAVVAS LEARNING COMPANY LLC. Used by permission. All Rights Reserved. https://www.savvas.com/
In the next image, part of a farm field in the center right is highlighted.

Source: From "In City, Town and Country" © 1959 SAVVAS LEARNING COMPANY LLC. Used by permission. All Rights Reserved. https://www.savvas.com/
Assuming this field is about the same size as the city block in the prior discussion, if the owner wants to put up a complex of office and retail uses identical to those that were proposed for the downtown city block, it will consume the same amounts of police, fire, water, sewer and transportation resources as the urban development. But the water pipes are not there. The roads are not there. The transit isn't there. And, if police and fire services were to respond in a timely fashion, they might require a new station nearby. Although the buildings will be identical (and have the same value and pay the same taxes as their urban counterparts), the value of the farmland is much lower than its urban counterpart. This lower value reflects, to a large degree, the lack of urban infrastructure at the site. Thus, this new exurban development will require not only an incremental addition of city services, but entirely new facilities. And, while the cost of public facilities and services will be more costly to provide here, this site will contribute less in taxes due to lower land values.
In the next image, the county creates a TIF to pay for a road connecting the proposed development and the existing county road and for a signalized intersection where they meet. The dotted line represents the rough location of the connecting road.
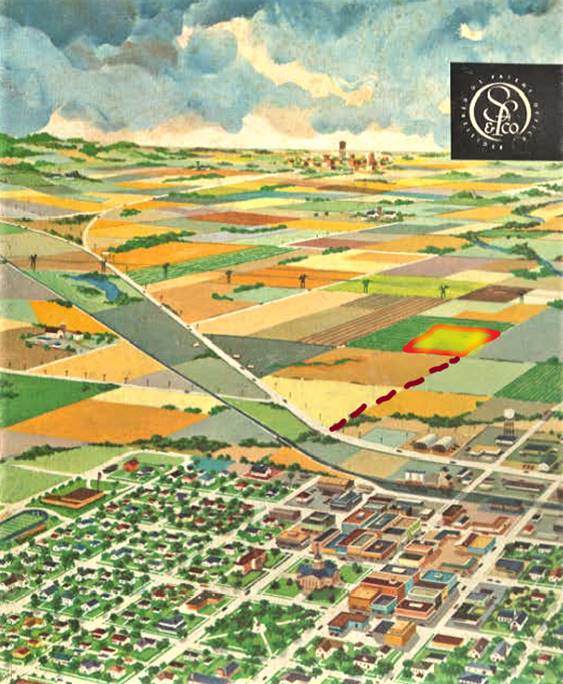
Source: From "In City, Town and Country" © 1959 SAVVAS LEARNING COMPANY LLC. Used by permission. All Rights Reserved. https://www.savvas.com/
Assuming that the tax increment will be defined in terms of the difference between property tax and sales tax revenues collected from this field before the project and the revenues obtained after the project has been initiated and that the tax increment will be sufficient to pay for the road extension and intersection signalization, where is the revenue to pay for all the other public facilities and services that will be required?
The demand for developed space is finite in an economic region at a given point in time. If the demand for developed space in this metropolitan area is limited and if the greenfield exurban TIF development occurs first, it might not be economically feasible to proceed with the downtown redevelopment project. In other words, the TIF subsidy may have simply shifted development from downtown to the urban fringe. In this example, although the new exurban development will create a tax increment for the county, it does so at the expense of an unrealized tax increment for the downtown.