« PreviousNext »
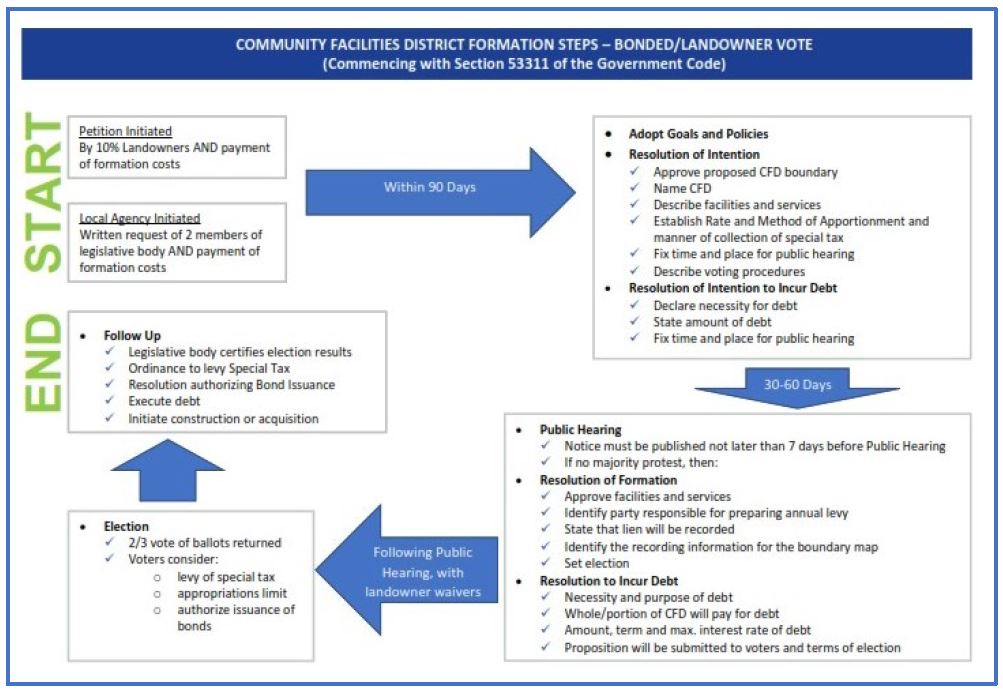
5. Quantitative Assessment
Quantitative Assessments-Basic Components
VC Opportunity Areas and Buildout Scenarios
VC Opportunity Areas (OAs)
Identify where substantive new developments could occur:
- OA "Nodes": (1) Major highway intersections; (2) Transit stations with high growth potential
- Local GPs and SPs can help determine the extent of OA coverage
Buildout Scenarios for OAs
Incremental development potential based on up-zoning:
- Maximum allowable density by land use
- Long-term growth plans per local GPs and SPs
- TOD guidelines (e.g., recommended urban/suburban density within 1/4 & 1/2-mi radius of BRT & rail transit stations)
Maximum VC Revenue Potential
TIF
Estimate incremental tax revenues based on:
- Base year/baseline assessed value (AV)
- Buildout absorption schedule
- Future property value, AV escalation
- City/County participation levels
SAD
Estimate new special assessment revenues based on:
- Max. potential effective tax rate above existing rate
- Same as TIF assumptions on absorption, future value, AV escalation
DIF
In the absence of full nexus study, estimate revenues based on:
- Current DIF levels in adjacent areas (i.e., market-accepted rates)
- Different fee schemes: (1) urban/in-fill (marginal cost basis), (2) suburban (total cost basis)
VC Opportunity Areas and Buildout Scenarios
Cash Flow by VC Technique
For each VC technique, establish:
- Lifecycle timeframe (e.g., TI or SA district term)
- Bonding capacity based on timing of bond issuance(s) and debt financing terms
- Base year for PV analysis
TI–Tax Increment, SA–Special Assessment
Integrated Lifecycle Cash Flow
Estimate cumulative lifecycle cash flows:
- Single node: total combined cash flow for all VC techniques at an intersection or station
- Multiple nodes (corridor level): total combined cash flow for all VC techniques for multiple intersections/station
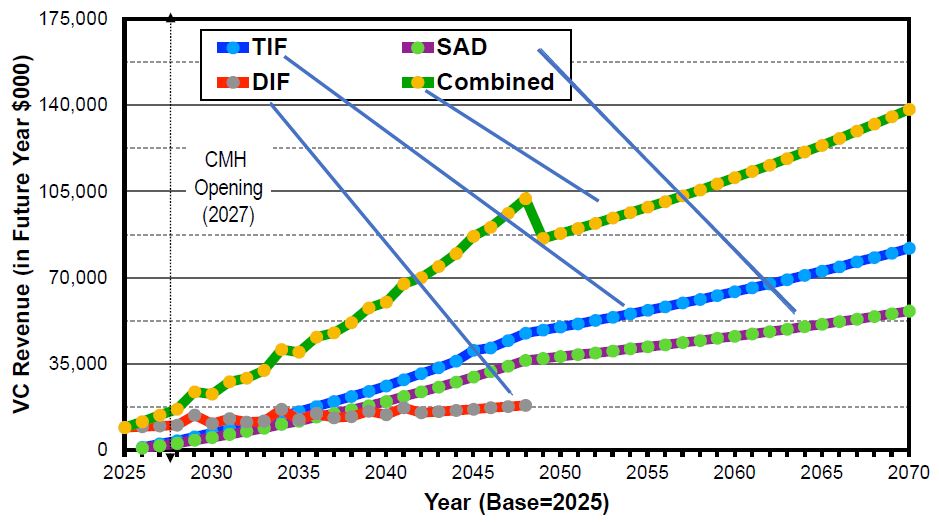
Integrated Lifecycle VC Cash Flow–Single Node San Diego Central Mobility Hub (CMH) Example
Annual Cash Flow: High Scenario
| VC Type |
Present Value (2025$) |
| 45-Year Lifecycle Cash Flow |
Potential Bond Proceeds |
| TIF |
$463.2 M |
$188.2 M |
| SAD |
$306.1 M |
$189.9 M |
| DIF |
$189.5 M |
n.a. |
| Total |
$958.8 M |
$378.1 M |
Notional Only
Source: SANDAG Central Mobility Hub Alternative Funding Strategy (2021)
Integrated Lifecycle VC Cash Flow–System Level LA Metro New Rail Transit Corridor Example
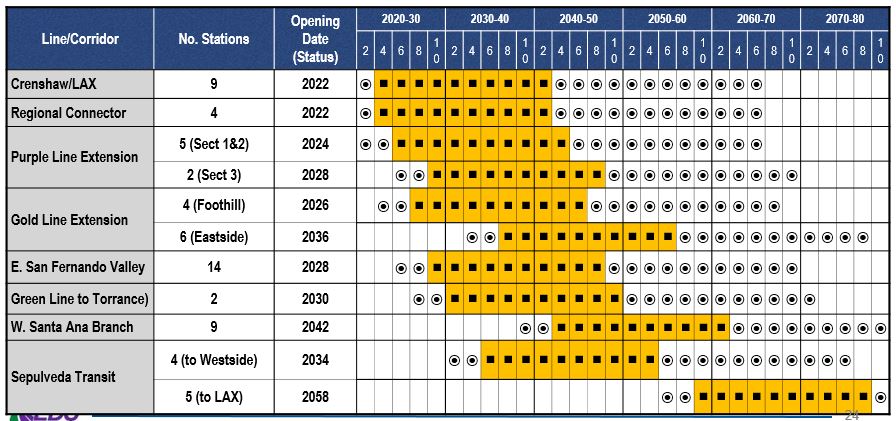
Source: LA Metro Value Capture Assessment Study (2020)
Notional Only
« PreviousNext »


