


TABLE OF CONTENTS
LIST OF FIGURES
LIST OF TABLES
East Palo Alto is a city in San Mateo County, California. Despite it being adjacent to Palo Alto, home to both Silicon Valley and Stanford University, East Palo Alto has historically experienced significant socioeconomic challenges, including low levels of education, high levels of poverty and unemployment, and an undersupply of affordable housing for low-income residents. Because of insufficient affordable transit options, area residents who are employed outside their community commute largely by automobile (Nelson\Nygaard 2018).
During the postwar period, much of East Palo Alto developed at population densities lower than what current regulations would otherwise permit. Today, local, county, and State regulations encourage infill development in urbanized areas of San Mateo County to limit sprawl and mitigate traffic congestion, typically at densities significantly higher than existing development. In East Palo Alto, therefore, infill development represents the primary avenue for growth to fulfill these goals.
The most significant infill development planned in East Palo Alto is the Ravenswood Redevelopment Project Area, a 350-acre site in northeast East Palo Alto. Despite being among the last developed areas in the city, the area has seen its population grow at rates much higher than those of the city as a whole.
In September 2012, East Palo Alto’s city council adopted the Ravenswood SP (RSP), which proposed a framework for transforming the site into a new downtown.
The RSP projected significant growth within the Ravenswood Business District (RBD) in housing, employment, and nonresidential space. This projected new growth would require significant investment in new or upgraded infrastructure, including storm drainage, roads, parks, libraries, and community centers. Many of these improvements will benefit the entire city as well as the RBD, and DIF would help fund this development-necessitated infrastructure.
At the time of RSP adoption, East Palo Alto did not have a standard, legislated impact fee structure. Instead, the city negotiated the impact fees on a case-by-case basis, an approach it considered to be more vulnerable to legal challenge and more staff-intensive to administer. Under this approach, the burden of proof of nexus was the responsibility of the city. Given the legal risks and bureaucratic challenges regarding the case-by-case approach, the city decided to develop and codify a uniform and legally defensible DIF program to better support the projected developments.
Between 2013 and 2018, the city commissioned several nexus studies of impact fees with respect to a variety of city services, including parks and trails, community facilities, water infrastructure, storm drainage, streetscape, and a transportation impact fee. These studies culminated in the adoption of a citywide DIF program, which went into effect in July 2019. Table 4 summarizes the overall structure of the DIF program currently in place in East Palo Alto for different facility types (AECOM 2019a). In addition to DIF, other development charges are also shown in (see in chapter 2 for these non-DIF charges). As presented earlier, the unit basis for fees is shown to differ for different facility types. The city also chose to establish geographic-specific fee schedules for areas within the RBD and those outside the RBD, in particular for stormwater and housing in-lieu fees.
| Fee type/facility category | Single family |
Multifamily |
Office/ |
Retail |
Industrial |
|---|---|---|---|---|---|
Per DU |
Per 1,000 ft2 |
||||
Development impact fee (DIF) schedules |
|||||
Parks and trails |
|||||
Citywide fees |
$4,133 |
$2,847 |
$1.15 |
$0.77 |
$0.46 |
Public facilities |
|||||
Citywide fees |
$7,248 |
$4,993 |
$2.01 |
$1.34 |
$0.81 |
Transportation |
|||||
Citywide fees |
$2,358 |
$1,775 |
$7.33 |
$7.33 |
$4.77 |
Storm drainage |
Per DU |
Per impervious acre |
|||
Fees outside RBD |
$2,800 |
$70,000 |
|||
Fees within RBD |
$4,840 |
$121,000 |
|||
Other development charges (not DIF) |
|||||
Affordable housing commercial linkage fees |
|||||
Citywide fees |
$0.00 |
$0.00 |
$10.72 |
$0.00 |
$0.00 |
Housing impact in-lieu fees |
Per sq. ft. |
||||
Citywide fees: Single-family infill |
$36.22 |
NA |
NA |
NA |
NA |
Citywide fees: Town houses |
$34.78 |
NA |
NA |
NA |
NA |
Citywide fees: Rental units |
NA |
$25.35 |
NA |
NA |
NA |
Fees outside RBD: Condos |
NA |
$50.58 |
NA |
NA |
NA |
Fees within RBD: Condos |
NA |
$67.62 |
NA |
NA |
NA |
Quimby Act in-lieu fees (parks) |
|||||
Citywide fees |
Varies1 |
NA |
NA |
NA |
|
Storm drainage fees |
|||||
Citywide fees |
Varies2 |
||||
Water capacity fees3 |
|||||
Citywide fees |
$8,147 |
$5,014 |
$3.45 |
$5.01 |
$3.45 |
Source: City of East Palo Alto (AECOM 2019a).
1 Quimby fees can include park land dedication acreage or park in-lieu fees, which do not pertain to rental apartments where no subdivision of land or air space is involved. Fees apply only to single-family/town house subdivisions and multifamily condo projects.
2 East Palo Alto currently levies storm drainage fees on all qualifying developments within the city. These existing storm drainage fees are different from the DIF presented above, which would replace and supersede the existing storm drainage fees.
3 Water capacity fees for nonresidential development are estimated based on unique water demand by project and on meter size.
Concurrent with the nexus study, the city also commissioned a financial feasibility study, which concluded that maximum legally defensible fee levels for all facility categories determined from the nexus study would not negatively impact development feasibility (AECOM 2019b).79
The City of East Palo Alto had considered implementing a transportation impact fee, along with other city services, for several years and commissioned a transportation-specific nexus study in 2013. The 2013 study recommended implementing only the RBD-specific transportation impact fees, with no fees outside the RBD. The city postponed the implementation of this RBD fee proposal and commissioned another nexus study in 2018, which provided the basis for the citywide fee that went into effect in July 2019. Figure 5 summarizes the basic steps involved in the 2018 transportation impact fee nexus study.
Figure 5. Chart. Basic Steps in Transportation Fee Nexus Study—East Palo Alto.
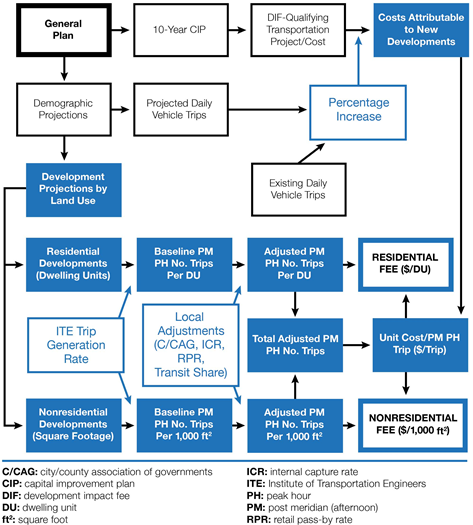
The bases for the 2018 transportation impact fee nexus study (Nelson\Nygaard 2018) were the demographic and land use projections and the 10-year CIP provided in the East Palo Alto GP update (GPU, 2015) and the RSP (2013). Table 5 summarizes the incremental growth in demographics and new developments by land use, estimated over the 25-year planning horizon for both the city as a whole and the RBD, specifically.
| Projection category | Parameter |
Unit |
Citywide |
RBD |
|
|---|---|---|---|---|---|
Demographics |
Population |
No. people |
9,626 |
3,278 |
|
Employment |
No. people |
6,009 |
3,545 |
||
Service population1 |
No. people |
12,631 |
5,051 |
||
New developments by land use |
Residential |
Town houses |
DU |
1,486 |
493 |
Multifamily housing |
DU |
1,033 |
342 |
||
Nonresidential |
Office/R&D |
Sq. Ft. |
1,940,000 |
1,236,000 |
|
Retail |
Sq. Ft. |
333,000 |
112,000 |
||
Industrial |
Sq. Ft. |
268,000 |
268,000 |
||
Source: City of East Palo Alto (AECOM 2019a).
1 Service population = Population + 0.5 (Employment).
Based on the 10-year CIP, table 6 summarizes the overall capital project needs to accommodate the growth projections, by public facility category, that qualify for impact fees. Table 6 also breaks out those capital project costs attributable only to new developments to be considered in the impact fee assessment. For transportation, the percentage for new developments was based on the number of new vehicle trips generated. The facility costs for new developments, shown in table 6, also include an additional 4 percent to account for administering the impact fees once they are in place.
| Public facility category | DIF-qualifying total facility cost |
% attributable to new growth |
Facility cost attributable to new growth1 |
|
|---|---|---|---|---|
Parks and trails |
$37,190,000 |
30% |
$11,601,000 |
|
Public buildings |
$65,218,000 |
30% |
$20,344,000 |
|
Storm drainage |
Outside |
$35,619,000 |
12% |
$4,283,000 |
Within RSP |
$18,511,000 |
39% |
$5,657,000 |
|
Transportation |
$98,641,000 |
25% |
$25,282,063 |
|
Source: City of East Palo Alto.
1 Includes 4 percent administrative fee.
The CIP contained 23 projects qualifying for transportation impact fees, which amounted to almost $100 million in total costs. As summarized in Table 7, these projects were mostly improvements involving roads/interchanges and bicycle/pedestrian/sidewalk improvements, with separate estimates for the RBD area.
| Project category | % total |
Project cost (in $1,000) |
|---|---|---|
Road/interchange improvements |
56% |
$55,070 |
Bicycle/pedestrian/ |
19% |
$19,038 |
Streetlights/safety |
1% |
$1,111 |
Plans/studies/assessments |
1% |
$798 |
Other |
7% |
$6,562 |
Ravenswood specific plan projects |
16% |
$16,062 |
Total |
100% |
$98,641 |
Source: City of East Palo Alto.
The demand basis for the transportation impact fee schedule used in the 2018 nexus study was the number of PM PH trips generated. For the baseline, trip generation rates by land use were taken from ITE’s Trip Generation Manual (9th edition). To align with East Palo Alto’s unique land use and transportation conditions, the nexus study then adjusted the ITE baseline trips as follows (see Table 8):
| Land use | ITE code |
2040 forecast |
Trips/unit (ITE) |
Total no. trips (ITE) |
CCAG adj. factor |
RSP ICR |
RSP RPR |
Transit mode share |
Adjusted trips/unit |
Adjusted no. trips1 |
|---|---|---|---|---|---|---|---|---|---|---|
Residential |
DUs |
Per DU |
|
|
|
|
|
Per DU |
|
|
Town houses |
230 |
1,486 |
0.52 |
773 |
76% |
8% |
NA |
6% |
0.34 |
508 |
Multifamily |
220 |
1,033 |
0.39 |
403 |
76% |
8% |
NA |
6% |
0.26 |
266 |
Nonresidential |
Sq. Ft. |
Per |
|
|
|
|
|
Per |
|
|
Office/R&D |
710 |
1,939,853 |
1.49 |
2,890 |
76% |
0.5% |
NA |
6% |
1.06 |
2,063 |
Retail |
820 |
333,406 |
3.73 |
1,244 |
76% |
11% |
19% |
6% |
1.93 |
643 |
Industrial |
110 |
267,987 |
0.97 |
260 |
76% |
0.5% |
NA |
6% |
0.69 |
185 |
Total |
|
|
5,570 |
|
|
|
|
|
3,665 |
Source: City of East Palo Alto. RSP ICR—Ravenswood Specific Plan internal capture rate; RSP RPR—Ravenswood Specific Plan retail pass-by rate.
1 Due to rounding at each adjustment, final numbers may not add up to the total exactly.
Table 9 shows the transportation impact fee calculations based on the adjusted trip generation. These calculations reflect the maximum legally supportable impact fees for transportation that can apply citywide.80
| Description | Value |
Source/comments |
|
|---|---|---|---|
Transportation impacts (2015–2040) |
|||
A |
Total daily vehicle trips (2040) |
124,453 |
General plan update (2015) |
B |
Existing daily vehicle trips (2015) |
93,782 |
|
C |
Total new daily vehicle trips (2015–2040) |
30,671 |
A–B |
D |
% Growth in daily vehicle trips (2015–2040) |
25% |
C/A |
E |
New post meridian (PM) peak hour (PH) vehicle trips generated (2015–2040) |
3,665 |
Table 8 |
F |
Percentage of new trips citywide |
100% |
|
New development forecast (2040) |
|||
G |
Town houses (DU) |
1,486 |
Table 8 (Table 5) |
H |
Multifamily (DU) |
1,033 |
|
I |
Office/R&D (Sq. Ft.) |
1,939,853 |
|
J |
Retail (Sq. Ft.) |
333,406 |
|
K |
Industrial (Sq. Ft.) |
267,987 |
|
Project costs |
|||
L |
Total transportation project costs from CIP |
$98,641,000 |
Table 7 |
M |
Cost attributable to new trips (including 4% administrative fee) |
$25,282,063 |
L*D*1.04 (Table 6) |
N |
Cost attributable to new trips outside RBD, with 4% administrative fee |
$25,282,063 |
F*M |
O |
Unit cost per PM PH vehicle trip |
$6,898 |
N/E |
Residential unit conversion |
|||
P |
Town houses (PM PH trips/DU) |
0.34 |
Table 8 |
Q |
Multifamily (PM PH trips/DU) |
0.26 |
|
Commercial unit conversion |
|||
R |
Office/R&D (PM PH trips/1,000 ft2) |
1.06 |
Table 8 |
S |
Retail (PM PH trips/1,000 ft2) |
1.93 |
|
T |
Industrial (PM PH trips/1,000 ft2) |
0.69 |
|
Residential nexus fee maximum |
|||
Single-family ($/DU) |
$2,358 |
O*P |
|
Multifamily ($/DU) |
$1,775 |
O*Q |
|
Nonresidential nexus fee maximum |
|||
Office/R&D ($/1,000 ft2) |
$7.33 |
O*R |
|
Retail ($/1,000 ft2) |
$13.30 |
O*S |
|
Industrial ($/1,000 ft2) |
$4.77 |
O*T |
|
Source: AECOM (2019a); Nelson/Nygaard (2018).
Subject to city council approval, the city allowed a reduction in fee levels, as presented in table 9, when vehicle trips could be reduced beyond the projected trips, such as when a TDM program was used. An additional adjustment was also allowed for affordable and senior housing developments based on the projected trips.
For the TDM-related reduction, the nexus study recommended using the existing C/CAG methodology, which establishes a PH trip credit rate specific to each TDM measure, such as bicycle storage, a dedicated shuttle to rail station, subsidized transit passes, and a vanpool program, among others. The level of reduction would depend significantly on the combination of these measures and on the number of employees and residents per land use.
The study also recommended trip reduction credits for TODs within one-half mile of transit stations when the following conditions were satisfied:81
If a development project met these conditions, the city allowed a 6 percent transit share adjustment in estimating the new vehicle trips based on the current level of access to public transit. If transit access were to improve beyond the current level, an additional fee reduction could be applied based on a new higher transit share percentage.
As a part of the 2018 transportation impact fee nexus study, the consultant conducted a review of neighboring and peer communities of the City of East Palo Alto to examine the methodologies used in estimating the fees and the actual fee schedules implemented in these communities. Although not comprehensive, this review in part served as an initial look into development feasibility analysis of the maximum legally defensible fee schedules developed in the nexus study.
A survey of 95 different jurisdictions indicated that approximately 23 percent of those surveyed used the PH vehicle trips as the demand basis for fee assessment, the same approach used for East Palo Alto. Other jurisdictions used a different demand basis; for example, 42 percent used average daily trips, 34 percent used some measure of property size (e.g., square footage, number of units), and the remaining 1 percent used building valuation.
It was also found that the actual implemented fee schedules varied widely. As shown in table 10, for residential developments, the difference in fees was as much as $22,700, ranging from $511/DU in San Ramon to $23,206/DU in Pittsburg. For commercial developments, some cities, such as Daly City and Live Oaks, did not impose any fees, and the highest fee was $23.39/1,000 ft2 in Emeryville.
| Jurisdiction | Single family |
Multifamily |
Retail/ commercial |
Office |
|---|---|---|---|---|
Per DU |
Per 1,000 ft2 |
|||
East Palo Alto |
$2,358 |
$1,775 |
$7.33 |
$7.33 |
San Ramon |
$733 |
$511 |
$2.09 |
$0.96 |
West Berkeley |
$630–$1,206 |
$630–$1,206 |
$5.10 |
$3.89 |
Oakland |
$1,000 |
$750 |
$0.75 |
$2.00 |
Redwood City |
$1,124 |
$690 |
$2.28 |
$1.66 |
Redwood City (Outside DT) |
$1,499 |
$920 |
$3.04 |
$2.21 |
Martinez |
$1,444 |
$993 |
$1.45 |
$1.18 |
Daly City |
$1,464 |
$1,836 |
– |
– |
Richmond |
$1,516 |
$1,212 |
$3.77 |
$3.32 |
Sunnyvale |
$1,805 |
$1,108 |
$3.34 |
$2.66 |
Walnut Creek |
$2,462 |
$1,477 |
$7.04 |
$6.97 |
Pleasant Hill |
$2,572 |
$2,062 |
$12.31 |
$5.86 |
Menlo Park |
$2,623 |
$1,610 |
$3.88 |
$3.88 |
Palo Alto |
$2,627 |
$1,613 |
$3.88 |
$3.88 |
Live Oaks |
$3,011 |
$2,290 |
– |
– |
Vallejo |
$4,571 |
$2,572 |
$4.73 |
$3.59 |
Vacaville |
$8,745 |
$5,421 |
$4.73 |
$3.59 |
Emeryville |
$12,541 |
$7,023 |
$23.39 |
$18.69 |
Pittsburg |
$23,206 |
$14,219 |
$2.74 |
$2.58 |
Source: Nelson/Nygaard (2018).
It is interesting to note that the fees for residential developments for East Palo Alto ($2,358/$1,775) were close to those in Menlo Park ($2,623/$1,610) and Palo Alto ($2,627/$1,613), two cities abutting East Palo Alto, whereas those for commercial developments were almost double (i.e., $7.33 for East Palo Alto and $3.88 for both Palo Alto and Menlo Park). This may be the reason why the city reduced the maximum defensible fee for retail property assessed in the nexus study from $13.30 to $7.33.
Local governments’ use of DIFs has evolved substantially over recent decades. Although at times complex and challenging, the underlying DIF principles are defined better now than ever. For public agencies new to DIFs, a substantial body of literature and case examples exist—some of which appear in this primer—that can help guide a DIF implementation process. Due to their focus on off-site improvements for new developments, DIFs can serve local governments as a reliable, local infrastructure funding source that will accommodate growth. Together with development agreements, DIFs represent one of the most powerful and robust VC techniques at public agencies’ disposal to help fund transportation infrastructure improvements.
79 The city adopted maximum fee levels in all cases, except for the transportation impact fees for retail developments (see section 7.4 for more details).
80 Although the fee schedule presented in table 9 is based on the number of vehicle trips generated, the basic methodology can just as well use VMT as the basis for demand, which would better represent the actual infrastructure usage. If average trip length is applied uniformly to derive VMT for the entire city, the VMT-based fee schedule would essentially be the same as those presented in table 9. The 2018 nexus study performed VMT-based fee assessments using (1) the same average trip length that applied citywide (in this case, 7.92 miles/trip) and (2) two different average trip lengths representing areas within the RBD (i.e., 7.25 mi/trip) and outside the RBD (i.e., 8.46 mi/trip). The city, however, never implemented the VMT-based fee assessments.
81 This recommendation was based on the Assembly Bill 3005 (AB 3005), which the California State Legislature adopted in 2008.