


TABLE OF CONTENTS
LIST OF FIGURES
LIST OF TABLES
LIST OF BOXES
Chapter 1 introduced the importance of effective risk management in value capture. This chapter provides an overview of the risk management process in the context of value capture, describing the different steps in the process. To provide a framework in the process of risk identification, this chapter also introduces the value capture risk categories and risk types used in subsequent chapters. In response to the uncertainty associated with risks in a transportation project, transportation agencies at all levels of government often rely on the risk management process to understand existing risks, quantify their potential impact on a project, and elaborate a response to them.
The risk management process is defined as a continuous process for systematically identifying, assessing, allocating, mitigating, and monitoring risk throughout the lifecycle of a project (7). The continuous nature of the risk management process is critical, because risks will change as the project enters different phases. As presented in Figure 1 , the risk management process consists of five sequential steps: 1) risk identification; 2) risk assessment; 3) risk allocation, 4) risk mitigation; and 5) risk monitoring. Each step of the process is discussed in the sections that follow in terms of the overall risk management process applied to any transportation project. Where relevant, references specific to value capture are made, but it should be emphasized that value capture is one of many aspects of a project that involves risk.
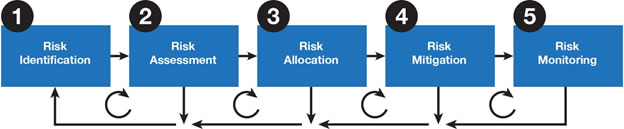
Figure 1. Risk Management Process (4)
The first step in risk management is to identify potential risks. Risk identification should start at the early stages of the project and continue during the entire life of the project. There are two common approaches to identifying project risks:
These approaches are not mutually exclusive. Using a general checklist cannot substitute for detailed consideration of the risks of a particular project by internal and/or external experts. As a hybrid approach, the risk checklist can be used to develop a preliminary list of risks for the project in question. Once a preliminary risk checklist has been developed, local governments may then convene a structured brainstorming session among experts in fields relevant to the project to produce a comprehensive list of major project risks. Unlike unstructured brainstorming, in which participants contribute ideas as they occur to them, structured brainstorming provides specific rules for participants to follow to make the generation of ideas more systematic and to ensure even participation, regardless of personality and/or ranking. This structured brainstorming process is described in Box 1 below.
Table 3 introduces the value capture risk classification used in this primer to describe the most common risks to which value capture funding for transportation is subject. The table includes both risk categories and risk types. This table can be used as a basis or starting point to develop a project-specific value capture risk checklist. Each of these risk categories is described in more detail in the chapters that follow. The chapters also include examples that can help practitioners determine which risks are relevant to a specific project.
The next step of the risk management process is to assess the nature of each risk identified and defined in the previous step. In this step, the likelihood of occurrence and severity of loss of each risk is assessed, in most cases, qualitatively. Quantitative risk assessments are normally performed in the planning phases once the scope of the project is completely defined. A quantitative analysis of risk would require estimating the probability of loss, the value of loss, and the expected value of loss (probability multiplied by times value). Qualitative analysis mirrors this approach, by characterizing the likelihood of a risk event occurring and the severity of the loss if the risk occurs. Likelihood of occurrence and severity of loss of a risk can be qualitatively assessed by means of risk prioritization matrices. For instance, likelihood of occurrence can be characterized as: (i) nearly certain; (ii) possible; or (iii) rare. On the other hand, severity of loss can be characterized as: (i) insignificant; (ii) moderate; or (iii) major.
These characterizations can then be combined in a matrix to define the overall level of priority as low, medium, or high as illustrated in Table 4.
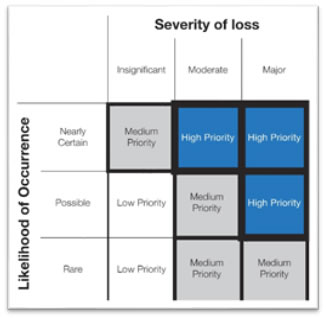
Figure 2. Risk Prioritization Matrix
The structured brainstorming (see Box 1) and expert consultation approaches described earlier in the risk identification step can also be applied to develop the risk prioritization matrix shown in Figure 2.
The result of this step is the characterization of each risk in terms of severity of impact, priority, proposed allocation, and potential mitigation strategies. The proposed allocation and potential mitigation strategies are preliminary and will be defined in the next steps of the risk management process. Table 5 presents a risk assessment table that could be used to summarize the results of this step.
Results from this assessment will allow the parties involved in the project to properly allocate risks and define mitigation strategies. The combination of likelihood of occurrence and the severity of loss directly affects each party’s willingness to accept a certain risk. Finally, it is important to note that identifying risk mitigation strategies in this step is critical to allocate risks adequately in the next step. This is because the ability to mitigate a particular risk may lead a party to accept a risk that it would otherwise not accept.
In this step, the risks identified and assessed in previous steps are allocated. It is important to start allocating risks in order of priority, as determined in the previous risk assessment step. In general, risks should be allocated to the party that has the ability and willingness to manage each risk (e.g., the local government itself or a private developer). To accomplish this, local governments may apply the following principles in sequential order (6):
Following the order of those principles, a local government would generally first allocate any risk that can reasonably be controlled by either party (or both) to the party best able to control it. If a risk cannot be controlled directly, it should generally be allocated the party best able to anticipate and respond to it. Risks that cannot be controlled or responded to should be allocated to the party best able to bear the risk. In some cases, these principles may weigh against each other. For instance, a party can be best able to control the likelihood of the risk event occurring (Principle 1), but it may incur a higher cost to absorb the risk (Principle 3). In these cases, deciding on the prevailing principle may require judgment based on the experience of agency staff and its advisors. It is here that the availability of possible risk mitigation strategies could affect the relative ability and cost of parties to manage each risk.
The result of applying the allocation principles can be summarized in a risk allocation matrix. The risk allocation matrix is a management tool that defines if project risks are retained, shared, or transferred (6). A risk allocation matrix may include the following columns, as illustrated in Table 6 :
In value capture, risks may be retained by the local government or may be transferred to a private partner (e.g., a private developer), users of the service, or to third parties such as insurance providers. Risk allocation may also be achieved through ordinances, bylaws, or agreements with other government units involved in the project. Ordinances and bylaws may be used to allocate the risk between the local governments and the users (e.g., escalation provisions in street maintenance fees). Agreements may be used to allocate risks among local governments (i.e., inter-local agreements), or between local governments and the private sector (e.g., a development agreement). Ordinances, bylaws, and agreements define who will bear each risk and by what mechanism.
Table 6 shows an example of a partial risk allocation matrix for a hypothetical joint development (JD) project to develop commercial property associated with a local government-sponsored transportation project (e.g., on top of a cap built over a transportation facility, or commercial space connected to a transit station). The table includes examples of hypothetical risks being allocated to either the private developer, to the local government, or shared between both parties.
Risk mitigation entails the identification and implementation of a set of strategies with the objective of reducing the probability of a risk event and/or the severity of the loss in case the risk is materialized (7). During the risk allocation step, certain risks are retained by the local government while others are transferred to other parties. In the risk mitigation step, the local government should focus on risks retained, risks shared with other parties, and risks which, although they are transferred to another party, require support from the local government to be mitigated (8).
In this step, local governments can assess the costs and benefits associated with each mitigation strategy to justify their adoption. Some of the mitigation strategies were already identified in the risk allocation step. These strategies are refined during the risk mitigation step. It is important to note that to implement certain risk mitigation strategies will require coordination between two or more parties. For instance, the local government can share relevant information about local employment and migration trends so the private party can perform a comprehensive analysis to evaluate the impact of potential local economic and demographic risks in the project.
Box 2 contains examples of risk mitigation strategies that can be applied across the risks identified.
Once the risks have been fully allocated and the allocation instruments are executed (if they are part of an agreement) or adopted (if allocated through an ordinance or bylaws), the local government can establish a risk monitoring process. This is a continuous process focused on tracking risk factors and performance measures, or indicators of the likelihood of occurrence and potential severity of the risk events identified. In this step, local governments perform a continuous re-assessment of exposure to each risk that allows for mitigation strategies to be modified and implemented as needed. Monitoring risks also allows local governments to identify new risks that may not have been identified previously and that may emerge during the implementation of the project. These risks can then be assessed, allocated, and mitigated if necessary. An example of a tool used by local governments in Texas to monitor property tax incremental revenue in TRZs is the TRZ Dashboard described in Box 3. The TRZ Dashboard allows local governments to identify positive and negative trends in land development and property values within the zone, and if needed take action to mitigate negative impacts on revenue through policy actions to foster development within the zone (9).
In this step, local governments can assess the costs and benefits associated with each mitigation strategy to justify their adoption. Box 2 contains some examples of risk mitigation strategies that can be applied across the identified risks.
Box 3. TRZ Dashboard for TRZ Risk Monitoring Several local governments in Texas have implemented TRZs to close funding gaps of transportation projects. However, they had no tools to monitor the development spurred by the project or quantifying the revenues generated within the TRZ. The Texas Department of Transportation (TxDOT) funded the development of the TRZ Dashboard to help local governments to overcome this challenge. The Texas TRZ Dashboard allows local governments to monitor revenues from the year in which the TRZ was established to monitor how far revenue projections were from actual realizations. Moreover, the TRZ Dashboard allows local governments to monitor trends in taxable appraised values, land use, and development status of the real properties within the TRZ to observe the dynamics of transportation infrastructure and land development. Using this risk monitoring tool, local governments can assess the risk exposure during all stages of the project, including operation, and implement mitigation strategies at any point in time to avoid the materialization of the risk or reduce the impact. Below is a screenshot of the TRZ Dashboard’s user interface that shows development and land-use changes that took place on parcels located within the City of El Paso TRZ No.3 between the base year (2009) and 2020. Several properties adjacent to the roadway changed from vacant to developed and/or were up-zoned from open space to residential and commercial uses. If a situation develops where the local government determines that, as a result of a slowdown in development activity, the likelihood that TRZ revenues may not be sufficient to service debt has grown, mitigation strategies to attract new development to the area could be implemented. 
Source: Texas A&M Transportation Institute |