U.S. Department of Transportation
Federal Highway Administration
1200 New Jersey Avenue, SE
Washington, DC 20590
202-366-4000
| |
| Conditions and Performance Report Executive Summary |
| Executive Summary Chapter Listing Conditions and Performance Home Page
|
|
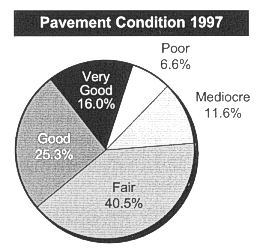
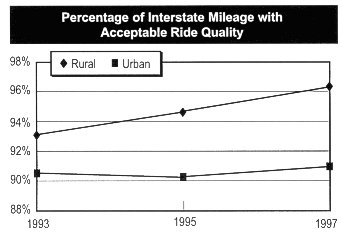
 In 1997, overall pavement condition was rated 16.0 percent very good, 25.3 percent good, 40.5 percent fair, 11.6 percent mediocre and 6.6 percent poor. These ratings are based on the International Roughness Index (IRI), a measure of "ride quality" for higher functional classes, and on the Present Serviceability Rating (PSR) for lower functional classes. Since 1993, the percentage of road miles in poor condition has dropped from 8.6 percent to 6.6 percent. Supporting the largest share of vehicle travel, Interstate pavement condition has continued to improve. The percentage of all Interstate mileage with acceptable ride quality increased from 91.2 percent in 1993 to 92.4 percent in 1997. The percentage of Interstate mileage in the urban areas with acceptable ride quality (not "poor") increased from 90.5 percent in 1993 to 90.8 percent in 1997. In the rural areas, Interstate pavement mileage with acceptable ride quality increased from 93.1 percent to 96.2 percent since 1993.  |
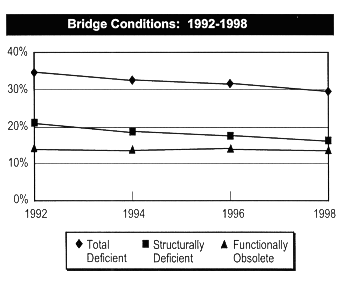
Generally, for all functional systems, the pavement conditions in rural areas were slightly better than in urban areas. In 1997, approximately 65 percent of rural roads meet horizontal (curve) design standards and 60 percent meet vertical design standards. In addition, 53 percent of urban mileage and 66 percent of rural mileage have 12+ foot lanes. The common indicator used to evaluate the condition of our Nation’s bridges is the number of deficient bridges. There are two types of deficient bridges: structurally deficient and functionally obsolete. The number of deficient bridges on our transportation system have been steadily declining. In 1998, only 29.6 percent of our Nation’s bridges were deficient; 16.0 percent of bridges were structurally deficient while 13.6 percent were functionally obsolete.  Bridges on the Interstate have the lowest percentage of deficient bridges (16.4 percent in rural areas and 26.8 percent in urban areas) of all functional classes. A larger percentage, 32.5, of bridges in urban areas are deficient than those in rural areas, 28.8. Over half of the deficient bridges are under local governments’ jurisdiction. |