U.S. Department of Transportation
Federal Highway Administration
1200 New Jersey Avenue, SE
Washington, DC 20590
202-366-4000
| |
| Conditions and Performance Report Executive Summary |
| Executive Summary Chapter Listing Conditions and Performance Home Page
|
|
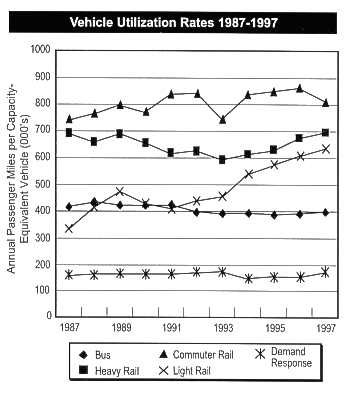
Transit operational performance is measured at the system level by average operating speeds and vehicle utilization. Transit performance is measured at the passenger level by waiting times, reliability, and seating conditions. Average transit operating speeds were 20.3 miles per hour in 1997. The average speed for rail modes was 26.1 miles per hour, while average speeds for non-rail modes was 13.8 miles per hour. These figures have been relatively constant for several years. Vehicle utilization is measured as passenger miles per vehicle, adjusted to reflect differences in vehicle capacity among different modes. Vehicle utilization is heaviest for rail modes, including commuter rail (815 thousand passenger miles per capacity-equivalent vehicle), heavy rail (696 thousand), and light rail (638 thousand). Utilization is substantially lower for non-rail modes, such as bus (400 thousand) and demand response (170 thousand), even accounting for the smaller size of these vehicles. 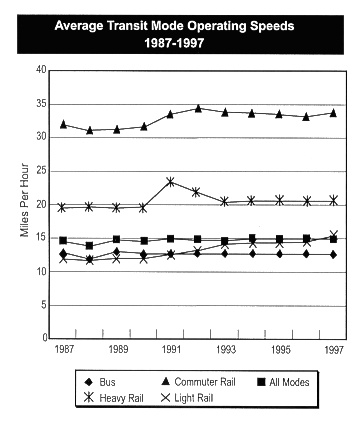 |
 Average waiting times and reliability (variation in waiting times) vary by public policy function. Average waiting times for basic mobility passenger were greater (at 12.1 minutes) than for location efficiency (8.9 minutes) and congestion management (7.3 minutes), and were also more variable. Seating conditions, measured by the percentage of passengers who find a seat unavailable upon boarding, are roughly equivalent for each of the three market niches filled by transit, at 25 to 30 percent.  |

