U.S. Department of Transportation
Federal Highway Administration
1200 New Jersey Avenue, SE
Washington, DC 20590
202-366-4000
| |
| Conditions and Performance Report Executive Summary |
| Executive Summary Chapter Listing Conditions and Performance Home Page
|
|
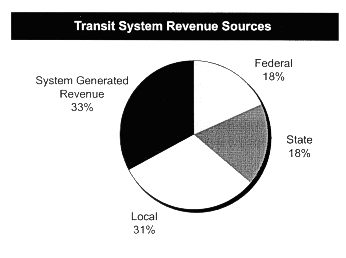
Public funding for transit in 1997 totaled $17.5 billion. Twenty-seven percent of public funding came from the Federal government, an increase over recent years. Public funding for transit increased at an annual rate of 1.3 percent in real (inflation-adjusted) dollars from 1990 to 1997. This growth was substantially greater than that seen during the 1980s, but is well below the large growth rates in public funding for transit experienced in the 1960s and 1970s.  Public funding accounted for just over two-thirds of transit revenues in 1997. Local government was the largest jurisdictional source, at $8.1 billion. The most significant tax sources were general appropriations (18.7 percent of revenues), fuel taxes (16.5 percent), and sales taxes (14.7 percent). Passenger fares accounted for 27.5 percent of revenues, and other system revenues (e.g., advertising) accounted for 5.2 percent. Federal capital assistance increased significantly between 1994 and 1997, from $2.5 billion to $4.1 billion. State and local capital spending remained relatively constant between 1995 and 1997, after increasing steadily since 1990. As a result, the Federal share of capital funding reversed its previous declines and stood at 54 percent in 1997. |
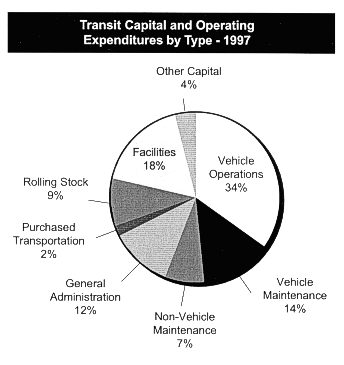
In 1997, total spending for transit capital projects was $7.6 billion. Fifty-eight percent of capital spending was for facilities, while 29 percent was spent on vehicles and the remaining 13 percent was spent on other capital expenditures. Operating expenses for transit totaled $17.5 bil-lion in 1997. Fifty percent of operating expenses went to vehicle operations, 31 percent to vehicle and non-vehicle maintenance, and 20 percent on administration and purchased transportation. Bus operations accounted for a majority of operating expenditures in 1997, totaling $9.8 billion. Heavy rail operations were next largest at $3.5 billion, followed by commuter rail at $2.3 billion. From 1988 to 1997, operating expenses increased 40 percent for bus opera-tions, 300 percent for demand response services, 139 percent for light rail, and 21 percent for commuter rail. Operating expenses for heavy rail decreased by 1 percent.  |