

- Transit Economic Requirements Model
- TERM Investment Scenarios
- Description of Model
- Asset Rehabilitation and Replacement Module
- Asset Expansion Module
- Performance Enhancement Module
- Benefit-Cost Tests
- Investment Requirements for Rural and Specialized Transit Service Providers
This appendix contains a technical description of the methods used to determine transit asset conditions (see Chapter 3) and future investment requirements (see Chapter 7). It is primarily a description of the Transit Economic Requirements Model (TERM).
Transit Economic Requirements Model
TERM estimates the physical conditions of U.S. transit assets, as reported in Chapter 3, and the total annual capital expenditures that will be required by all urbanized areas from Federal, State, and local governments to maintain or improve the physical condition and level of service of the U.S. transit system infrastructure. TERM also projects how investment will need to be allocated among transit asset vehicles, guideways, systems, stations, and maintenance facilities—over a 20-year period—and the sensitivity of the investment requirements to variations in the rate of future growth in the demand for transit services.
TERM Investment Scenarios
TERM projects transit capital investment requirements for the following four investment scenarios:
- Maintain Conditions
- In the Maintain Conditions scenario, transit assets are replaced and rehabilitated over a 20-year period with the target of reaching an average asset condition at the end of the period (2022) that is the same as the asset condition that existed at the beginning of the period (2002). The model does not necessarily maintain the weighted-average condition of the assets in each year over the 20-year period because actual replacement and rehabilitation needs vary from year to year over this forecast period. Specifically, assets are rehabilitated and replaced as their condition falls below industry standards. These minimum condition levels vary according to asset type, and there are no constraints on the level of re-investment in existing assets in any given period. With TERM, the average condition of the asset base improves significantly during the initial year of investment because the model addresses current backlog needs and then fluctuates between this improved level and the initial condition level, which is reached at the end of the 20-year period.
- Maintain Performance
- For the Maintain Performance scenario, investments are made in new vehicles and related fixed assets (maintenance facilities, stations, trackwork, etc.), as required to support the projected growth in the demand for transit services over the next 20 years. Here the model uses the projected increase in passenger miles traveled (PMT) as forecast by metropolitan planning organizations (MPOs) representing 76 of the Nation's largest metropolitan areas. TERM adds assets at a rate necessary to accommodate the increase in PMTs to achieve the base year (2002) level of average vehicle utilization and average vehicle speed at the end of the 20-year period (2022).
- Improve Conditions
- In the Improve Conditions scenario, transit asset rehabilitation and replacement is accelerated to improve the average condition of each asset type in the existing asset base to an average level of 4, or "good," by 2022. Assets are replaced at a higher condition level than under the Maintain Conditions scenario, meaning that they are not allowed to depreciate as much before they are replaced. This scenario eliminates any backlog of deferred investments that are needed to reach a "good" condition level. Asset conditions make their most significant improvement in the first year and then trend downward gradually, with year-to-year variations, to an overall condition of "good" by 2022.
- Improve Performance
- The Improve Performance scenario simulates capital investments that increase average operating speeds as experienced by passengers and lower average vehicle occupancy to threshold levels by the end of the 20-year period (2022). To improve the nationwide average operating speed, TERM replaces investments in bus vehicles and bus-related infrastructure with investments in rail vehicles and rail-related infrastructure or bus rapid transit (BRT) and related infrastructure in urbanized areas with average operating speeds below a specified minimum threshold. This minimum threshold is set as the average operating speed of all urban transit operators, less a specified fraction of the standard deviation of these operators' average operating speeds. TERM continues to shift from bus to rail or BRT investments until each of the operators in these urbanized areas has an average transit speed at or above this minimum threshold. To lower the nationwide vehicle occupancy rate, TERM makes investments in expansion vehicles and related facilities by agency and by specific mode (e.g., motor bus) when these agency-specific modal services have vehicle occupancy rates above a maximum acceptable threshold level. This maximum is set individually for each mode at the national average occupancy rate for that mode, plus a specified percentage of the standard deviation of the occupancy rate for that mode for all operators. Investments are continued until there are no operators with occupancy rates above the maximum threshold levels. By expanding the level of investment in new fleet vehicles, investments to reduce occupancy also support increases in the frequency of transit service for high occupancy agencies.
| Q. | Do all assets reach a condition of 4 at the end of the 20-year investment period? |
| A. | The capital investment estimated by TERM to be needed to improve conditions closely approximates 4 for all assets averaged together at the end of the 20-year investment period. Given the uneven age distribution for existing transit assets, some asset types may reach an average condition level of slightly less than 4 and some may reach a level of slightly more than 4. The average asset condition reached for investment requirements in this report for the Improve Conditions scenario is estimated to be 3.82 across all asset types. To achieve a higher average condition level would require replacing vehicle and guideway too early in their useful lives. |
Description of Model
TERM comprises four distinct modules:
- Asset Rehabilitation and Replacement Module. Reinvests in existing assets to maintain or improve their physical condition.
- Asset Expansion. Invests in new assets to maintain operating performance given projected increases in the demand for transit services; i.e., projected PMT.
- Performance Enhancement. Invests in new assets to improve operating performance as measured by speed and capacity utilization.
- Benefit-Cost Tests. Includes only investments with a cost-benefit ratio greater than 1.0 in TERM's estimates of national transit capital requirements. This process roughly corresponds to the "Maximum Economic Investment" concept in NBIAS.
Asset Rehabilitation and Replacement Module
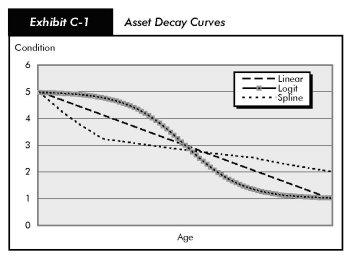
The Asset Rehabilitation and Replacement Module uses statistically determined decay curves to simulate the deterioration of the Nation's transit vehicles, facilities, and other infrastructure components. As the assets age and are used, their condition declines, leading ultimately to investments in rehabilitation and replacement.
The vehicle, maintenance facility, and station decay curves are based on data collected by the Federal Transit Administration (FTA) through engineering surveys performed between 1999 and 2003. The surveys found that most assets depreciate rapidly in early years, followed by slower decay for an extended period through the asset's mid-life and, finally, a more rapid decline in asset condition toward the end of the asset's useful life. These newly estimated decay curves for vehicles, maintenance facilities, and stations, which are in the form of "spline" regression models, differ significantly from the decay curves that continue to be used for other asset types. National Transit Database (NTD) data are applied to these decay curves to estimate conditions, which are subsequently used to estimate rehabilitation and replacement costs. Stations use the same decay curves as maintenance facilities. FTA has just finished conducting physical surveys of a statistically representative sample of stations and will estimate and apply a unique decay curve to calculate investment requirements for stations in subsequent reports.
The decay curves for other nonvehicle infrastructure—guideway, systems, and stations—use "logit" function curves. These decay curves were estimated using extensive data sets collected by the Regional Transportation Authority in Northeastern Illinois and the Chicago Transit Authority in the mid-1980s and 1990s.
These decay curve relationships are applied to a comprehensive inventory of all transit assets utilized by the Nation's transit agencies. This asset inventory was initially developed in the 1990s when all major transit operators were asked to submit detailed listings of their transit capital assets. Since that time, the inventory has undergone periodic updates, primarily through vehicle data collected for the NTD. Over the period 2002 through 2003, the asset inventory was further updated using data collected through NTD's Asset Condition Reporting module and directly from the New York Metropolitan Transportation Authority. In these recent surveys, transit operators were asked to list the assets they have in operation, as well as the type, age, purchase price, and—when available—quantity of each. This information has been converted to a 2002-dollar basis by TERM. TERM generates data estimates for agencies with missing data records on the basis of these agencies' characteristics, such as the number of vehicles, stations, track miles, and original years of construction.
Starting with the 1999 Report, TERM has been able to consider varying replacement scenarios for each of the five major asset categories. Multiple iterations of TERM are run until the "target" condition for each asset type is achieved at the end of the 20-year investment horizon. Under the Maintain Conditions scenario, the target condition for each of the five asset types is set to its initial level. In the Improve Conditions scenario, the target condition for each asset type is set to "good" (condition level 4).
Asset Expansion Module
The Asset Expansion Module identifies the level of investment that will be required in each major asset category to continue to operate at the current level of service as transit travel (PMT) increases; i.e., to maintain performance. TERM adds assets at a rate necessary to maintain current vehicle occupancy rates over the 20-year analysis period. Investments undertaken by the Asset Expansion Module during the first part of the 20-year forecast period are depreciated, rehabilitated, and replaced by the Asset Rehabilitation and Replacement Module as required.
TERM uses the most recent PMT projections (in most cases 2002) available from a sample of 76 of the nation's MPOs, including those from the nation's 33 largest metropolitan areas. These are the most comprehensive projections of transit travel growth available. Projected passenger trips were used in lieu of projected PMTs when the latter were unavailable. Transit travel growth rates for the 370 urbanized areas for which transit travel projections were either unavailable or not collected were assumed to be equal to the average growth rate of an urban area of an equivalent population size located within that FTA region. The weighted-average transit PMT growth rate calculated from the MPO forecasts and used in TERM was 1.5 percent. Passenger travel growth rate forecasts varied according to region and ranged from 0.95 to 3.15.
Performance Enhancement Module
The Performance Enhancement Module simulates investments that improve performance either by increasing average transit operating speed or reducing average vehicle occupancy rate. To raise speed, additional investment is undertaken in heavy rail if an area already has an existing heavy rail service. Otherwise, for areas with populations of over 1 million, additional investment is undertaken in light rail, if light rail exists. If there are bus services only, investment is shifted from bus to light rail. In areas with populations under 1 million, performance enhancements are made by shifting investment from regular bus to BRT. To reduce occupancy levels, additional infrastructure is purchased for areas and modes with vehicle utilization rates (occupancy levels) above the threshold level.
Benefit-Cost Tests
All investments identified by TERM are subject to a benefit-cost test. The Rehabilitation and Replacement and Asset Expansion modules apply a benefit-cost test to all investments on a by-mode and by-agency basis; i.e., these modules consider the value of investing in a particular transit mode by a particular agency, but do not evaluate the benefit of purchasing each piece of equipment separately or on the basis of the location where the investment will be made within each agency's operating area. In the case of transit, where investments comprise a wide range of capital goods, it is more practical to evaluate transit investments as a package. In the Performance Enhancement module, investments to decrease vehicle utilization also are evaluated by agency and by mode, but investments to increase operating speeds are evaluated on an urbanized area basis rather than on an agency and modal basis to take into account the shift from bus to rail investments. TERM calculates and compares for each mode in each agency, or in the case of speed improvements for each urbanized area, the discounted stream of capital investment and operating and maintenance expenditures combined with the discounted stream of anticipated benefits accruing from the particular type of transit service investment being evaluated during a 20-year period. If the benefit/cost ratio is greater than 1.0, i.e., the discounted stream of benefits exceeds the discounted stream of costs, the model's estimate of the capital investment is included in the overall national investment needs estimate. If the benefit/cost ratio is less than 1.0, the investment is excluded.
| Q. | How does TERM treat passenger fares? |
| A. | Passenger fares have not been factored into in the benefit-cost analysis used by TERM. Although passenger fares accrue to transit agencies, these funds are simply a transfer from other sectors of the economy, and do not increase benefits to society as a whole. Earlier versions of TERM incorrectly treated passenger fares as a benefit. This revision means that fewer potential transit investments now pass the benefit-cost hurdle in TERM. |
The Benefit-Cost module identifies three categories of benefits:
- Transportation System User Benefits
- Travel-time savings, reduced highway congestion and delay, and reduced automobile costs (parking costs and taxi expenditures).
- Social Benefits
- Reduced air and noise emissions, roadway wear, and transportation system administration.
- Transit Agency Benefits
- Reductions in operating and maintenance costs.
Whenever possible, the total level of benefits associated with each investment type is modeled on a per-transit PMT or per-auto vehicle miles traveled basis. Most of the benefits from transit investment are estimated by TERM to be transportation system user benefits and accrue to both new and existing passengers under both the Asset Expansion and the Performance Enhancement modules. Transit agency benefits—reduced operating and maintenance costs—are used to evaluate investments recommended by the Rehabilitation and Replacement and Asset Expansion modules, while social benefits—reduced air and noise emissions, roadway wear, and transportation system administration—are used to evaluate both Asset Expansion and Performance Enhancement investments.
The cost-benefit analysis performed by TERM uses elasticities to measure the effect of changes in user costs on transit ridership that result from shifting from a private vehicle to transit, or from a reduction in travel time resulting from the expansion of the transit asset base either to increase speed or reduce occupancy levels (by increasing service frequency). This is only a first order response. Any subsequent decreases in performance from the increased ridership and subsequent investments to meet this ridership are not considered.
Investment Requirements for Rural and Specialized Transit Service Providers
Investment requirements for rural areas are based on data collected in 2000 by the Community Transportation Association of America (CTAA). These data include the number and age of rural transit vehicles, according to vehicle type, such as buses (classified according to size) or vans. Requirements are estimated by determining the number of vehicles that will need to be replaced in each year over the 20-year investment period, totaling them and multiplying by an estimated average vehicle purchase price based on information reported to FTA by transit operators for vehicle purchases in 2002. (These average prices are also used in TERM.) The number of rural vehicles that will need to be purchased to Maintain/Improve Conditions is calculated by dividing the total number of each type of bus vehicle or van by its replacement age, with different assumptions made of the replacement ages needed to maintain or improve conditions. The replacement age to Maintain Conditions is assumed to be higher than the industry recommended replacement age because surveys have revealed that transit vehicles are often kept beyond their recommended useful life. The Maintain Conditions replacement age is calculated by multiplying the industry-recommended replacement age for each vehicle type by the ratio of the average age to the industry-recommended age of large buses. The Improve Conditions replacement age is assumed to equal the industry-recommended age, and small vehicles are all assumed to be replaced with higher-cost vehicles accessible to the disabled. The Improve Conditions scenario also assumes additional vehicle purchases in the first year to eliminate the backlog of overage vehicles. The number of vehicles necessary to Improve Performance was estimated by increasing fleet size by an average annual rate of 3.5 percent over the 20 year projection period. A 1994 study by CTAA, and more recent studies examining rural transit investment requirements in five states, identified considerable unmet rural transit needs in areas where there is either no transit coverage or substandard coverage. The assumed 3.5 percent growth to fulfill these unmet rural investment requirements is less than half the 7.8 percent average annual increase in the number of rural vehicles in active service between 1994 and 2000. The investment requirements provided in the 2002 report also assumed a 3.5 percent average annual growth in the rural fleet.
A similar methodology was applied to estimate the investment requirements of Special Service Vehicles, comprised principally of vans. A replacement age of 7 years was assumed to maintain conditions and 5 years to improve conditions. The Improve Conditions scenario also assumes additional vehicle purchases in the first year to eliminate the backlog of overage vehicles. No projections were made for performance enhancements. The inventory of existing special service vehicles as estimated by FTA increased from 28,664 in 2000 to 37,720 in 2002.