

- Transit Benefits
- Mobility
- Location Efficiency and Economic Growth
- Congestion Management
- Saving Energy and Protecting the Environment
- Saving Lives and Responding to Emergencies
- Surveys of Transit Ridership
- National Household Travel Survey
- Transit Performance Monitoring System
- User Characteristics
- Location of Transit Usage
- Car Availability
- Frequency of Use
- Persons Served in the Community
- Duration of Use
- Transit Access and Egress
- Trip Purpose
- Alternative Mode of Travel
- Gender and Age
- Income Distribution
- User Benefits of Transit
- Longitudinal Survey of Benefits of Transit
The Importance of Transit
Transit Benefits
Transit provides benefits for people who choose to ride it, as well as for people who do not. Those who ride transit because they have no alternative means to travel reap the rewards of enhanced mobility, including access to jobs, education, health services, community activities, and friends and family. Those who choose to ride transit despite access to private transportation alternatives do so for a variety of reasons, including faster travel times, safer travel conditions, reduced stress, and even the ability to engage in activities such as reading while commuting. When transit serves a community well, even those who do not ride it enjoy the benefits of reduced traffic congestion, improved air quality, energy conservation, and a healthier local economy.
Mobility
Many people who ride transit do not have access to a private automobile. Many are unable to afford a car; but others, particularly in transit-intensive cities like New York, may choose not to own a car simply because convenient, reliable transit is available. Still others may be unable to drive due to physical disabilities or age-related conditions.
In 2000, there were more than 30 million older adults in America, and that number is expected to double by 2030; almost 54 million people were reported to have disabilities; and more than 34 million people have household incomes that are below the poverty line. For many of these individuals, transit is their sole means to access employment and community services and to conduct the basic business of everyday life, whether that is traveling to the grocery store, the dry cleaner, a family member's home, or the dentist office.
Since the passage of the Americans with Disabilities Act (ADA) in 1990, transit has played an expanding role in proving basic mobility to people with disabilities. The ADA required that all fixed-route transit services and facilities be made accessible to people with disabilities. Complementary paratransit services must be provided to individuals whose disabilities prevent them from using fixed-route services. Today, over 90 percent of America's public transit buses are accessible, and every new bus or transit system must be accessible. Further, 86 percent of the 685 rail stations that have been designated as "Key Stations" are ADA-compliant or, in the case of 44 stations, are operating under a voluntary compliance agreement.
Most fixed-route transit and paratransit is funded by a combination of Federal Department of Transportation programs, State and local tax revenue, fare-box revenue, and other transit-related earned income. However, there are 62 programs in 10 Federal departments that fund transportation services for individuals who have low incomes, persons with disabilities, or older adults. Generally, these human service transportation programs restrict their transportation service to a specific destination (such as medical care or a particular human service center), a limited timeframe, and the eligible clients of the human service agency. Often, service routes overlap; but lack of coordination among providers, as well as rules that restrict services and eligibility, prevents agencies from sharing these important transportation resources across programs.
On February 24, 2004, President Bush issued Executive Order 13330 on Human Service Transportation Coordination, which required 11 Federal agencies to work together to simplify access to transportation services, identify useful practices to enhance coordination and improve services, eliminate duplication and overlap among Federally funded programs, and improve the coordination of Federally supported transportation services at all levels. Through the Federal Coordinating Council on Access and Mobility, chaired by Secretary of Transportation Norman Y. Mineta, these Federal agencies have pursued education and outreach strategies, identified key regulatory barriers to coordination, created programs and tools to enhance coordinated transportation planning at the community level, tackled the challenging issue of how to allocate costs among programs that share transportation services, and developed a Web site that provides universal access to useful practices for improving the coordination of transportation services.
Location Efficiency and Economic Growth
Investment in transit generates real and substantial economic returns. It sets off an economic chain reaction that generates business activity, creates jobs, boosts property values and tax earnings, and improves productivity. Not surprisingly, more and more communities, developers, and financial investors are recognizing the appeal of transit-oriented development. Commercial activities such as retail, restaurants, theaters, and legal and financial services thrive on the concentration of large numbers of people and businesses in close geographic proximity. Households recognize the advantages of reduced transportation costs and the convenience of walking, biking, or taking transit to employment, entertainment, and businesses.
The American Association of Retired Persons reports that fully 71 percent of older Americans—the Nation's fastest-growing population group—want to live within walking distance of transit. The composition of American households is also changing. The traditional nuclear families that made up 40 percent of households in 1970 now comprise less than 25 percent of households. In just one generation, the "typical" American household won't have children living in it. In fact, nearly 70 percent of households will not include children; they will consist of singles, empty nesters, and couples without children. These are groups with a proven preference for a "mixed use" living environment that combines interesting housing options with the amenities of the city.
The Center for Transit Oriented Development recently released a national market assessment of demand for housing near transit in the next two decades. Even using a very conservative methodology, it reached what the authors call a "staggering" conclusion. They project that, over the next 20 years, at least a quarter of all American households are likely to seek housing near transit. There is, in fact, the potential to more than double the amount of housing in transit zones in the next 20 years.
The Surface Transportation Policy Project has found that the cost of car ownership can put the American dream of home ownership out of reach for families with lower incomes. According to a July 2003 STPP report, American households spent 19 cents of every household dollar on transportation expenses in 2001—and lower-income households are forced to spend an even higher percentage on transportation. In fact, transportation is the second largest household expense, after housing, and is three times the cost of health care. It amounts to, on average, over $7,600 dollars each year, just to get around; and saving for a home becomes that much more difficult.
Congestion Management
Traffic congestion impacts the movement of goods and the movement of people—at a significant cost to the American economy. Travel time generally costs freight carriers between $144 and $192 dollars an hour, but an unscheduled delay nearly doubles those costs, to $371 an hour. At the same time, businesses that depend upon freight movement to support just-in-time delivery systems must increase inventories—and, therefore, costs. In fact, because of congestion, a 10 percent increase in vehicle miles traveled over the existing road system produces a $1 billion increase in annual logistics costs.
The efficient movement of people on our highways is also critical to the economy. Today, 91 percent of all person miles traveled are on highways. The U.S. population grew more than 20 percent in the last 18 years, highway travel increased 80 percent, and the number of drivers increased by 30 percent—but miles of highways increased only 2 percent. Not surprisingly, drivers are spending more and more time stuck in traffic. The 2002 Texas Transportation Institute (TTI) study of 75 urban areas found that congestion is growing in cities of every size, and the average rush hour driver spends 62 hours a year stuck in traffic, up from just 16 hours a year in 1982. According to the study, the total congestion "bill" for the 75 areas came to $67.5 billion in 2000, which was the value of 3.6 billion hours of delay and 5.7 billion gallons of excess fuel consumed.
To improve the mobility of people and the movement of freight requires a multimodal transportation investment. Investments in public transportation that give people the choice to move from single-occupant cars onto transit, coupled with investments in our highway infrastructure that speed the movement of freight as well as cars, represent an opportunity to recapture the lost productivity, wasted fuel, and unnecessary air pollution caused by traffic congestion.
For every $1 million in transit investment, over $1.5 million can be saved. A $10 million investment in transit generates an increase of $2 million in business output and $0.8 million in personal income in the first year; over 20 years, these benefits increase to $31 million in business output and $18 million in personal income.
Some argue that, because roads "fill up" soon after new transit is added or roads are widened, these investments are a waste of money. But this argument ignores the role of mobility in facilitating economic transactions. While capacity expansion in dense areas may not permanently eliminate congestion, it can still bring significant economic benefit by accommodating more activity.
Saving Energy and Protecting the Environment
With greater fuel efficiency and lower emissions per passenger mile, transit is uniquely positioned to help America save energy and protect the environment without imposing new taxes, government mandates, or regulations on businesses or consumers. Currently, public transportation saves America more than 855 million gallons of gasoline each year—or 45 million barrels of oil, the equivalent of about three months of energy used to heat, cool, and operate American homes. And current public transit use helps avoid the release of nearly 745,000 tons of carbon monoxide (CO)—roughly 75 percent of the CO emissions from all U.S. chemical companies. It also avoids the release of more than 7.4 million tons of carbon dioxide each year.
Saving Lives and Responding to Emergencies
Public transportation continues to be one of the safest modes of travel. Riding a transit bus is 91 times safer than car travel, and rail passengers are 15 times safer. Investments that induce more people to choose transit will save lives and save money. Although transit is a potential target of terrorism, it is also a solution for communities during emergencies. Transit serves as an important means for evacuation from affected areas. It is used to transport emergency workers to and from an emergency site; and transit buses are often used as temporary shelters for victims and workers, and even as emergency medical triage facilities. Investments in public transportation help American communities prepare to effectively respond to terrorist acts, as well as other disasters and emergencies.
Surveys of Transit Ridership
This chapter draws on two surveys that collect information on the characteristics of transit users and the types of trips they make. These are the National Household Travel Survey (NHTS) undertaken by the Federal Highway Administration (FHWA), and the Transit Performance Monitoring System (TPMS) undertaken by Federal Transit Administration (FTA) in cooperation with the American Public Transportation Association.
National Household Travel Study
The NHTS was conducted from April 2001 through May 2002. It collected travel data from a national sample of the civilian, non-institutionalized population of the United States, excluding persons living in large college dormitories, nursing homes, other medical institutions, prisons, and military bases. Travel data were collected from a sample of 69,800 households. The final data set included approximately 2,550 responses by persons who had used transit as their principal mode of travel on their day trip and 700 additional responses by people who had used transit as a secondary mode of travel, i.e., most of their trip had been made on another mode.
| Q. | What factors could have affected the NHTS telephone survey results? |
| A. | The NHTS adjustment factors may not have taken into account several growing problems in telephone surveys. The 2001 NHTS was conducted before the Do Not Call List was instituted. American households were saturated with calls from telemarketers making them less likely to participate in a telephone survey. More people have caller ID and phone messaging and can more easily avoid participating in a telephone survey. |
Most of the analysis in this section is based on the responses of travelers who had used transit as their principal mode of travel. These responses were expanded using statistically developed sample weights, i.e., factors that expand the data collected from sample households to represent the entire nation. On a weighted-average basis, passengers who used transit as their principal mode of travel accounted for 90 percent of all transit trips. Adjustment factors also were applied to correct for what is generally believed to be an undersampling of low-income households without telephones. An increasing number of households have only cellular phones and are not reachable by standard telephone survey techniques. For this reason, lower-income people who use transit more frequently may still be underrepresented in the survey.
Transit Performance Monitoring System
Information on characteristics of transit riders and trip purpose also have been collected from onboard surveys by the American Public Transportation Association (APTA) under a cooperative agreement with the FTA. There have been three distinct collection efforts since the implementation of the TPMS agreement in 1995. Information from the first two collection efforts was presented in the 2002 edition of the C&P Report. This edition presents results from the third data collection effort, in which 30 transit systems participated. Each of the Phase III onboard surveys provided by these systems was undertaken at some time between February 1, 2000, and November 30, 2003. This time span of almost four years was necessary in order to collect the maximum amount of survey information. All 30 participating systems operated bus services, and three systems operated both bus and rail services.
Since TPMS collected data from onboard surveys, it was more likely to capture a representative set of responses for a particular operator in a particular area than a telephone survey such as NHTS. However, the aggregated TPMS data are not necessarily representative of the Nation. Therefore, where there is an overlap of information, the data collected by NHTS are presented first, with the data collected by TPMS serving as a comparison. It also should be noted that TPMS statistics are trip-based and reflect choices only for a particular trip.
TPMS also conducted a telephone survey of users who had participated in an onboard survey in Buffalo, New York, in 2000. The purpose of this survey was to collect information on the benefits that they had received from transit over the three-year period and over their lifetimes. A summary of this information is provided at the end of the chapter. The TPMS reports can be found on the FTA Web site at http://www.fta.dot.gov/16053_ENG_HTML.cfm.
User Characteristics
Location of Transit Usage
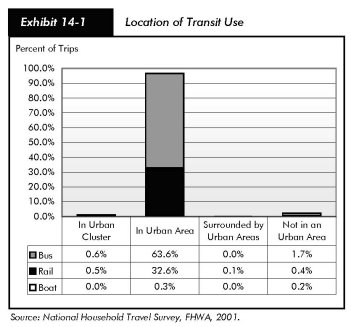
According to the NHTS, 97 percent of all transit trips are made in urbanized areas as defined by the U.S. Bureau of the Census and used by the National Transit Database (Exhibit 14-1). Trips made by bus in urban areas account for 64 percent of all transit trips, and trips by rail in urban areas account for 33 percent of all transit trips. Trips made by boat (passenger line/ferry) account for less than 1 percent of all transit trips.
Car Availability
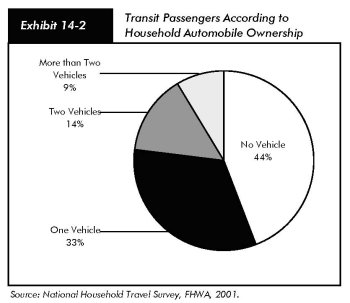
The NHTS found that 33 percent of all passengers using transit as their principal mode of travel on their day trip were from households with one vehicle, 14 percent were from households with two vehicles, and 9 percent were from households with more than two vehicles. Forty-four percent of these passengers combined or 49 percent of bus passengers and 39 percent of rail passengers were from households without cars. Five percent of the passengers using transit as their principal mode of travel used a car for their trip, compared with 7 percent of all passengers who used transit (Exhibit 14-2).
Compared with the NHTS, TPMS surveys were concentrated in areas more dependent on transit. Seventy percent of TPMS trips were made by people with no car available for the trip. This included both households without cars and households with cars where another household member was using the car.
Frequency of Use
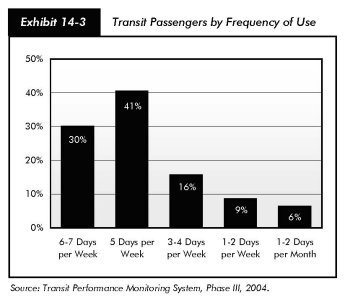
Information on trip frequency was collected by TPMS only. TPMS found that most trips on transit are made by people who ride it frequently. Slightly more than 70 percent of all transit trips in the TPMS Phase III survey were made by passengers using transit 5 days or more a week. Forty percent of the trips surveyed were made by passengers using transit 5 days a week, and 30 percent were made by passengers using transit 6 to 7 days a week. Phase III results on frequency of use are identical to the Phase I and Phase II results, discussed in the 2002 C&P Report (Exhibit 14-3).
Persons Served in the Community
Transit serves a larger number of individuals in the community than is suggested by daily ridership as a result of the daily turnover in riders. Based on sample concepts, a rider who reports using transit once a week on a system that operates six days actually represents six riders. TPMS found that the average ratio of the number of different people using transit to the average number of daily trips is 2.89. If the transit trips made by people using transit 4 days a week or less (which account for 30 percent of transit trips) are converted to the number of people riding transit based on a people-to-trip multiplier, these less-frequent riders are estimated to account for 67 percent of all people using transit. The experiences of these infrequent riders on transit may, therefore, have a large effect on the perception of transit in the community.
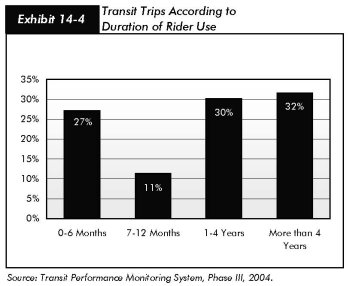
Duration of Use
Thirty-two percent of the trips in the TPMS Phase III survey were made by passengers who had been using transit for more than 4 years, and 30 percent of the trips were made by passengers who had been using transit for 1 to 4 years. The fact that 62 percent of all trips were made by passengers who had been using transit for more than 1 year suggests that, for these riders, transit is a more efficient choice than an automobile. However, 38 percent of the trips surveyed were made by passengers who had been using transit for less than 1 year, and 27 percent were made by passengers who had been using transit for less than 6 months. This finding indicates that transit is important to a large number of people on a short-term basis (Exhibit 14-4).
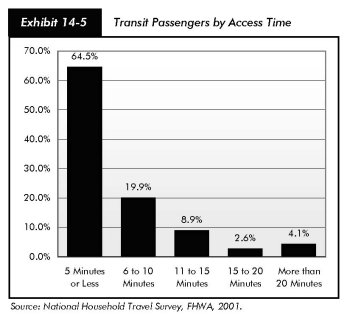
Transit Access and Egress
Transit principally serves those who can access it easily. According to the NHTS, 65 percent of transit passengers using transit as their primary mode of travel were able to access transit within 5 minutes of starting their trip, and 20 percent were able to access transit within 6 to 10 minutes of starting their trip (Exhibit 14-5). Sixty-two percent of these transit passengers were able to reach their final destination within 5 minutes, and 18 percent within 6 to 10 minutes of exiting their transit trip. Walking is the most common way of beginning and ending a transit trip. Of passengers using transit as their primary mode of travel, 87 percent started their trip and 84 percent ended their trip by walking. Six percent of these transit passengers used a car to start their trip, and 3 percent used a car upon their exit. Five percent of these passengers reported that they had started on transit, and 11 percent reported continuing their trip on transit. By comparison, 70 percent of the TPMS trips were made by passengers who walked to transit and 7 percent were continuing a trip that had begun in a car. (Twenty-one percent of TPMS passengers were continuing a trip that had begun on a bus or train.)
Trip Purpose
Work accounts for the largest percentage of transit trips. The NHTS reported that 37 percent of all passengers using transit as their principal mode of travel were on their way to or from work or work-related business. Transit also enables people to manage their personal or family business (11 percent), to shop (13 percent), to engage in social or recreational activities (11 percent), or to visit friends (8 percent). It also helps people pursue educational opportunities and attend places of worship (13 percent) and to obtain medical or dental services (5 percent) (Exhibit 14-6). Work trips account for a larger percentage of transit trips in more populous areas—40 percent in areas with populations of 500,000 or more compared with 19 percent in areas with populations under 500,000.
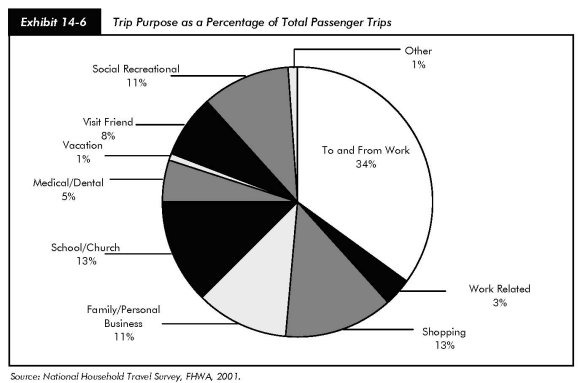
School and church trips combined account for a higher percentage of transit trips in less populous areas—20 percent in areas with populations under 500,000 compared with 12 percent in areas with populations of 500,000 or more.
TPMS surveys were conducted in areas where a higher percentage of work trips (53 percent) were reported. Sixteen percent of TPMS trips were for school, 11 percent were for shopping, and 20 percent were for other purposes. TPMS found that riders who use transit frequently are more likely to use it to travel to and from work than infrequent riders. Sixty percent of TPMS frequent riders were traveling to or from work, compared with 35 percent of infrequent riders. Infrequent riders are more likely to use transit to shop, attend school, and for other nonwork purposes.
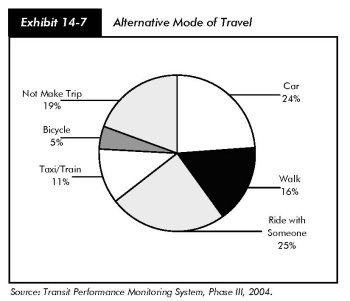
Alternative Mode of Travel
TPMS surveys asked passengers how they would have made their trip if transit had not been available. Sixteen percent of the passengers surveyed would have walked, 11 percent would have taken a taxi or train, and 5 percent would have bicycled. Forty-nine percent responded that they would have taken a car, of which half would have driven themselves and half would have ridden with someone else. These numbers indicate that transit makes an important contribution to reducing road congestion. The availability of transit was particularly crucial to the 19 percent who reported that without transit they would not have made the trip at all. This finding underscores the reliance of a significant number of TPMS passengers on transit for basic mobility services (Exhibit 14-7).
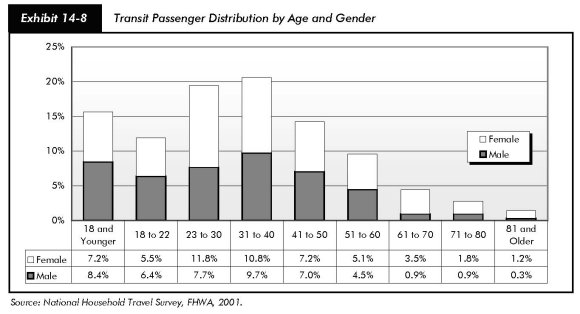
Gender and Age
According to the NHTS, a larger percentage of transit riders are women (54 percent) than men (46 percent). The same was true for TPMS trips. According to the NHTS, females make up a larger percentage of transit passengers for all age groups, except for riders 22 years or younger for which a slightly higher percentage of passengers are males. Most transit riders are of working age. Seventy-five percent of all transit passengers are between the ages of 23 and 60. (Fifty percent are between the ages of 23 and 40, and 25 percent are between the ages of 41 and 60). Nine percent of all riders are 61 years or older. Seventy-five percent of these older riders are females (Exhibit 14-8).
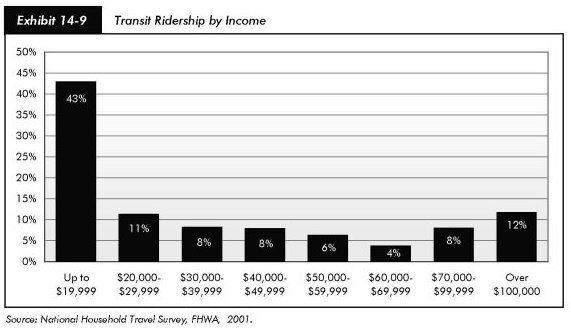
Income Distribution
The availability of transit is particularly important to people with limited incomes. Based on the NHTS, 43 percent of all transit users live in households with incomes of less than $20,000, indicating that many riders are from households at or below the poverty level. (The U.S. Bureau of the Census reported a 2002 poverty-level income threshold for a family of four with two children of $18,244, and for a family of one under the age of 65 years of $9,359.) Transit also serves the affluent. Twelve percent of transit users come from households with annual incomes of $100,000 or more (Exhibit 14-9).
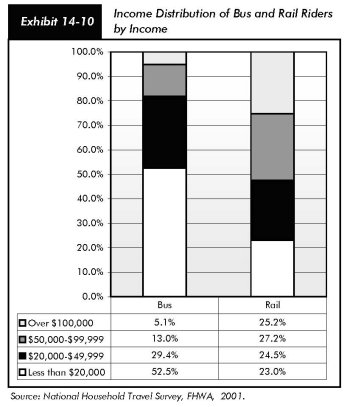
Bus service is relatively more important than rail service at lower income levels. Fifty-two percent of all bus trips were made by people with annual household incomes of less than $20,000 compared with 5 percent by people with annual household incomes of $100,000 or more. Rail service is equally important to both groups. Twenty-three percent of all rail trips were made by people with annual household incomes of less than $20,000, compared with 25 percent by people with annual household incomes of over $100,000 (Exhibit 14-10).
TPMS surveys were undertaken in areas where people with limited incomes make a larger percentage of transit trips. Forty-six percent of TPMS trips were by people with annual household incomes of $20,000 or less, and 13 percent by people with annual household incomes of $20,000 to $39,900. Only 13 percent of TPMS trips were by people with annual household incomes of $60,000 or more. TPMS found that low-income riders are more reliant on bus services than high-income earners and that rail attracts more riders from higher-income groups.
User Benefits of Transit
As discussed in the beginning of this chapter, transit provides a wide range of benefits to communities, including access to employment and a wide range of community resources and services. Transit also contributes to a healthier environment by improving air quality, reducing oil consumption, and providing better land-use policies. It also helps to expand business development and work opportunities.
Data gathered through TPMS provide insight into how transit provides one or more of three basic benefits to its riders. Transit may provide basic mobility to a rider who has no other means of transportation available; it may contribute to location efficiency by providing service that is easily accessible and more convenient than a car in densely developed areas; or it may provide competitive travel times, particularly during peak working hours, by offering a service on dedicated guideways that is equal to or faster than travel by car on roads. People traveling on roads in areas with strong transit systems also benefit from less congested roads, i.e., people who would otherwise be using the roads in private vehicles are traveling by transit. Note that information on the percentage of people traveling by car, who benefit from reduced road congestion as a result of transit services, is not captured by this analysis.
To determine how transit benefited riders, the TPMS Phase III passengers surveyed were asked to respond either "yes" or "no" to the following questions:
- Did they have access to a car at the time the trip was made?
- Were they going to work?
- Would they have made the trip if transit had not been available?
Each trip was then classified into one of the eight following groups and assigned a public benefit. In most cases (68 percent), each transit trip provided more than one benefit (Exhibit 14-11). (The same analysis was undertaken for TPMS Phases I and II and is presented in the 2002 edition of this report. Note that the classification used to assign trips to each benefit for this analysis is slightly different from the one used in Chapter 15 for the analysis of these benefits by time of day. These differences exist because the analysis presented here is based on TPMS data and the analysis in Chapter 15 is based on NHTS data.)
| Public Benefit | Car | Work | Make Trip Without Transit |
|---|---|---|---|
| Competitive Travel Time/Reduced Congestion | Yes | Yes | Yes |
| Competitive Travel Time/Reduced Congestion | Yes | Yes | No |
| Competitive Travel Time/Reduced Congestion & Location Efficiency | Yes | No | Yes |
| Competitive Travel Time/Reduced Congestion & Location Efficiency | Yes | No | No |
| Mobility & Competitive Travel Time/Reduced Congestion | No | Yes | Yes |
| Mobility | No | Yes | No |
| Mobility & Location Efficiency | No | No | Yes |
| Mobility & Location Efficiency | No | No | No |
- Thirty-five percent of all TPMS Phase III transit trips provided mobility and location-efficiency benefits to passengers without cars who chose to make a nonwork trip by transit because they lived in an area with convenient, highly accessible transit services. (Compared with 36 percent in Phases I and II.) Sixty-two percent of these passengers said they still would have made their trip if transit had not been available, and 38 percent said they would not have (Exhibit 14-12). People who stated that they would have chosen to make the trip if transit had not been available would have taken a car, walked, rode with someone else, taken a taxi, or bicycled.
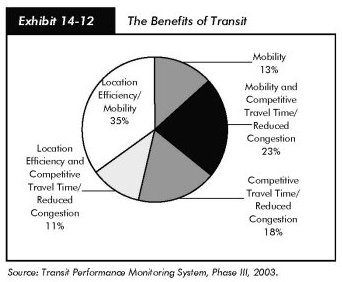
- Twenty-three percent of all Phase III trips provided basic mobility to passengers without access to a car who were traveling to work. (Compared with 21 percent for Phases I and II.) These people reported that they would have made their work trip even if transit had not been available. Transit provided these people with a travel time as competitive or better than traveling on the road in a private car. The fact that these passengers were not traveling in cars led to reduced road congestion.
- Eighteen percent of all Phase III trips offered competitive travel times for passengers and contributed to reduced road congestion. (Compared with 18 percent in Phases I and II.) These were work trips made by people with access to cars. Sixty-two percent of these people stated that they would have made the trip if transit had not been available, and 38 percent stated that they would not have made the trip if transit were not available. This measure may overstate transit's contribution to reducing road congestion because all work trips are not made at peak travel times.
- Eleven percent of all Phase III trips provided location efficiency and competitive travel times. (Compared with 11 percent in Phases I and II.) These trips were made because the passenger lived in an area highly accessible to transit. In these cases, the passenger traveling had access to a car, but chose to make a non-work trip on transit. Seventy-five percent of these people would have chosen to make the trip without transit, and 25 percent would have chosen not to make the trip without transit. Transit trips also provided reduced road congestion to people traveling by car at the same time in the same corridor.
- Thirteen percent of all Phase III trips provided basic mobility only. (Compared with 13 percent in Phases I and II.) These passengers reported that they had no access to a car, were making a work trip, and would not have been able to make the trip if transit services had not been available.
Longitudinal Survey of Benefits of Transit
In addition to immediate benefits, transit provides lifetime benefits to people even when they are no longer passengers. In 2003, TPMS conducted a telephone survey of people who had participated in an onboard survey three years earlier in Buffalo. The purpose of this longitudinal survey was to obtain information on the benefits that these passengers had received from transit over the three years between surveys and over their lifetimes.
The subset of passengers participating in the 2003 longitudinal survey was reasonably comparable to the group of passengers who had participated in the original onboard survey. The benefits results for the longitudinal survey represent reasonably accurately the benefits accruing to all riders on the Buffalo system where the 2000 onboard survey was administered.
Forty-seven percent of the participants in the longitudinal survey, who were still riding transit three years after the original onboard survey, reported that their frequency of use was different at the end of the three-year period than it had been at the beginning. Thirty percent of these participants were riding transit less, and 17 percent were riding it more. The reasons for frequency-of-use changes were varied, but typically reflected a change in a participant's life (e.g., a new job, a new car, or a change in their physical condition). None of the riders mentioned changes in service as a reason for a change in their use.
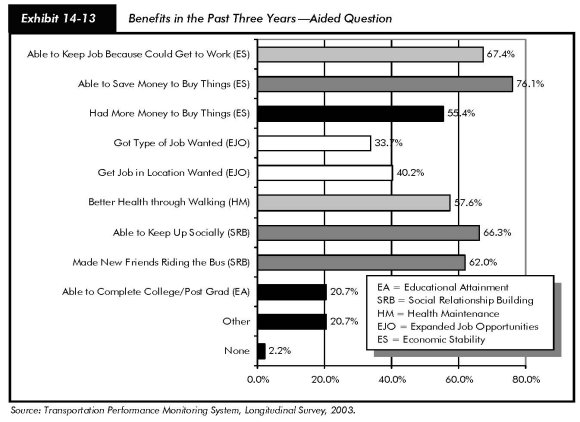
When longitudinal-survey participants who had continued to use transit were posed with an opened-ended question as to whether or not they had benefited from being able to use transit, 84 percent reported that they had. When they were asked if they had received benefits with an aided question, which mentioned specific benefits that they could have received, 98 percent reported that they had received a benefit. The benefits received were organized into the five categories—educational attainment, expanded job opportunities, economic stability, health maintenance, and social relationship building.
In response to the aided question, between 55 and 76 percent of the longitudinal-survey participants who had continued to use transit cited each of the three economic stability benefits related to keeping a job and saving/having money to buy things. Nearly two-thirds of these continued-use participants cited each of the two social relationship benefits of making friends and keeping up socially. Health maintenance through walking was also a benefit for 58 percent of these continued-use respondents (Exhibit 14-13).
When all longitudinal-survey participants, including those who had not continued to ride transit, were asked an open-ended question about the benefits that they had received transit over their lifetimes, 81 percent reported that they had received at least one benefit.
Over one-fourth of the longitudinal-survey participants gave responses that were categorized as providing "Expanded Job Opportunities" (Exhibit 14-14). Most people who indicated that they had received an "Expanded Job Opportunities" benefit did not own a private vehicle and would have found it impossible or much more difficult to take advantage of work opportunities without transit. Transit not only helped these individuals to find and accept better jobs in the first place, but also provided a means of keeping these jobs over the longer term.
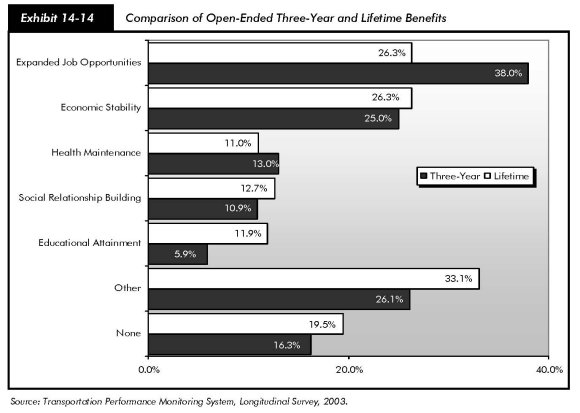
One-quarter of the longitudinal-survey participants gave responses that were categorized as providing "Economic Stability." Nearly 75 percent of the longitudinal-survey participants who said that transit had contributed to their economic stability at some point during their life also reported that they depended on transit to get to and from work. These individuals were often of prime working age.
One in eight of the longitudinal-survey participants provided answers that were categorized as "Educational Attainment." While many participants had depended on transit to attend school, many had stopped using transit once they had graduated or completed their training. Twenty-three percent of the longitudinal-survey participants who were no longer riding transit provided answers indicating that they had received an educational benefit from riding transit. By comparison, 12 percent of all longitudinal-survey participants and 9 percent of participants still riding indicated that they had received an educational benefit.
Other responses by participants were categorized as "Social Relationship Building" and "Health Maintenance" benefits. Eleven percent of the participants provided answers that were categorized as providing "Health Maintenance," and 13 percent provided answers that were categorized as "Social Relationship Building." These benefits were received by participants who were of working age or older, a high percentage of whom were over the age of 64.