

- Summary
- Highway System Characteristics
- Highways by Ownership
- Highways by Purpose
- Review of Functional Classification Concepts
- Functional Classification Data
- Highway Travel
- Intelligent Transportation Systems
- Bridge System Characteristics
- Bridges by Owner
- Bridges by Functional Classification
- Transit System Characteristics
- Transit Services, and Jurisdiction, and Use
- Transit Fleet and Infrastructure
- System Network (Urban Route Miles)
- System Capacity
- Passenger Travel
- Vehicle Occupancy
- Rural Transit Systems (Section 5311 Providers)
- Transit System Characteristics for Americans with Disabilities and the Elderly (Section 5310 Providers)
- Transit Services, and Jurisdiction, and Use
Transit System Characteristics
Transit Services, Jurisdiction, and Use
Prior to 1960, the Federal Government was not focused on public transit issues. But, by the end of the 1950s, it was becoming clear to all levels of government that developing and sustaining transit services was an important national, as well as local, concern. Studies undertaken by State and local governments in major cities, including Chicago, Philadelphia, San Francisco, and Washington, highlighted the need for creating or improving transit facilities and programs. Since the 1960s, the ownership and operation of most transit systems in the United States have been transferred from private to public hands. This transformation occurred with the large influx of Federal funding following the passage of the Urban Mass Transportation Act of 1964, which specified that Federal funds for transit were to be given to local or metropolitan-level public agencies, and not to private firms or State governments. The Act also required local governments to contribute local matching funds for the provision of transit services in order to receive Federal aid.
As local governments have come to understand the regional nature of transportation problems, metropolitan planning organizations have assumed more responsibility for formulating local transit policy. Regional planning allows local officials to consider the effects of the transportation system on other characteristics of the urban environment, including land use, the location and creation of employment, and accessibility, i.e., the ease with which local residents and visitors can reach locations for business, medical, educational, and recreational purposes. It also allows local decision makers to choose the best way to invest their scarce transportation resources, including choosing among modes.
Transit operations have increasingly become the subject of State initiatives in the form of financial support and performance oversight, as well as outright ownership and operation of services. Five states—Connecticut, Delaware, Maryland, New Jersey, and Rhode Island—own and operate transit systems. Ballot initiatives dedicating specific taxes to transit were passed in 10 States—Arizona, California, Colorado, Florida, Michigan, Nevada, Ohio, South Carolina, Utah, and Washington—between 2000 and 2002.
A transit provider can be an independent agency with either an elected or appointed Board of Governors. It may also be the unit of a regional transportation agency, or a State, county, or city government. Services may be provided directly or under contract. Transit services must be open to the general public, i.e., to anyone who pays the proscribed fare. They must also meet accessibility requirements, such as the Americans with Disabilities Act of 1990 (ADA).
In 2002, there were 610 providers of transit services in both large and small urbanized areas, compared with 614 in 2000. Of these 610 providers, 538 were public agencies. The remaining 72 providers were private providers under contract to public agencies, private brokerage systems, or agencies in special categories such as private entities providing dial-a-ride services. In 2000, the most recent year for which information is available, there were 1,215 operators serving rural areas. In spring 2004, it was estimated that there were 4,836 providers of special services to the elderly and disabled in both urban and rural areas.
Increases in population coupled with investment in transit infrastructure have led to transit ridership increases. The total number of miles traveled on transit, or passenger miles traveled (PMT), increased from 35.1 billion miles in 1980 to 45.9 billion miles in 2002. PMT growth was particularly strong in the latter half of the 1990s, increasing at an average annual rate of 3.5 percent between 1995 and 2000. By comparison PMT was virtually the same in 1995 as in 1990 and increased at a much more gradual pace (1.7 percent on average annually) between 1980 and 1990. The fast growth in transit use in the latter part of the 1990s most likely resulted from the strong economy and, in part, from the expansion of commuter benefits, including transit benefits and parking cash-out programs. The introduction of fares cards in New York City in 1997, which enabled transfers, and the introduction of volume discounts and unlimited-ride one-day, 7 day, and 30-day passes in New York City in 1999, also very likely contributed to ridership increases. Nationwide PMT increased in between 2000 and 2001, falling back to 2000 levels in 2002, reflecting a decrease in ridership in New York City as a result of the terrorist attacks on September 11, 2001.
Transit Fleet and Infrastructure
The Nation's transit system continues to grow. In 2002, urban transit systems operated 114,564 vehicles, of which 87,295 were in urbanized areas of more than 1 million people and 27,269 were in urbanized areas under 1 million. In 2000, the most recent year for which information is available and as reported in the last edition of this report, there were 19,185 rural vehicles, i.e., vehicles serving rural areas operated by agencies receiving FTA funds. FTA estimates that there are currently (2004) 37,720 special service vehicles, of which 16,219 were funded by FTA. (No estimate of special service vehicles is available for 2002.) In 2002, transit providers operated 10,722 miles of track and served 2,862 stations, compared with 10,572 miles of track and 2,825 stations in 2000. Between 2000 and 2002, the number of urban transit vehicles increased by 7.7 percent, track mileage grew by 1.4 percent, and the number of stations increased by 1.3 percent. There were also 769 maintenance facilities in urban areas, compared with 759 in 2000, an increase of 1.3 percent [Exhibit 2-18].
| Q. | What is demand response? |
| A. | Demand response is a transit service composed of passenger cars, vans, or small buses dispatched directly in response to requests for service. Demand response vehicles do not operate over fixed routes or to fixed schedules except on a temporary basis to satisfy a special need. Typically, the vehicle may be dispatched to pick up several passengers at different locations before taking them to their respective destinations. |
| Areas Over 1 Million | Areas Under 1 Million1 | Total | |
|---|---|---|---|
| Vehicles | |||
| Buses | 49,159 | 19,259 | 68,418 |
| Heavy Rail | 10,946 | 0 | 10,946 |
| Light Rail | 1,373 | 84 | 1,457 |
| Self-Propelled Commuter Rail | 2,383 | 0 | 2,383 |
| Commuter Rail Trailers | 2,838 | 78 | 2,916 |
| Commuter Rail Locomotives | 624 | 68 | 692 |
| Vans | 13,602 | 6,165 | 19,767 |
| Other (including Ferryboats) | 6,370 | 1,615 | 7,985 |
| Vehicle Subtotal | 87,295 | 27,269 | 114,564 |
| Rural Service Vehicles 2 | 0 | 19,185 | 19,185 |
| Special Service Vehicles 3 | 10,107 | 27,613 | 37,720 |
| Total Active Vehicles | 97,402 | 74,067 | 171,469 |
| Infrastructure | |||
| Track Mileage | |||
| Heavy Rail | 2,179 | 0 | 2,179 |
| Commuter Rail | 7,070 | 283 | 7,353 |
| Light Rail | 1,052 | 61 | 1,114 |
| Other Rail 4 | 23 | 53 | 76 |
| Total Track Mileage | 10,325 | 397 | 10,722 |
| Stations | |||
| Heavy Rail | 1,017 | 0 | 1,017 |
| Commuter Rail | 1,138 | 18 | 1,156 |
| Light Rail | 572 | 68 | 640 |
| Other Rail 4 | 36 | 13 | 49 |
| Total Transit Rail Stations | 2,763 | 99 | 2,862 |
| Maintenance Facilities5 | |||
| Heavy Rail | 53 | 0 | 53 |
| Commuter Rail | 62 | 0 | 62 |
| Light Rail | 27 | 5 | 32 |
| Ferryboat | 6 | 1 | 7 |
| Buses | 296 | 219 | 516 |
| Demand Response | 28 | 63 | 91 |
| Other Rail 4 | 3 | 5 | 8 |
| Total Urban Maintenance Facilities | 476 | 293 | 769 |
| Rural Maintenance Facilities 2 | 510 | 510 | |
| Total Maintenance Facilities | 476 | 803 | 1,279 |
2 Owned by operators receiving funding from FTA as directed by 49USC Section 5311. These funds are for transit services in areas with populations of less than 50,000. (Section 5311 Status of Rural Public Transportation 2000, CTAA, April 2001.)
3 FTA, Fiscal Year Trends Report on the Use of Section 5310 Elderly and Persons with Disabilities Program Funds, 2002. FTA funded 16,219 of these vehicles.
4 Includes Alaska Railroad which was not reported to the NTD in 2000.
5 Includes owned and leased facilities; directly operated service only.
System Network (Urban Route Miles)
The number of the Nation's transit directional route miles is a measure of the coverage or the extensiveness of the U.S. transit system. Directional route miles are counted for vehicles traveling in a particular direction. They measure the distance covered by a transit route independent of the number of vehicles that serve that route. When routes overlap, the mileage is counted separately for each route. Routes may be along fixed guideways (as in the case of rail modes) or separated bus guideways, or they may share city streets with other vehicles (as with most bus routes).
In the United States in 2002, there were 235,304 transit directional route miles (route miles), of which 225,820 were provided by bus modes and 9,484 by rail modes. Total route miles increased at an average annual rate of 2.1 percent between 1993 and 2002 and 6.9 percent between 2000 and 2002.
Changes in total route miles are driven almost exclusively by changes in bus route miles, which, in 2002, accounted for 96 percent of total route mileage. The National Transit Database (NTD) reports that route miles for buses increased rapidly between 2000 and 2002 at an average annual rate of 7.1 percent. Light rail route miles exhibited the most rapid growth between 1993 and 2002, at an average annual rate of 6.7 percent, and between 2000 and 2002, at an average annual rate of 7.2 percent. The rapid pace in growth of light rail route miles reflects new and extensions to existing New Starts rail systems that have become operational during this period. Route miles for remaining transit modes have also increased, although less rapidly. Commuter rail route miles increased at an average annual rate of 1.8 percent between 1993 and 2002, and trolleybus route miles by 1.6 percent. Heavy rail and ferryboat route miles each increased at an average annual rate of 0.9 percent over the same period. Route miles are not collected for demand response, vanpool, jitney, and publico services, since these transit modes do not travel along specific predetermined routes [Exhibit 2-19]. [Publico is a jitney service that operates in Puerto Rico. See Q & A on page 2-26.]
| Q. | Why are directional route miles higher for nonrail modes than they were in previous editions of this report? |
| A. | Directional route miles for bus and ferryboat services performed under contract were not included in earlier editions of this report. These route miles are now included. |
| 1993 | 1995 | 1997 | 1999 | 2000 | 2002 | Average Annual Rate of Change |
||
|---|---|---|---|---|---|---|---|---|
| 2002/1993 | 2002/2000 | |||||||
| Rail | 7,888 | 8,211 | 8,602 | 9,170 | 9,222 | 9,484 | 2.1% | 1.4% |
| Commuter Rail1 | 5,875 | 6,162 | 6,393 | 6,802 | 6,802 | 6,923 | 1.8% | 0.9% |
| Heavy Rail | 1,452 | 1,458 | 1,527 | 1,540 | 1,558 | 1,572 | 0.9% | 0.5% |
| Light Rail | 537 | 568 | 659 | 802 | 834 | 960 | 6.7% | 7.2% |
| Other Rail2 | 24 | 24 | 24 | 27 | 29 | 30 | 2.5% | 1.6% |
| Nonrail3 | 187,215 | 187,757 | 185,164 | 195,984 | 196,858 | 225,820 | 2.1% | 7.1% |
| Bus | 186,334 | 186,856 | 184,248 | 195,022 | 195,884 | 224,838 | 2.1% | 7.1% |
| Ferryboat | 476 | 490 | 496 | 533 | 505 | 513 | 0.9% | 0.8% |
| Trolleybus | 405 | 412 | 420 | 430 | 469 | 468 | 1.6% | -0.1% |
| Total | 195,102 | 195,968 | 193,766 | 205,154 | 206,080 | 235,304 | 2.1% | 6.9% |
| Percent Nonrail | 96.0% | 95.8% | 95.6% | 95.5% | 95.5% | 96.0% | ||
2 Automated guideway, inclined plane, cable car, and monorail.
3 Excludes jitney, publico, and vanpool.
System Capacity
The Nation's transit system's capacity is measured with capacity-equivalent vehicle revenue miles (VRM). Capacity-equivalent VRM are a measure of the distance traveled by transit vehicles in revenue service, adjusted by the passenger-carrying capacity of each transit vehicle type, with the average passenger-carrying capacity of buses representing the baseline.
VRM, unadjusted by passenger-carrying capacity, are reported in Exhibit 2-20. These numbers are of interest because they show the actual number of miles traveled by each mode in revenue service. Unadjusted VRM for each mode are multiplied by a capacity-equivalent factor in order to calculate capacity-equivalent VRM. Rail's share of total unadjusted transit VRM remained relatively constant between 1993 and 2002, ranging between 27 and 28 percent. As subsequent paragraphs will show, the share of VRM on rail modes, adjusted for capacity equivalency, are considerably higher than the share of VRM on rail modes unadjusted for capacity equivalency. The share of unadjusted VRM provided by bus services has declined from 61 percent in 1993 to 54 percent in 2002.
| (Millions) | 1993 | 1995 | 1997 | 1999 | 2000 | 2002 |
|---|---|---|---|---|---|---|
| Rail | 737 | 775 | 811 | 849 | 880 | 925 |
| Commuter Rail 1 | 203 | 218 | 230 | 243 | 248 | 259 |
| Heavy Rail | 505 | 522 | 540 | 561 | 578 | 603 |
| Light Rail | 27 | 34 | 40 | 42 | 51 | 60 |
| Other Rail 2 | 2 | 2 | 2 | 2 | 2 | 2 |
| Nonrail | 1,855 | 1,957 | 2,042 | 2,257 | 2,322 | 2,502 |
| Bus | 1,578 | 1,591 | 1,606 | 1,719 | 1,764 | 1,864 |
| Demand Response | 243 | 297 | 350 | 418 | 452 | 525 |
| Ferryboat | 2 | 2 | 2 | 2 | 2 | 3 |
| Trolleybus | 13 | 13 | 13 | 14 | 14 | 13 |
| Vanpool | 19 | 22 | 40 | 60 | 62 | 71 |
| Other Nonrail 3 | 0 | 31 | 31 | 44 | 28 | 26 |
| Total | 2,592 | 2,732 | 2,853 | 3,106 | 3,202 | 3,427 |
| Percent Rail | 28.4% | 28.4% | 28.4% | 27.3% | 27.5% | 27.0% |
2 Automated guideway, inclined plane, cable car, and monorail.
3 Publico and jitney.
The capacity-equivalent factors used in earlier reports and the resulting capacity-equivalent VRM have been revised. New capacity-equivalent factors are equal to the ratio of the average full-seating and full-standing capacities of vehicles in active revenue service for each transit mode to the average full-seating and full-standing capacity of all bus vehicles in active revenue service as reported by the NTD for each year from 2000 to 2002. For vehicles in service that prohibit standing, often the case with commuter rail, standing capacity is assumed to be 0. These revised capacity-equivalent factors are shown in Exhibit 2-21.

| Base = Average Bus Capacity | |||
|---|---|---|---|
| Automated Guideway | 1.43 | Jitney | 0.57 |
| Alaska Rail | 0.40 | Light Rail | 2.52 |
| Cable Car | 0.87 | Bus | 1.00 |
| Commuter Rail | 2.33 | Monorail | 1.85 |
| Demand Response | 0.18 | Publico | 0.26 |
| Ferryboat | 12.05 | Trolleybus | 1.46 |
| Heavy Rail | 2.36 | Vanpool | 0.19 |
| Inclined Plane | 0.84 | ||
Capacity-equivalent VRM reported in Exhibit 2-22 are based on the new capacity-equivalent factors. In 2002, all transit modes combined provided the equivalent of 4.2 billion miles of bus service loaded to full-seating and full-standing capacity. Slightly more than half of these capacity-equivalent VRM were provided by rail modes of service, and slightly less than half by nonrail modes. Total capacity-equivalent VRM increased at an average annual rate of 2.4 percent between 1993 and 2002 and 2.8 percent between 2000 and 2002. Between 1993 and 2002, capacity-equivalent VRM grew most rapidly for vanpool, at an average annual rate of 17.9 percent, although vanpool accounts for only a very small percentage of total transit services. Capacity-equivalent VRM for light rail also grew rapidly, at an average annual rate of 9.3 percent between 1993 and 2002 and 8.0 percent between 2000 and 2002, reflecting New Starts openings and extensions. Capacity-equivalent VRM for demand response also exhibited substantial growth, increasing at an average annual rate of 8.9 percent between 1993 and 2002 and 7.7 percent between 2000 and 2002, as transit agencies continued to fulfill their responsibilities under the ADA.
| (Millions) | 1993 | 1995 | 1997 | 1999 | 2000 | 2002 | Average Annual Rate of Change |
|
|---|---|---|---|---|---|---|---|---|
| 2002/1993 | 2002/2000 | |||||||
| Rail | 1,736 | 1,827 | 1,912 | 2,013 | 2,075 | 2,182 | 2.6% | 2.6% |
| Commuter Rail 1 | 474 | 507 | 535 | 567 | 578 | 604 | 2.7% | 2.2% |
| Heavy Rail | 1,192 | 1,231 | 1,274 | 1,324 | 1,365 | 1,424 | 2.0% | 2.2% |
| Light Rail | 68 | 85 | 100 | 119 | 130 | 151 | 9.3% | 8.0% |
| Other Rail 2 | 2 | 2 | 3 | 3 | 3 | 3 | 4.9% | 3.3% |
| Nonrail | 1,669 | 1,699 | 1,728 | 1,867 | 1,914 | 2,030 | 2.2% | 3.0% |
| Bus | 1,578 | 1,591 | 1,606 | 1,719 | 1,764 | 1,864 | 1.9% | 2.8% |
| Demand Response | 44 | 54 | 63 | 75 | 81 | 95 | 8.9% | 7.7% |
| Ferryboat | 24 | 23 | 24 | 30 | 30 | 32 | 3.2% | 4.1% |
| Trolleybus | 19 | 19 | 20 | 20 | 20 | 19 | 0.2% | -2.3% |
| Vanpool | 4 | 4 | 8 | 11 | 12 | 13 | 17.9% | 7.0% |
| Other Nonrail 3 | 0 | 8 | 8 | 11 | 7 | 7 | -2.6% | -3.8% |
| Total | 3,405 | 3,526 | 3,640 | 3,880 | 3,989 | 4,213 | 2.4% | 2.8% |
| Percent Rail | 51.0% | 51.8% | 52.5% | 51.9% | 52.0% | 51.8% | ||
2 Automated guideway, inclined plane, cable car, and monorail.
3 Jitney and publico. Capacity-equivalent VRM were 16.7 thousand in 1993.
Capacity-equivalent VRM for bus, commuter rail, and heavy rail, which combined account for the bulk of transit services, increased more slowly between 1993 and 2002, at average annual rates of 1.9 percent, 2.7 percent, and 2.0 percent, respectively.
| Q. | What is a jitney service, and what is a publico service? |
| A. | Jitney is composed of passenger cars or vans operating on fixed routes, with some minor deviations. Jitney services operate without a fixed schedule or stops and as warranted by demand. There is only one jitney service in the United States, which has been operating in Long Beach,California, since 1914. A newspaper reporter coined the name "jitney" because the service charged a jitney or five cents a ride. At that time, independent operators provided jitney services using a wide range of automobiles. In 1914, the first ordinance regulating jitney bus traffic was adopted. Publico is the name of the jitney service that operates in San Juan, Puerto Rico. Publico is composed of passenger vans or small buses operating with fixed routes, but not fixed schedules. Publico vehicles are privately owned, unsubsidized, but regulated through a public service commission or state or local government. Vehicle capacities vary from eight to 30 or more passengers. Vehicles may be owned or leased by the operator. |
Passenger Travel
As previously mentioned in the beginning of this chapter, PMT, or the total number of miles traveled by passengers in transit vehicles, measures the Nation's transit use. Percentage changes in PMT closely follow percentage changes in unlinked trips. Exhibit 2-23 provides PMT for selected years between 1993 and 2002. PMT increased at an average annual rate of 2.7 percent between 1993 and 2002 and 0.9 percent between 2000 and 2002. PMT on all rail modes combined increased at an average annual rate of 3.6 percent between 1993 and 2002, more than double the 1.7 percent average annual growth rate on all nonrail modes combined. Starting from an extremely low level of ridership, PMT on vanpool grew the mostly rapidly between 1993 and 2002, at an average annual rate of 11.1 percent. PMT on vanpool remains a tiny fraction of the Nation's total. PMT on light rail also grew at a fast pace, at an average annual rate of 8.2 percent between 1993 and 2002, as new light rail systems and extensions were opened, but slowed to an average annual rate of 3.4 percent between 2000 and 2002. PMT on demand response systems also grew briskly at an average annual rate of 5.9 percent between 1993 and 2002. In addition to serving disabled persons, demand response services are effective at meeting ridership demand in sparsely populated areas where fixed route service does not make economic sense. PMT on commuter rail increased moderately at an average annual rate of 3.6 percent between 1993 and 2002, but more slowly at 0.5 percent between 2000 and 2002.
| Q. | When are vanpools considered to be transit service? |
| A. | Vanpools that are operated, owned, or leased by a public entity are considered to be transit. They must comply with transit rules, including the ADA provisions and be open to the public. |
| 1993 | 1995 | 1997 | 1999 | 2000 | 2002 | Average Annual Rate of Change |
||
|---|---|---|---|---|---|---|---|---|
| 2002/1993 | 2002/2000 | |||||||
| Rail | 17,867 | 19,682 | 21,138 | 22,875 | 24,603 | 24,616 | 3.6% | 0.0% |
| Commuter Rail | 6,912 | 8,244 | 8,037 | 8,764 | 9,400 | 9,500 | 3.6% | 0.5% |
| Heavy Rail | 10,231 | 10,559 | 12,056 | 12,902 | 13,844 | 13,663 | 3.3% | -0.7% |
| Light Rail | 704 | 859 | 1,024 | 1,190 | 1,340 | 1,432 | 8.2% | 3.4% |
| Other Rail 1 | 20 | 21 | 21 | 19 | 20 | 20 | -0.1% | 0.1% |
| Nonrail | 18,354 | 18,288 | 19,042 | 20,404 | 20,498 | 21,328 | 1.7% | 2.0% |
| Bus | 17,360 | 17,024 | 17,509 | 18,684 | 18,807 | 19,527 | 1.3% | 1.9% |
| Demand Response | 389 | 397 | 531 | 559 | 588 | 651 | 5.9% | 5.3% |
| Ferryboat | 240 | 243 | 254 | 295 | 298 | 301 | 2.5% | 0.5% |
| Trolleybus | 188 | 187 | 189 | 186 | 192 | 188 | 0.0% | -1.1% |
| Vanpool | 177 | 185 | 310 | 413 | 407 | 455 | 11.1% | 5.7% |
| Other Nonrail 2 | - | 252 | 249 | 267 | 205 | 206 | -2.8% | 0.1% |
| Total | 36,220 | 37,971 | 40,180 | 43,279 | 45,101 | 45,944 | 2.7% | 0.9% |
| Percent Rail | 49.3% | 51.8% | 52.6% | 52.9% | 54.6% | 53.6% | ||
2 Jitney and Publico. Ninety-eight percent or more are PMT on Publico. Average annual percentage change is between 1995 and 2002.
While PMT on heavy rail also increased moderately at an average annual rate of 3.3 percent between 1993 and 2002, it declined by 0.7 percent on an average annual basis between 2000 and 2002, reflecting a decrease in ridership in New York City following the terrorist attacks on September 11, 2001. If heavy rail is excluded, PMT increased at an average annual rate of 1.6 percent between 2000 and 2002. (Note that PMT on heavy rail increased by 2.4 percent between 2000 and 2001.) Some heavy rail systems, however, had rapid increases in PMT over the 2000 to 2002 period. PMT on the Los Angeles County Metro increased at an average annual rate of 48 percent between 2000 and 2002, reflecting the opening of the North Hollywood extension in 2000. PMT on the Washington Metro Green line increased at an average annual rate of 21 percent between 2000 and 2002, reflecting the opening of a 6.5 mile extension in January 2001. Both projects were supported by FTA's New Starts capital investment program.
| Q. | What affects transit ridership? |
| A. | Transit ridership is measured by PMT or unlinked passenger trips. PMT for each system by mode are calculated as the number of unlinked trips multiplied by an estimate of average trip length. Transit ridership is higher in densely developed areas with more extensive and frequent service and lower in sprawling developments where the service is less extensive and frequent. The largest increases in transit ridership generally come from expanding transit services into areas where there is significant latent ridership demand. Investments that enhance riders' comfort levels, such as benches and shelters at transit stops and walkways with safer pedestrian access, have been found to promote ridership. Riders are attracted by more frequent service, reduced vehicle crowding, and, in some cases, changes in service routes. However, bus ridership may be adversely affected by road congestion. Special programs targeting students, human service agency clientele, and tourists can also build ridership as can the reduction of parking subsidies and provision of transit checks. A statistical analysis by FTA found a positive relationship between changes in employment and transit use, and provided an indication that the level of employment was the most important factor affecting transit use. Research in this area is ongoing, and additional linkages are under examination. |
Vehicle Occupancy
Unadjusted for Vehicle Capacities
Vehicle occupancy, or the average number of passengers that a transit vehicle carries, measures the level of utilization of the transit infrastructure and compares the level of transit use with the level of transit service. Exhibit 2-24 shows average unadjusted vehicle occupancies for transit modes on a mode-by-mode basis. Since the average carrying capacities of the vehicles in each mode are different, differences in these occupancy rates reflect the size of the vehicle and not the extent to which the vehicle is being utilized. Automated guideway, inclined plane, cable car, and monorail have been grouped together as other rail and jitney and Publico as other nonrail.
Average unadjusted vehicle occupancies are not calculated for all rail modes combined or for all nonrail modes combined because the passenger-carrying capacities of vehicles within each mode are not comparable. In 2002, on average a commuter rail vehicle carried 37 passengers, a heavy rail vehicle carried 23 passengers, and a bus carried 11 passengers.
| 1993 | 1995 | 1997 | 1999 | 2000 | 2002 | |
|---|---|---|---|---|---|---|
| Rail | ||||||
| Commuter Rail 1 | 34.0 | 37.9 | 35.0 | 36.0 | 37.9 | 36.7 |
| Heavy Rail | 20.2 | 20.2 | 22.3 | 23.0 | 23.9 | 22.6 |
| Light Rail | 26.1 | 25.3 | 25.7 | 28.1 | 26.1 | 23.9 |
| Other Rail 2 | 11.8 | 10.7 | 9.5 | 8.7 | 8.4 | 8.0 |
| Nonrail | ||||||
| Bus | 11.0 | 10.7 | 10.9 | 10.9 | 10.7 | 10.5 |
| Demand Response | 1.6 | 1.3 | 1.5 | 1.3 | 1.3 | 1.2 |
| Ferryboat | 118.3 | 125.3 | 126.2 | 119.0 | 120.1 | 112.1 |
| Trolleybus | 14.4 | 14.2 | 14.1 | 13.7 | 13.8 | 14.1 |
| Vanpool | 9.2 | 8.3 | 7.7 | 6.9 | 6.6 | 6.4 |
| Other Nonrail 3 | 0.0 | 8.0 | 8.1 | 6.1 | 7.3 | 7.9 |
2 Automated guideway, inclined plane, cable car, and monorail.
3Jitney and publico.
Adjusted for Vehicle Capacities
To provide a better indication of actual capacity utilization, vehicle occupancies can be adjusted to reflect differences in vehicle-carrying capacities among modes by taking the ratio of PMT to capacity-equivalent VRM. This enables the comparison of vehicle occupancy levels across modes. Adjusted vehicle occupancy levels are based on capacity-equivalent VRM and provide the average number of people that a mode would carry if it were operating vehicles equal to the size of the average U.S. bus. Note that these adjusted capacity-equivalent occupancy levels differ from what were reported in previous editions of this report because they have been revised to reflect the revisions in capacity-equivalent factors and capacity-equivalent VRM discussed earlier in this chapter under "System Capacity" on page 2-24. The slight downward adjustment in the estimates of capacity-adjusted vehicle occupancy levels for rail vehicles has resulted from a slight increase in the estimated average adjusted capacity of these vehicles [Exhibit 2-25].

| 1993 | 1995 | 1997 | 1999 | 2000 | 2002 | |
|---|---|---|---|---|---|---|
| Rail | 10.3 | 10.8 | 11.1 | 11.4 | 11.9 | 11.3 |
| Commuter Rail 2 | 14.6 | 16.2 | 15.0 | 15.5 | 16.3 | 15.7 |
| Heavy Rail | 8.6 | 8.6 | 9.5 | 9.7 | 10.1 | 9.6 |
| Light Rail | 10.4 | 10.0 | 10.2 | 10.0 | 10.3 | 9.5 |
| Other Rail 3 | 9.2 | 8.3 | 7.3 | 6.6 | 6.3 | 5.9 |
| Nonrail | 11.0 | 10.8 | 11.0 | 10.9 | 10.7 | 10.5 |
| Bus | 11.0 | 10.7 | 10.9 | 10.9 | 10.7 | 10.5 |
| Demand Response | 8.9 | 7.4 | 8.4 | 7.4 | 7.2 | 6.9 |
| Ferry Boat | 9.8 | 10.4 | 10.5 | 9.9 | 10.0 | 9.3 |
| Trolley Bus | 9.9 | 9.7 | 9.7 | 9.4 | 9.4 | 9.7 |
| Vanpool | 48.6 | 43.6 | 40.7 | 36.3 | 34.7 | 33.9 |
| Other Nonrail 4 | - | 30.8 | 31.0 | 23.3 | 28.0 | 30.3 |
| Total | 10.6 | 10.8 | 11.0 | 11.2 | 11.3 | 10.9 |
2 Includes Alaska Rail.
3 Automated guideway, inclined plane, cable car, and monorail.
4 Jitney and publico.
Between 1993 and 2002, adjusted vehicle occupancy levels remained relatively constant. The adjusted vehicle occupancy for all modes combined was 10.9 passengers in 2002, compared with a high of 11.3 passengers in 2000 and a low of 10.6 passengers in 1993. These occupancy levels show that on average transit vehicles were operating at a capacity equivalent to 11 persons per bus.
Adjusted vehicle occupancy levels for all rail modes combined was 11.3 passengers in 2002, and ranged from a high of 15.7 passengers for commuter rail to a low of 5.9 passengers for other rail modes (automated guideway, inclined plane, cable car, and monorail). The higher adjusted vehicle occupancy level for commuter rail reflects the fact that many commuter rail systems do not allow passengers to stand so that the capacity of commuter rail vehicles is lower in relationship to the capacity of bus vehicles than if standing on all commuter rail systems were allowed. Adjusted vehicle occupancy levels for heavy rail and light rail in 2002 were 9.6 passengers and 9.5 passengers, respectively, slightly lower than in the immediately preceding years.
In 2002, adjusted vehicle occupancy for all nonrail vehicles combined was 10.5 passengers. Vanpool had the highest adjusted vehicle occupancy level in 2002 (33.9 passengers) and demand response systems the lowest (6.9 passengers). Transit agencies are not mandated to provide vanpool services. These services are likely to be made available only when higher occupancy levels are assured. Alternatively, demand response vehicles are generally used either to provide services to the elderly or disabled or to persons in sparsely settled areas. These riders are more likely to have unique trip requirements, making it difficult to operate demand response services at higher occupancy rates. Occupancy levels for both vanpool and demand response services were lower in 2002 than in the preceding years, particularly in comparison with 1993. Bus occupancy remained almost constant between 1993 and 2002, although marginally lower in 2002 than in earlier years—10.5 passengers in 2002, compared with 10.7 passengers in 2000 and 11.0 passengers in 1993.
Rural Transit Systems (Section 5311 Providers)
Rural operators are defined as those providing service outside urbanized areas or to areas with populations of less than 50,000. The information on rural systems presented here is taken from Status of Rural Public Transportation 2000, April 2001, prepared for FTA. These data have not been updated since the last edition of this report. They are based on a 1997 comprehensive listing of U.S. rural transit operators compiled by the Institute for Economic and Social Measurement from State Departments of Transportation, and on surveys conducted by the Community Transportation Association of America (CTAA) for FTA in 1999 and 2000. A total of 108 rural transit operators responded to the 1999 survey and a total of 50 operators responded to the 2000 survey. Although survey respondents provided information covering different 12 month periods, with commencement dates ranging from June 1997 to June 1999, the data were combined for purposes of analysis.
| Q. | How are transit route miles and ridership located in rural areas, but served by an agency that also services an urbanized area, classified? |
| A. | Transit agencies that operate in both urbanized and rural areas report data on their operations for both areas combined. |
In 1997, there were 1,215 rural transit operators. While the number of rural transit providers had remained relatively constant since 1994, the year of the previous survey, fleet sizes expanded dramatically between 1994 and the most recent surveys undertaken in 1999 and 2000. The 150 providers that responded to a question on fleet size had an average fleet size of 17.5 vehicles, compared with an average fleet size of 11 vehicles in 1994, an increase of almost 50 percent. Correspondingly, the median fleet size in the most recent survey increased to 9 vehicles, compared with a median size of 6 vehicles in 1994. Total rural fleet size was estimated to have increased from 12,223 vehicles in 1994 to 19,185 vehicles in the most recent study.
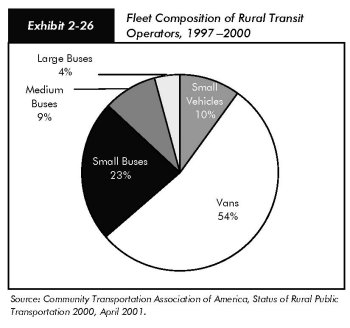
The majority of rural transit operators' vehicles are vans (8 to 15 passengers) and small buses (16 to 24 passengers). According to the most recent survey, vans accounted for 54 percent of the rural fleet and small buses for 23 percent. Small vehicles (fewer than 8 passengers) accounted for 10 percent, medium buses (25 to 35 passengers) for 9 percent, and large buses (more than 35 passengers) for 4 percent [Exhibit 2-26].
Rural systems provide both traditional fixed route and demand response services. About half of all rural transit providers offer various forms of route- or point-deviation services. About 5 percent of rural systems also coordinate van and carpooling programs. Sixty percent of the rural fleet in the most recent survey was lift or ramp-equipped, compared with 40 percent in 1994.
Transit System Characteristics for Americans with Disabilities and the Elderly (Section 5310 Providers)
The ADA is intended to ensure that persons with disabilities have access to the same facilities and services as other Americans, including transit vehicles and facilities. Since its passage in 1990, transit operators have been working toward upgrading their regular vehicle fleets to accommodate the disabled. The ADA requires that public entities that purchase or lease new vehicles for transit purposes make "demonstrated good faith efforts to purchase or lease" vehicles that are accessible to persons with disabilities. Department of Transportation (DOT) regulations provide minimum guidelines and accessibility standards for buses, vans, and heavy, light, and commuter rail vehicles. Commuter rail transportation systems are required to have at least one accessible car per train and all new cars must be accessible. The ADA deems it discriminatory for a public entity providing a fixed route transit service to provide services to disabled individuals that are inferior to those provided to nondisabled individuals. Paratransit must be used to provide persons with disabilities with a level of service comparable to the level provided to nondisabled persons who use a fixed route system.
The percentage of transit vehicles that are ADA compliant is increasing. In 2002, 79 percent of all transit vehicles included in the NTD were ADA compliant, compared with 73 percent in 2000 [Exhibit 2-27].
| Active Vehicles | ADA Compliant Vehicles | ADA as a Percentage of Active Vehicles | |
|---|---|---|---|
| Rail | |||
| Automated Guideway | 49 | 49 | 100% |
| Commuter Rail 1 | 5,991 | 2,923 | 49% |
| Heavy Rail | 10,946 | 10,377 | 95% |
| Inclined Plane | 8 | 6 | 75% |
| Light Rail | 1,457 | 997 | 68% |
| Monorail | 8 | 8 | 100% |
| Total Rail | 18,459 | 14,360 | 78% |
| Nonrail | |||
| Cable Car | 40 | - | 0% |
| Demand Response | 24,926 | 17,347 | 70% |
| Ferryboat | 110 | 94 | 85% |
| Motor Bus | 62,331 | 58,359 | 94% |
| Publico | 2,845 | - | 0% |
| Trolleybus | 656 | 345 | 53% |
| Vanpool | 5,191 | 102 | 2% |
| Total Nonrail | 96,099 | 76,247 | 79% |
| Total | 114,558 | 90,607 | 79% |
In addition to the services provided by urban transit operators, there were about 483,673 private and nonprofit agencies that received FTA Section 5310 funding for the provision of "special" transit services to persons with disabilities and the elderly. A recent survey by the University of Montana, which concluded in the spring of 2004, found that there were 4,836 private and nonprofit agencies that received FTA Section 5310 funding, compared with 3,673 agencies reported by a CTAA survey in 1993. These providers include religious organizations, senior citizen centers, rehabilitation centers, the American Red Cross, nursing homes, community action centers, sheltered workshops, and coordinated human services transportation providers. In FY 2002, approximately 62 percent of these special service providers were in rural areas and 38 percent were in urbanized areas.
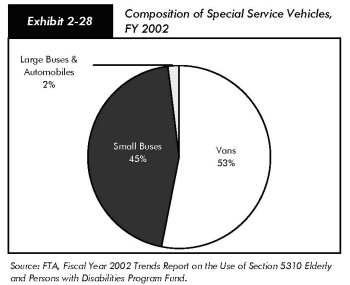
In 2002, there were estimated to be 37,720 special service vehicles of which 16,219 were funded by FTA [Exhibit 2-18]. Data collected by FTA show that vehicle size of special service transportation providers grew between 1993 and FY 2002. By FY 2002, only 53 percent of the special service vehicles purchased were vans (compared with 75 percent in 1993), 45 percent were buses less than 30 feet in length (compared with 13 percent in 1993), and 2 percent were large buses and automobiles (compared with 12 percent in 1993) [Exhibit 2-28]. Approximately 76 percent of the vehicles purchased in FY 2002 were wheelchair accessible, about the same as in the previous few years.
In 2002, 77 percent (or 5,216) of total transit stations were ADA compliant and 23 percent (or 1,555) were not. The ADA requires that new transit facilities and alterations to existing facilities be accessible to the disabled.
Under the ADA, FTA was given responsibility for identifying "key rail stations" and facilitating the accessibility of these stations to disabled persons by July 26, 1993. Although ADA legislation required all key stations to be accessible by July 26, 1993, the DOT ADA regulation at 49 CFR 37.47(c)(2) permitted the FTA Administrator to grant an extension up to July 26, 2020, for stations requiring extraordinarily expensive structural modifications to bring them into compliance. Currently, there are 138 stations under FTA-approved time extensions.
Key rail stations are identified on the basis of the following criteria:
- The number of passengers boarding at the key station exceeds the average number of passengers boarding on the rail system as a whole by at least 15 percent.
- The station is a major point where passengers shift to other transit modes.
- The station is at the end of a rail line, unless it is close to another accessible station.
- The station serves a "major" center of activities, including employment or government centers, institutions of higher education, and major health facilities.
The number of key rail stations that are ADA accessible is increasing. In 2002, 423 of 585 key rail stations, or 77 percent, were ADA accessible. By comparison, in 2000, 52 of 689 key rail stations were accessible; in 1997, 29 of 689 key rail stations were accessible; and, in 1994, 13 of 700 key rail stations were accessible. The number of key rail stations has decreased over the years as a result of rail station closings, renovations, relocations, and merges. There were also instances where initially some stations were double counted because the location of the station connected two different lines in a system.