- Summary
- Highway Operational Performance
- Operational Performance Measures
- Percent of Additional Travel Time
- Annual Hours of Traveler Delay
- Percent of Travel Under Congested Conditions
- Cost of Congestion
- DVMT per Lane Mile
- V/SF Ratio
- Future Research
- System Reliability
- Bottlenecks
- Measuring Performance of ITS Technologies
- Operational Performance Measures
- Transit Operational Performance
- Frequency and Reliability of Services
- Seating Conditions
- Vehicle Utilization—Service Effectiveness
- Average Operating (Passenger-Carrying) Speeds
Transit Operational Performance
The operational performance of transit affects its attractiveness as a means of transportation. People will be more inclined to use transit that is frequent and reliable, travels more rapidly, has adequate seating capacity, and is not too crowded.
Frequency and Reliability of Services
The frequency of transit service varies considerably according to location and time of day. Transit service is more frequent in urban areas and during rush hours, in locations and during times when the demand for transit is highest. Studies have found that transit passengers consider the time spent waiting for a transit vehicle to be less well spent than the time spent traveling in a transit vehicle. The higher the degree of uncertainty in waiting times, the less attractive transit becomes as a means of transportation, and the fewer users it will attract. Further, the less frequently scheduled service is offered, the more important reliability becomes to users.
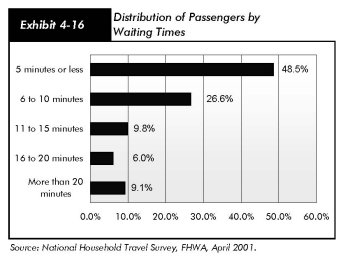
Exhibit 4-16 shows information on waiting times from the 2001 National Household Travel Survey (NHTS) by the FHWA, the most recent nationwide survey of this information. The NHTS found that 49 percent of all passengers who ride transit wait 5 minutes or less and 75 percent wait 10 minutes or less. Nine percent of all passengers wait more than 20 minutes. The relationship between the time spent waiting and frequency of service is not clear. Waiting times of 5 minutes or less are clearly associated with good service that is either frequent or reliably provided according to a schedule. Waiting times of 20 minutes or more indicates that service is likely both infrequent and unreliable. Waiting times of 5 to 10 minutes are most likely consistent with adequate levels of service that are both reasonably frequent and reliable.
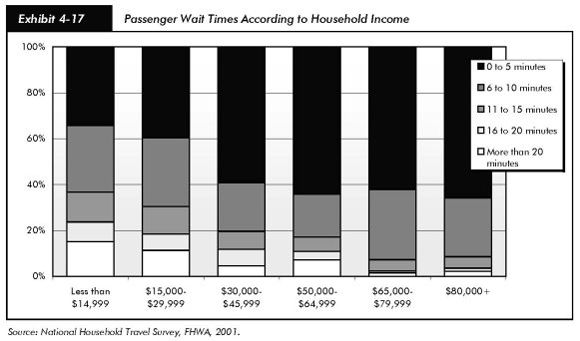
Waiting times are correlated with incomes. Passengers from households with annual incomes of $30,000 or more have a greater chance of waiting 5 minutes or less than passengers from households with incomes of less than $30,000. Passengers from households with incomes of $65,000 or more have an increased chance of waiting 6 to 10 minutes rather than more than 10 minutes (Exhibit 4-17). Higher-income passengers are more likely to be choice riders and choose to ride transit only if the service is frequent and reliable. In contrast, passengers with lower incomes are more likely to use transit for basic mobility, have more limited alternative means of travel, and therefore, to use transit even when the service is not as frequent or reliable as they may prefer.
Seating Conditions
Transit travel conditions are often crowded. Information on crowding was not collected by the 2001 NHTS. The 1995 Nationwide Personal Transportation Survey (NPTS), the FHWA nationwide personal travel survey preceding the NHTS, found that 27.3 percent of the people sampled were unable to find a seat upon boarding a transit vehicle and that 31.3 percent were unable to find seats during rush hours.
Vehicle Utilization—Service Effectiveness
Vehicle utilization is one indicator of service effectiveness that measures how well a service output attracts passengers. Vehicle utilization is calculated as the ratio of the total number of passenger miles traveled annually on each mode to total number of vehicles operated in maximum scheduled service in each mode, adjusted for the passenger-carrying capacity of the mode in relation to the average capacity of the Nation's motor bus fleet. The capacity-equivalent factors used to calculate vehicle utilization are the same as those used to calculate capacity-equivalent vehicle miles in Chapter 2. The absolute values of vehicle utilization provided in Exhibit 4-18 have been revised since the last edition of this report to reflect the revisions made to the capacity-equivalent factors as discussed in Chapter 2. The annual percentage changes in vehicle utilization have remained the same.
| Q. | What is service effectiveness and how can it be measured? |
| A. | Service effectiveness measures the extent to which passengers are using a transit service. In addition to passengers miles traveled per capacity-equivalent vehicle mile, measures of service effectiveness include unlinked passenger trips per vehicle revenue mile, unlinked passenger trips per vehicle revenue hour, annual passenger miles per actual annual vehicle revenue mile, and passenger miles traveled per scheduled vehicle mile. |
| (Thousands) | Nonrail | Rail | ||||||
|---|---|---|---|---|---|---|---|---|
| Bus | Demand Response | Ferry-boat | Trolley-bus | Vanpool | Commuter Rail 1 |
Heavy Rail | Light Rail | |
| 1993 | 394 | 192 | 281 | 267 | 767 | 704 | 530 | 361 |
| 1994 | 393 | 163 | 280 | 271 | 649 | 789 | 546 | 429 |
| 1995 | 391 | 172 | 296 | 264 | 628 | 802 | 561 | 457 |
| 1996 | 392 | 170 | 312 | 256 | 702 | 815 | 601 | 482 |
| 1997 | 401 | 189 | 297 | 258 | 607 | 769 | 620 | 506 |
| 1998 | 393 | 189 | 283 | 242 | 607 | 810 | 619 | 538 |
| 1999 | 397 | 195 | 291 | 249 | 604 | 808 | 654 | 520 |
| 2000 | 393 | 188 | 305 | 257 | 577 | 863 | 697 | 546 |
| 2001 | 397 | 179 | 282 | 276 | 752 | 868 | 699 | 556 |
| 2002 | 390 | 178 | 294 | 246 | 539 | 831 | 675 | 528 |
| Average | 394 | 182 | 292 | 259 | 643 | 806 | 620 | 492 |
Rail vehicle utilization rates have increased since 1993, peaking in 2000 or 2001 and declining slightly in 2002. There is no overall trend in the utilization rates of nonrail vehicles. During the 1993 to 2002 period, bus utilization was at its highest in 1997, demand response vehicle utilization was at its highest in 1999, ferryboat utilization was at its highest in 2000, trolleybus utilization was at its highest in 2001, and vanpool utilization was at its highest in 1993. However, with the exception of ferryboats, the utilization of all non-rail modes, including buses, was lower in 2002 than in 2000 and 1993.
Commuter rail has consistently had the highest vehicle utilization level. In 2002, commuter rail utilization was 831,000 passenger miles per capacity-equivalent vehicle, which is below the 863,000 passenger miles per capacity-equivalent vehicle in 2000, but above the average capacity utilization of 806,000 passengers experienced between 1993 and 2002. Heavy and light rail vehicles had utilization levels of 675,000 and 528,000 passenger miles per capacity-equivalent vehicle in 2002, in both cases below levels in 2000, but well above the averages for the 1993 to 2002 period. In 2002, utilization of buses was 390,000 passenger miles per capacity-equivalent vehicle, slightly below 393,000 passenger miles per capacity-equivalent vehicle in 2000 and the 10-year average of 394,000 passengers. The utilization levels of demand response vehicles, vanpools, ferryboats, and trolleybuses have fluctuated since 1993 with no discernable trend. Among these modes, vanpools have the highest capacity utilization, 539,000 passenger miles per capacity-equivalent vehicle in 2002. The utilization rates for demand response vehicles, ferryboats, and trolleybuses are considerably lower. In 2002, the utilization levels for these modes were respectively, 178,000, 294,000, and 246,000 passenger miles per capacity-equivalent vehicle.
Average Operating (Passenger-Carrying) Speeds
Average operating speed measures the average speed that a passenger will travel on transit; it does not measure the pure operating speeds of transit vehicles. These speeds exclude passenger waiting time and the time spent transferring, but are affected by changes in vehicle dwell times to let off and pick up passengers. The average operating speeds as experienced by passengers on all transit vehicles, and on rail vehicles and nonrail service separately, are provided in Exhibit 4-19. These average speeds are weighted averages of the average speed traveled by each vehicle in operating service in each modal category (rail, nonrail, and total), using passenger miles traveled on each vehicle as the weights. The average speed of each modal category is calculated by dividing annual vehicle revenue miles by annual vehicle revenue hours of each, as reported to the National Transit Database.
| (Miles per Hour) | Rail | Nonrail | Total |
|---|---|---|---|
| 1993 | 26.3 | 13.7 | 19.9 |
| 1994 | 26.7 | 13.8 | 20.4 |
| 1995 | 26.6 | 13.7 | 20.4 |
| 1996 | 26.0 | 13.8 | 20.4 |
| 1997 | 26.1 | 13.8 | 20.3 |
| 1998 | 25.6 | 14.0 | 20.5 |
| 1999 | 25.5 | 14.0 | 20.1 |
| 2000 | 24.9 | 13.7 | 19.6 |
| 2001 | 25.2 | 13.7 | 19.9 |
| 2002 | 25.3 | 13.7 | 19.9 |
| Average | 25.8 | 13.8 | 20.1 |
Average operating speeds as experienced by passengers on transit remained relatively constant between 1993 and 2002. In 2002, the average speed was 19.9 miles per hour, up from 19.6 miles per hour in 2000, and just below the 10-year average of 20.1 miles per hour. The average operating speed as experienced by passengers on rail modes was 25.3 miles per hour in 2002, compared with 24.9 miles per hour in 2000, and a 10 year average of 25.8 miles per hour. The average operating speed of rail modes was highest between 1993 and 1997, ranging between 26.0 to 26.7 miles per hour. The average operating speed of nonrail vehicles, which is affected by traffic, road, and safety conditions, was 13.7 miles per hour in 2002, the same as in 2000 and 2001, and just below the 10-year average of 13.8. The operating speed of rail vehicles has historically been about 12 miles per hour faster than the average operating speed of nonrail transit vehicles(Exhibit 4 19).
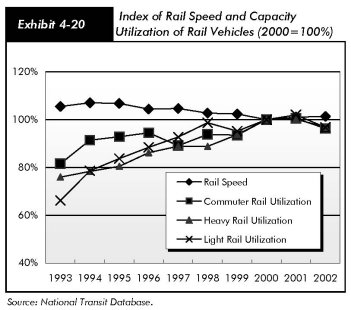
Changes in the capacity utilization of rail vehicles appear to have influenced these vehicles' operating speeds through changes in dwell times. As vehicles become more crowded, they take longer to unload and load, increasing the wait at stations and hence passengers' travel time. Exhibit 4-20 compares an index of rail speed with indexes of the capacity utilization of commuter rail, heavy rail, and light rail vehicles between 1993 and 2002, with 2000 as the base year. As the capacity utilization of these rail vehicles increased between 1993 and 2000, rail speeds decreased. Since 2000, the capacity utilization of these rail modes has fallen slightly and rail speeds have increased slightly.
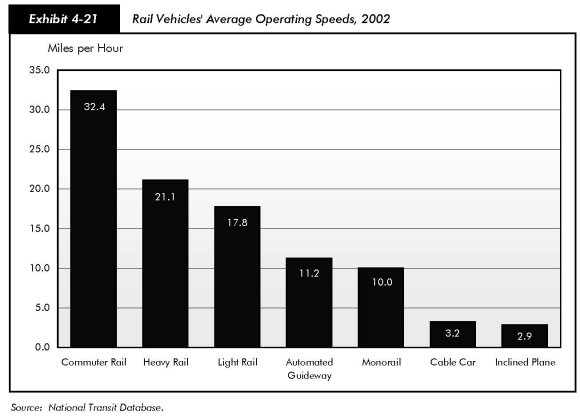
As Exhibit 4-21 shows, the average speed as experienced by passengers on rail vehicles differs considerably according to type of vehicle. Commuter rail provides the fastest service. In 2002, commuter rail provided passengers an average speed of 32.4 miles per hour, an increase over an average of 30.1 miles per hour in 2000. Commuter rail services may be faster than heavy and light rail services because they make fewer stops per distance traveled. In 2002, the average operating speed of heavy rail was 21.1 miles per hour and the average operating speed of light rail was 17.8 miles per hour, both the same as in 2000. In 2002, the average operating speed on automated guideways was 11.2 miles per hour, on monorails 10.0 miles per hour, on cable cars 3.2 miles per hour, and on inclined planes (transit vehicles traveling on track a short distance up a steep hill) 2.9 miles per hour.
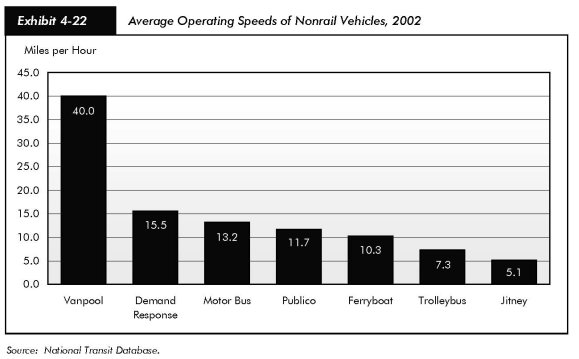
As shown in Exhibit 4-22, the average operating speed as experienced by passengers on nonrail transit vehicles also varies widely. Vanpools, which tend to travel long distances on highways, carry passengers at a faster average operating speed than other nonrail transit vehicles. In 2002, vanpools traveled at an average speed of 40.0 miles per hour. Demand response vehicles carried passengers at an average of 15.5 miles per hour, buses at an average of 13.2 miles per hour, ferryboats at an average of 10.3 miles per hour, and trolleybuses at an average of 7.3 miles per hour. Publico, operated in San Juan, Puerto Rico, carries passengers at a speed of 11.7 miles per hour, and jitney, operated in San Francisco, at a speed of 5.1 miles per hour.