

- Transit Investment Analysis Methodology
- Transit Economics Requirements Model
- TERM Database
- Asset Inventory Data Table
- Urban Area Demographics Data Table
- Agency-Mode Statistics Data Table
- Asset Types Data Table
- Benefit-Cost Parameters Data Table
- Mode Types Data Table
- New Starts Data Table
- Investment Policy Parameters
- Financial Parameters
- Asset Rehabilitation and Replacement Investments
- Asset Expansion Investments
- Performance Improvement Investments
- Benefit-Cost Calculations
- Benefit-Cost Calculations for Rehabilitation/Replacement and Expansion Investments
- Benefit-Cost Calculations for Performance Improvement Investments
- TERM Database
Transit Investment Analysis Methodology
The Transit Economics Requirements Model (TERM), an analytical tool developed by the Federal Transit Administration (FTA), forecasts transit capital investment needs over a 20-year horizon. Using a broad array of transit-related data, the model generates the forecasts that appear in the biennial C&P report.
This appendix provides a brief technical overview of TERM, describing the various methodologies used to generate the estimates for the 2008 C&P Report.
Transit Economics Requirements Model
TERM forecasts investment needs by estimating the total amount of annual capital expenditures required over a 20-year period to maintain or improve the physical conditions and performance of the Nation's transit infrastructure. The model relies on a wealth of transit-related input data and user-defined parameters, stored in the TERM database, to generate these forecasts. Annual expenditure estimates forecast by TERM fall into one of three distinct capital investment categories: (1) asset rehabilitations and replacements; (2) asset expansions; and (3) performance improvements.
TERM Database
TERM's capital needs forecasts rely on a broad range of input data and user-defined parameters. Gathered from local transit agencies and the National Transit Database (NTD), the input data are the foundation of the model's investment needs analysis, and include information on the quantity and value of the Nation's transit capital stock. The input data in TERM are used to draw an overall picture of the Nation's transit landscape; the most salient data tables in the TERM database are described below.
Asset Inventory Data Table
The asset inventory data table housed in the TERM database contains detailed records of all transit assets used by the Nation's transit operators. These records contain information on each asset's type, mode of transportation, age, and acquisition cost. These data are derived from NTD, local transit agency submissions to FTA data requests, and special FTA studies. The asset inventory data table is the primary data source for the information used in TERM's forecast of rehabilitation and replacement investments.
Urban Area Demographics Data Table
The TERM database also includes a data table that stores demographic information on more than 300 of the largest metropolitan areas in the United States. Fundamental demographic data, such as current and anticipated population and employment levels, in addition to more transit-oriented information, such as current levels of vehicle miles traveled and transit passenger miles, are used by TERM to predict transit asset expansion investments.
Agency-Mode Statistics Data Table
Another component of the TERM database is the agency-mode statistics table, a data table that contains detailed operations and maintenance statistics for every agency-mode combination in the United States. By tracking the consumption of transit services as well as transit maintenance expenditures, the agency-mode statistics data table provides crucial input data to estimate which transit agency-mode combinations are candidates for performance improvement investments. This information also supports the benefit-cost analysis of future investments. All the data in this portion of the TERM database come from NTD.
Asset Types Data Table
This data table identifies all the different types of assets owned and operated by the Nation's public transit systems. Containing one record for each type of asset, this component of the TERM database contains information on asset unit replacement costs, rehabilitation costs, and rehabilitation life expectancies—all data points used in the 20-year investment needs analysis. Some of the asset decay relationships used to estimate asset conditions are also included in this data table. The decay relationships—statistically estimated equations relating asset condition to asset age, maintenance, and utilization—are discussed more in the next section of this appendix.
Benefit-Cost Parameters Data Table
The benefit-cost parameters data table contains values used to evaluate the merit of different types of transit investments forecasted by TERM. Measures in the data table include transit rider values (e.g., value of time and links per trip), auto costs per vehicle miles traveled (e.g., congestion delay, emissions costs, and roadway wear), and auto user costs (e.g., automobile depreciation, insurance, fuel, maintenance, and daily parking costs).
Mode Types Data Table
The mode types data table provides information on transit agencies' operations—including average speed, average headway, and average fare—and estimates of transit riders' responsiveness to changes in fare levels. Similar data are included for non-transit modes, such as private automobile and taxi costs. Information from this data table is also used in TERM's benefit-cost analysis.
New Starts Data Table
This data table, also used in TERM's benefit-cost analysis, contains information on Federal New Starts projects, major capital investment initiatives that are funded by the Federal government. This data table provides estimates of the average length of each New Starts project development phase, the share of total costs devoted to each phase, the average unit costs by investment category (e.g., vehicles, guideway, stations, etc.), and operations and maintenance costs. These data are used by TERM to estimate the costs and benefits associated with performance improvement investments.
The input tables described above, while forming the foundation of TERM, are not the sole source of information used by the model when generating its investment forecasts. In combination with the input data, which are static, meaning that the model user does not manipulate them from one model run to the next, TERM contains user-defined parameters to facilitate its capital expenditure forecasts.
Investment Policy Parameters
As part of its investment needs analysis, TERM predicts the physical condition of U.S. transit assets over a 20-year horizon. The predicted physical conditions are used to forecast rehabilitation and replacement investments. (The methodology for the rehabilitation and replacement aspect of TERM is described in detail below.)
The investment policy parameters data table allows the model user to set the physical condition ratings at which TERM will calculate a rehabilitation or replacement investment. Unique thresholds may be chosen for the following asset categories: guideway elements, facilities, systems, stations, and vehicles.
Financial Parameters
Because TERM is a model that forecasts investment needs, it also contains a number of financial assumptions. The financial parameters table allows the model user to set unique inflation assumptions and discount rates, among other parameters.
The preceding tables form the backbone of TERM, allowing it to estimate different types of capital investments, including rehabilitation and replacement expenditures, expansion investments, and capital projects aimed at performance improvements. These three different investment categories are described below.
Asset Rehabilitation and Replacement Investments
TERM's asset rehabilitation and replacement forecasts are designed to estimate annual funding needs for the ongoing rehabilitation and replacement of the Nation's existing transit assets. Specifically, these needs include the normal replacement of assets reaching the end of their useful life, mid-life rehabilitations, and annual capital expenditures for routine maintenance.
To estimate continuing replacement and rehabilitation investments, TERM assesses the physical conditions of the Nation's transit assets on an annual basis, allowing the model to determine when a particular asset, such as a bus or rail station, has reached a condition that requires it to be repaired or replaced. In TERM, the physical conditions of all assets are measured using a numeric scale of five through one; see Exhibit C-1 for a description of the scale.
| Rating | Condition | Description |
|---|---|---|
| Excellent | 5 | No visible defects, near new condition. |
| Good | 4 | Some slightly defective or deteriorated components. |
| Adequate | 3 | Moderately defective or deteriorated components. |
| Marginal | 2 | Defective or deteriorated components in need of replacement. |
| Poor | 1 | Seriously damaged components in need of immediate repair. |
The model performs this aspect of the forecasting process using TERM's asset inventory, which includes the fabrication dates for all assets and an array of asset decay algorithms, equations designed to simulate how the conditions of U.S. transit assets deteriorate over time. During a model run, the condition ratings of the assets stored in TERM's asset inventory will decline, crossing one or more of six potential condition thresholds that each mark a point in the asset lifecycle at which the asset is expected to undergo either rehabilitation or replacement. TERM currently allows an asset to be rehabilitated up to five different times; after the fifth rehabilitation, the model assumes that the asset is replaced. Throughout a simulation, TERM records the cost and timing of these re-investment events as model outputs, and adds them to the tally of national investment needs generated by the model, provided they pass a benefit-cost test. The model also reports the conditions of different transit assets using the scale shown in Exhibit C-1.
It is important to note that the model can forecast rehabilitation and replacement investments, as well as asset condition estimates, under either a Maintain Conditions scenario or an Improve Conditions scenario. Under the Maintain Conditions scenario, TERM's five replacement condition thresholds are adjusted until the condition values for each asset category at the end of the model simulation period equal their condition values at the start. Conversely, when conducting estimates under the Improve Conditions scenario, the five replacement condition thresholds in TERM are adjusted until the condition values for each asset category at the end of the model simulation period are equal to 4, or "good," according to the scale shown in Exhibit C-1.
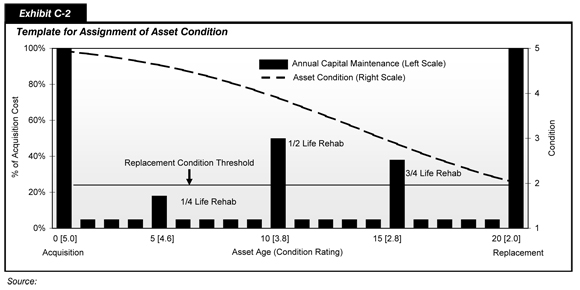
All investment estimates associated with rehabilitation and replacement needs are represented conceptually for a generic asset in Exhibit C-2 . In this theoretical example, asset age is represented on the horizontal axis, the cost of life-cycle capital investments on the left-vertical axis (as a percent of acquisition cost), and asset conditions on the right-vertical axis. At the acquisition date each asset is assigned an initial condition rating of 5, or "excellent," while the asset's initial purchase cost is represented by the tall vertical bar at the left of the chart. Over time, the asset's condition begins to decline in response to aging and use, represented by the dotted line, requiring periodic lifecycle improvements including annual capital maintenance and periodic rehabilitation projects. Finally, the asset reaches the end of its useful life, defined in this example as a physical condition rating of 2, at which point the asset is retired and replaced.
Asset Expansion Investments
In addition to devoting capital to maintain and replace aging assets, transit agencies frequently need to expand their service offerings to cope with rising consumer demand. As more riders take advantage of transit systems, service levels—measured in this case by vehicle occupancy rates—begin to degrade. To stem this type of degradation of service, local transit operators invest in new assets to maintain existing service levels.
TERM is capable of forecasting these types of investments. Specifically, the model assumes that each transit agency-mode combination strives to maintain a constant ratio of passenger miles per peak transit vehicle over time. To do so, agencies must continuously invest in additional transit vehicles at a rate equal to the growth of transit passenger miles for the urban area that they serve.
To forecast the number of new transit vehicles, TERM first projects future transit demand for each urban area contained in the model using a sample of growth rates provided to FTA by several metropolitan planning organizations. If a transit agency operates in an urban area with growing demand, the model assumes that the agency will need to acquire a sufficient number of vehicles to maintain its current vehicle occupancy levels. Cost estimates for these types of investments are derived from historical acquisition records stored in the TERM database.
The model also forecasts expansion investments in other assets needed to support projected new vehicle acquisitions. These investments include maintenance facilities and, in the case of rail systems, additional route miles made up of guideway, trackwork, stations, train control, and traction power systems. It is important to note that TERM does not predict asset expansion investments for agency-mode combinations with current ridership levels that are well below the national average. Like other investments forecast by the model, TERM subjects asset expansion investments aimed at maintaining existing service levels to a benefit-cost analysis.
Because TERM adds the cost of newly acquired vehicles and supporting infrastructure to its tally of investment needs, it also ensures that the cost of rehabilitating and replacing the new assets is accounted for over the 20-year period of analysis.
Performance Improvement Investments
Though transit agencies frequently make investments just to keep pace with growing consumer demand, local operators also look to acquire transit assets that will allow them to the improve the performance of their operations. TERM predicts investments of this nature by forecasting acquisitions aimed at increasing the average operating speed or reducing the average vehicle occupancy rate of a given agency-mode combination.
To forecast investments dedicated to reducing crowding in vehicles, TERM identifies U.S. transit agency-mode combinations with vehicle occupancy rates that are well above the national average. The model then seeks to reduce crowding for these high occupancy agency-mode combinations below some maximum occupancy threshold by investing in new vehicles and related support assets. As with all other investment forecasts, cost estimates are generated using historical data stored in the TERM database.
TERM also forecasts investments focused on increasing the average operating speed for a given agency-mode combination. To do this, the model identifies those U.S. urban areas with average operating speeds well below the national average and seeks to raise those speeds to a minimum threshold through the introduction of new vehicles.
In making these predictions, TERM operates on the premise that average operating speeds for rail and bus rapid transit systems are higher than for regular motor bus systems. Consequently, for large urban areas the model substitutes rail transit capacity in place of existing motor bus capacity. Alternatively, for small urban areas TERM substitutes bus rapid transit systems for motor bus systems. These types of investments are assumed to boost the average operating speed for the urban areas as a whole, improving the overall performance of the transit system being analyzed.
Finally, as with the asset expansion investment forecasts, TERM does not calculate speed-improving investments in urban areas with low ridership. The model makes all cost estimates using historical cost data stored in the asset inventory. Once again, because the model adds the cost of newly purchased vehicles and supporting infrastructure to its tally of investment needs, it also ensures that the cost of rehabilitating and replacing new assets is accounted for over the 20-year period of analysis.
Benefit-Cost Calculations
Before being added to the final tally of the Nation's public transit needs, all of the investments forecast by TERM must pass a benefit-cost test. If an investment fails a benefit-cost test, meaning that the benefit-cost ratio of the investment is less than 1.0, it is rejected and its costs are not added to the model's tally of national transit needs. Conversely, if the benefit-cost ratio of the investment is greater than or equal to 1.0, then the investment needs tally is updated to include the investment costs.
Like all of the other forecasts made by the model, cost estimates in the benefit-cost calculations are prepared using historical cost records stored in the TERM database. Benefit calculations, however, are limited to those that are readily quantifiable using publicly available data such as those available in NTD. Benefits generally fall into two different categories: (1) benefits to transit riders, and (2) benefits to society.
Most of the benefits from investment in public transit accrue to new and existing transit riders. Benefits for riders include travel time savings, reduced costs associated with operating a motor vehicle, improved mobility, and improved quality of service. To quantify these benefits, TERM compares the sum of user costs for a trip when transit investments have been made with the sum of these costs for a trip when no transit investments have been made. In most instances, this means comparing riders' costs on the selected transit mode with the riders' costs on the mode that is the next-best alternative.
Although consumers tend to be the primary beneficiaries of new transit investments, society as a whole often benefits, too, principally in the form of cost reductions. Cost savings to society include those resulting from reductions in highway congestion, air and noise pollution, energy consumption, and automobile accidents. These types of cost reductions are calculated on a per-auto-vehicle-mile of travel basis using publicly available data.
While TERM calculates the value of these types of benefits across investment types, the model uses somewhat different methodologies to evaluate the costs and benefits of different kinds of investments.
Benefit-Cost Calculations for Rehabilitation/Replacement and Expansion Investments
TERM performs two types of benefit-cost tests, depending on the type of investment being analyzed. Expansion investments, in addition to rehabilitation and replacement investments, are evaluated by the model on a mode and agency basis. This means that the model considers the value of investing in a particular transit mode by a particular agency; it does not evaluate the benefit of purchasing each piece of equipment separately or on the basis of the location where the investment will be made within each agency's operating area. In the case of transit, where investments comprise a wide range of capital goods, it is more practical to evaluate transit investments as a package rather than as discrete pieces of equipment.
In performing this type of analysis on these kinds of investments, TERM takes a two-step approach. First, the model evaluates the discounted streams of all agency-mode combination benefits and costs—the sum for existing operations and for proposed capital improvements—within the context of a single benefit-cost calculation. This means that the effectiveness of all the capital investment necessary to maintain an agency's ongoing operations, holding asset conditions and performance levels constant, is evaluated in its entirety rather than the cost effectiveness of individual replacement needs, such as adding single track segments or bus vehicles.
If the benefits exceed the capital expenditures, the benefit-cost ratio is greater than 1.0, and the estimated 20-year capital investment needs for that agency-mode combination are included in TERM's estimate of total U.S. transit capital investment needs. If, in contrast, the agency-mode fails the benefit-cost test, TERM conducts a supplemental analysis to determine if the agency-mode combination will pass the benefit-cost test if TERM's proposed maintain performance investments are excluded from the analysis.
In this supplemental analysis, TERM recalculates the benefit-cost ratio after removing all proposed investment costs and benefits associated with investments designed to maintain current service levels. If the agency-mode combination now passes the benefit-cost test with only the rehabilitation and replacement investments, these remaining capital investment needs are added to the national investment needs tally. Otherwise, continued capital investment in this agency-mode combination is not considered cost-beneficial and is not included in national investment needs for the balance of the model run. Note that this action assumes that the service provided by the agency-mode is continued, but that capital reinvestment in the agency-mode combination is suspended for the time period covered by the model run. (It is important to note that all agency-modes are included in the condition forecasts made by TERM.)
Benefit-Cost Calculations for Performance Improvement Investments
The second type of benefit-cost calculation performed by TERM assesses the effectiveness of performance improvement investments proposed by the model. Investments intended to improve vehicle occupancy rates are evaluated on an agency-mode combination basis, while investments aimed at increasing average operating speeds are assessed on an urban area basis.
Similar to the first type of benefit-cost calculations, investments with a benefit-cost ratio greater than 1.0 are included in TERM's estimated total national performance improvement investment needs while those with a benefit-cost ratio of less than 1.0 are omitted from this estimate.
At the end of all investment needs forecasts and benefit-cost tests, TERM produces a 20-year cost estimate for capital needs for the Nation's transit agencies.