U.S. Department of Transportation
Federal Highway Administration
1200 New Jersey Avenue, SE
Washington, DC 20590
202-366-4000
Allocation of 2000 Federal Highway Program Costs
Federal highway program costs are divided into several cost categories, each of which is allocated among vehicle classes in a different manner.
Pavement Cost AllocationCosts associated with constructing new lanes on new locations are assigned to various vehicle classes using methods similar to those developed for the 1982 Federal HCAS. Costs for the base facility are directly related to the need for new highway capacity. They are allocated to vehicles on the basis of each vehicle's VMT weighted by its passenger car equivalents (PCEs), a measure used by traffic engineers to compare the influence of different types of vehicles on highway capacity. For instance, the influence of a combination truck on traffic flow is several times that of a passenger car and thus the VMT of combination trucks is weighted by this PCE factor to reflect the relative contribution of combination trucks to the need for additional highway capacity. Costs for the additional pavement thickness needed to accommodate anticipated traffic are allocated based on the latest AASHTO pavement design procedures.
Costs for pavement reconstruction, rehabilitation, and resurfacing (3R), which are estimated to represent 25 percent of total Federal obligations in 2000, are allocated to different vehicle classes on the basis of each vehicle's estimated contribution to pavement distresses necessitating the improvements. The same general approach is used as in the 1982 Federal HCAS, but new Pavement Distress Models were developed for this study that reflect the latest theoretical advances in understanding factors that influence pavement distress. In addition to the improved Pavement Distress Models, other significant improvements have been made to the estimation of pavement 3R costs.
Costs of constructing new bridges are allocated to vehicles using an incremental approach similar to that used in the 1982 Federal HCAS. As with new pavements, costs for constructing the base facility of a new bridge are allocated to all vehicle classes in proportion to their PCE-VMT. Incremental costs to provide the additional strength needed to support heavier vehicles are assigned to vehicle classes on the basis of the additional strength required on account of their weight and axle spacings.
Bridge reconstruction and rehabilitation costs are assigned according to the types of improvements that are made. Some bridge improvements are made because the bridge has become functionally obsolete and can no longer safely and efficiently accommodate traffic because of inadequate capacity, substandard geometrics, or other safety problems. Those costs are allocated on the basis of VMT since there is no superior allocator that explains each vehicle's contribution to those costs better than VMT. Other bridge improvements are required because the bridge has become structurally inadequate to carry the traffic using the facility. Costs to provide additional structural capacity are allocated to those vehicle classes that require the greater strength.
Some program costs neither increase the number of lane-miles of highway capacity nor maintain the physical condition of the highway system. These costs collectively are grouped together under the heading system enhancements. Costs in this category include (1) Transportation System Management (TSM) projects to increase capacity and safety through traffic operations improvements; (2) other safety improvement projects such as improving roadway alignment, shoulder improvements, improvements to reduce crashes at high accident locations, etc.; (3) Intelligent Transportation System (ITS) projects; (4) projects to mitigate adverse environmental impacts or to beautify the highway environment; (5) projects to provide transit, pedestrian, bicycle, or intermodal facilities; and (6) various other projects that enhance the overall contribution of the highway system to various social, environmental, or economic goals. With the passage of ISTEA, the share of overall program costs comprised of enhancements has increased substantially because 10 percent of expenditures from Surface Transportation Program (STP) funds are required to be used for enhancement projects and because of increased flexibility in the use of other Federal-aid highway funds. Mass Transit Projects funded from the MTA of the HTF are not included in this category but are in a separate category to emphasize the fact that they are uniquely for mass transit.
Several different factors are used to allocate system enhancement costs among vehicle classes. Many of these costs were so small in 1982 Federal HCAS that they were not treated explicitly, and new allocators had to be selected. Allocators for each cost category are selected with the objective of finding the factor that most closely explains each vehicle's contribution to that particular type of cost. Several categories of system enhancements are allocated on the basis of PCEs because they improve the overall operations of the highway system and are provided in lieu of constructing additional lane-miles of capacity.
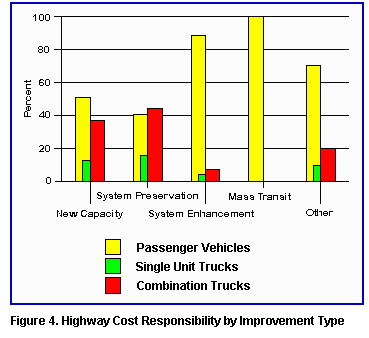
Other attributable costs include highway geometric elements and other program cost categories that have a relationship to particular vehicle characteristics. These elements include grading and drainage; pavement width; ridesharing programs and facilities; and special truck facilities such as weigh stations. These costs are allocated on the basis of the relationships between the cost element and the vehicle characteristic, and are allocated to only the vehicle classes responsible for the costs. Figure 4 summarizes the distribution of highway cost responsibility by vehicle class and broad improvement type. Passenger vehicles are responsible for over half of the costs of providing new highway capacity, and almost 90 percent of the cost of system enhancements. Combination trucks, on the other hand, are responsible for over 40 percent of system preservation costs, nearly 40 percent of new capacity costs, and 7 percent of system enhancement costs. Differences in each vehicle class' relative cost responsibility for various program costs strongly influence the overall cost assignments among vehicle classes. Changes in the composition of the highway program could affect the overall cost responsibilities of different vehicle classes. For instance if a greater proportion of Federal funds were spent on capacity or system preservation improvements, the share of total costs assigned to heavy trucks would increase whereas if a greater proportion of Federal funds were spent on system enhancements, mass transit, or other improvements, the relative cost responsibility of automobiles, pickups, and vans would increase.
Table 3. 2000 Federal Highway Cost Responsibilities by
Vehicle Class and Weight Group ($ Millions)Vehicle Class/Registered Weight Total Cost Responsibilities Cents per Mile Shares of Total Autos $11,898
0.65
43.8%
Pickups/Vans $4,198
0.65
15.4%
Buses $190
2.57
0.7%
All passenger vehicles $16,287
0.66
59.9%
Single Unit Trucks <25,000 pounds $985
1.75
3.6%
25,001 - 50,000 pounds $842
4.38
3.1%
>50,000 pounds $1,083
14.60
4.0%
All single units $2,910
3.51
10.7%
Combination Trucks <50,000 pounds $187
2.78
0.7%
50,001 - 70,000 pounds $454
4.25
1.7%
70,001 - 75,000 pounds $370
6.25
1.4%
75,001 - 80,000 pounds $6,103
7.08
22.5%
80,001 - 100,000 pounds $484
12.50
1.8%
>100,000 pounds $378
16.60
1.4%
All combinations $7,978
6.90
29.4%
All trucks $10,888
5.48
40.1%
Total $27,175
Table 3 shows the estimated cost responsibility of different vehicle classes and registered weight groups for Federal highway-related program costs funded from the HTF in 2000. Automobiles and combination trucks are responsible for the greatest shares of Federal highway costs, followed by pickups and vans, single unit trucks, and buses. Relative cost responsibilities per mile of travel show much different patterns. Combination trucks as a group have an average cost responsibility for Federal program costs of about 7 cents per mile -- more than 10 times the cost responsibility per mile of automobiles.
There are large differences in cost responsibilities among single unit and combination trucks at different weights. The Federal cost responsibility per mile for single unit trucks registered at 25,000 pounds or less is only 13 percent of that for single unit trucks registered over 50,000 pounds. Combination trucks registered at 50,000 pounds have only 40 percent of the cost responsibility per mile of combinations registered at 80,000 pounds, and less than 20 percent of the cost responsibility per mile combinations registered over 100,000 pounds. While combination vehicles of over 80,000 pounds registered weight account for only 3 percent of total truck travel, they are responsible for almost 8 percent of total truck cost responsibility. Single unit trucks registered at over 50,000 pounds account for 4 percent of total truck travel but 11 percent of total truck costs. Combined, the heaviest single unit and combination trucks account for 7 percent of truck travel but almost one-fifth of total truck costs.
Table 3 shows the highway cost responsibilities for vehicles at different registered weights. Vehicles typically register at the highest weight at which they expect to operate, but operate only part of their annual mileage at that weight; some of each vehicle's travel typically will be empty, some will be partially loaded, some will be at the registered weight, and some may be above the registered weight. Since cost responsibility varies dramatically with weight for vehicles in any particular class, the distribution of weights at which vehicles actually operate is an important factor in estimating the overall cost responsibility for vehicles at any given registered weight over the year.
Figure 5 shows the average distribution of operating weights for 5-axle tractor-semitrailers registered at 80,000 pounds. This bi-modal distribution has one peak around 35,000 pounds and another peak at 80,000 pounds, the weight at which the vast majority of 5-axle tractor-semitrailers register. This distribution indicates that tractor-semitrailers, on average, operate empty or nearly empty about 10 percent of the time, operate at 80,000 pounds about 10 percent of the time, and operate above 80,000 pounds about 10 percent of the time. It must be emphasized that these distributions are averages over the entire class of vehicles, and that operating weight distributions for individual vehicles within the class may vary substantially from this average distribution.
While equity analyses in the report are based on cost responsibilities of vehicles at different registered weights considering the entire range of operating weights for vehicles at different registered weights, cost responsibilities can be estimated for each individual weights at which vehicles might operate during the year. Table 4 compares highway cost responsibilities estimated for specific operating weights with those based upon registered weights of vehicles. Cost responsibilities for specific operating weights will almost always be higher than cost responsibilities estimated on a registered weight basis because vehicles registered at a particular weight typically travel at that weight only part of the time; most of their operations will be a lighter weights at which costs are lower. The value of evaluating operating weight cost responsibilities is that they clearly show the relationship between highway cost responsibility and weight and the potential costs associated with operations at higher weights.
Life Cycle Cost Analysis
The potential for more widespread use of life cycle cost analysis (LCCA) to reduce overall system construction, maintenance and operating costs was evaluated on a preliminary basis in this study. The LCCA of infrastructure investment decisions is intended to identify alternatives that have the lowest cost over their entire life, not just alternatives with the lowest initial costs. Among the factors that can affect life cycle costs are the materials selected for particular types of construction, the initial design, and maintenance and rehabilitation (M&R) practices. Many States apply LCCA principles to varying degrees in pavement and bridge management systems, but there is a widespread belief that greater use of LCCA could reduce long-term program costs. The implications of LCCA for highway cost allocation (HCA) are that if long-term infrastructure preservation costs could be reduced, those costs would represent a smaller share of the overall program and vehicle classes responsible for the greatest share of those costs would have lower cost responsibilities and improved equity ratios.
The NHS Designation Act of 1995 (P.L. 104-59, 109 Stat. 568 (1995)) requires the use of LCCA on NHS projects having a usable project segment costing $25 million or more. The FHWA recently issued a final policy statement on LCCA implementing LCCA provisions of this Act and generally encouraging the use of LCCA in evaluating major infrastructure investment decisions.
A preliminary analysis suggests large potential benefits from the adoption of LCCA, especially in reducing vehicle operating costs associated with traveling on deteriorated pavements and delay around work zones where highway M&R is being performed. Estimates of nationwide savings in construction and maintenance costs resulting from the use of LCCA are not as large, although the analytical tools used for this analysis may not capture the full range of potential agency benefits believed to accrue from use of LCCA. Further research to improve estimates of potential benefits of LCCA is planned, not only for cost allocation but for investment analyses conducted for the Department's Conditions and Performance (C&P) Report.