U.S. Department of Transportation
Federal Highway Administration
1200 New Jersey Avenue, SE
Washington, DC 20590
202-366-4000
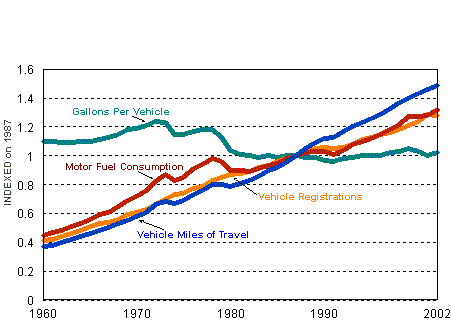
Graphic showing Indices on 1987 for Vehicle Registrations, Fuel Consumpion, Vehicle Miles of Travel, and Gallons Per Vehicle.

| YEAR | VEHICLE MILES OF TRAVEL | MOTOR FUEL CONSUMPTION | VEHICLE REGISTRATIONS | GALLONS PER VEHICLE |
|---|---|---|---|---|
| 1960 | 0.37 | 0.45 | 0.41 | 1.10 |
| 1961 | 0.38 | 0.47 | 0.42 | 1.10 |
| 1962 | 0.4 | 0.48 | 0.44 | 1.09 |
| 1963 | 0.42 | 0.51 | 0.46 | 1.09 |
| 1964 | 0.44 | 0.53 | 0.48 | 1.10 |
| 1965 | 0.46 | 0.56 | 0.51 | 1.10 |
| 1966 | 0.48 | 0.59 | 0.53 | 1.11 |
| 1967 | 0.5 | 0.61 | 0.54 | 1.13 |
| 1968 | 0.53 | 0.65 | 0.56 | 1.15 |
| 1969 | 0.55 | 0.69 | 0.59 | 1.18 |
| 1970 | 0.58 | 0.72 | 0.61 | 1.19 |
| 1971 | 0.61 | 0.76 | 0.63 | 1.21 |
| 1972 | 0.66 | 0.82 | 0.66 | 1.24 |
| 1973 | 0.68 | 0.87 | 0.7 | 1.23 |
| 1974 | 0.67 | 0.83 | 0.73 | 1.15 |
| 1975 | 0.69 | 0.85 | 0.74 | 1.15 |
| 1976 | 0.73 | 0.91 | 0.77 | 1.17 |
| 1977 | 0.76 | 0.94 | 0.79 | 1.18 |
| 1978 | 0.8 | 0.98 | 0.83 | 1.18 |
| 1979 | 0.8 | 0.96 | 0.85 | 1.13 |
| 1980 | 0.79 | 0.9 | 0.87 | 1.04 |
| 1981 | 0.81 | 0.9 | 0.88 | 1.01 |
| 1982 | 0.83 | 0.89 | 0.89 | 1.00 |
| 1983 | 0.86 | 0.91 | 0.92 | 0.99 |
| 1984 | 0.9 | 0.93 | 0.93 | 1.00 |
| 1985 | 0.92 | 0.95 | 0.96 | 0.99 |
| 1986 | 0.96 | 0.98 | 0.98 | 1.00 |
| 1987 | 1 | 1 | 1 | 1.00 |
| 1988 | 1.05 | 1.02 | 1.03 | 0.99 |
| 1989 | 1.09 | 1.03 | 1.05 | 0.99 |
| 1990 | 1.12 | 1.03 | 1.06 | 0.97 |
| 1991 | 1.13 | 1.01 | 1.05 | 0.96 |
| 1992 | 1.17 | 1.04 | 1.06 | 0.98 |
| 1993 | 1.2 | 1.08 | 1.08 | 0.99 |
| 1994 | 1.23 | 1.1 | 1.11 | 1.00 |
| 1995 | 1.26 | 1.12 | 1.13 | 1.00 |
| 1996 | 1.29 | 1.15 | 1.15 | 1.00 |
| 1997 | 1.33 | 1.18 | 1.16 | 1.02 |
| 1998 | 1.37 | 1.22 | 1.18 | 1.03 |
| 1999 | 1.40 | 1.27 | 1.21 | 1.05 |
| 2000 | 1.43 | 1.27 | 1.24 | 1.03 |
| 2001 | 1.46 | 1.28 | 1.29 | 1.00 |
| 2002 | 1.49 | 1.32 | 1.28 | 1.02 |
This table is also availible for download in the following formats:
To view PDF files, you need the Acrobat® Reader®.