U.S. Department of Transportation
Federal Highway Administration
1200 New Jersey Avenue, SE
Washington, DC 20590
202-366-4000
| Highway Statistics 2004 | OHPI > Highway Statistics > 2004 > Highway Finance > Chart |
| INDEX | 1987 | 1988 | 1989 | 1990 | 1991 | 1992 | 1993 | 1994 | 1995 | 1996 | 1997 | 1998 | 1999 | 2000 | 2001 | 2002 | 2003 | 2004 |
|---|---|---|---|---|---|---|---|---|---|---|---|---|---|---|---|---|---|---|
| Federal-Aid Highway Construction | 100.0 | 106.6 | 107.7 | 108.5 | 107.5 | 105.1 | 108.3 | 115.1 | 121.9 | 120.2 | 130.6 | 126.9 | 136.5 | 145.6 | 144.8 | 147.9 | 149.8 | 154.4 |
| Consumer Price Index | 100.0 | 104.1 | 109.2 | 115.1 | 119.9 | 123.5 | 127.2 | 130.5 | 134.2 | 138.1 | 141.3 | 143.5 | 146.7 | 151.6 | 155.9 | 158.4 | 162.0 | 166.3 |
| YEARS | Federal-Aid Highway Construction Index | Consumer Price Index-Urban | ||||
|---|---|---|---|---|---|---|
| Capital Outlay (Current) |
Index | Capital Outlay (Constant) |
Maintenance (Current) |
Index | Maintenance (Constant) |
|
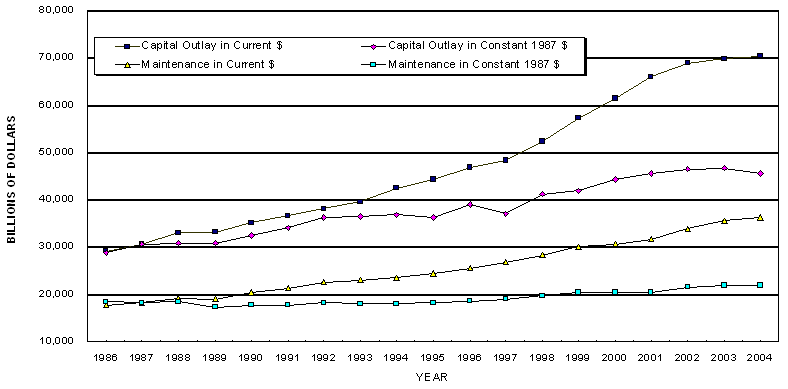
| 1981 | 19,734 | 94.2 | 20,949 | 12,165 | 80 | 15,206 |
| 1982 | 19,052 | 88.5 | 21,528 | 13,319 | 84.9 | 15,688 |
| 1983 | 20,224 | 87.6 | 23,087 | 14,240 | 87.7 | 16,237 |
| 1984 | 23,123 | 92.6 | 24,971 | 15,008 | 91.5 | 16,402 |
| 1985 | 27,138 | 102 | 26,606 | 16,032 | 94.7 | 16,929 |
| 1986 | 29,177 | 101.1 | 28,860 | 17,654 | 96.5 | 18,294 |
| 1987 | 30,674 | 100 | 30,674 | 18,152 | 100 | 18,152 |
| 1988 | 32,884 | 106.6 | 30,848 | 19,109 | 104.1 | 18,356 |
| 1989 | 33,144 | 107.7 | 30,774 | 18,952 | 109.2 | 17,355 |
| 1990 | 35,151 | 108.5 | 32,397 | 20,365 | 115.1 | 17,693 |
| 1991 | 36,638 | 107.5 | 34,082 | 21,222 | 119.9 | 17,700 |
| 1992 | 38,065 | 105.1 | 36,218 | 22,578 | 123.5 | 18,282 |
| 1993 | 39,528 | 108.3 | 36,499 | 22,894 | 127.2 | 17,998 |
| 1994 | 42,379 | 115.1 | 36,819 | 23,553 | 130.5 | 18,048 |
| 1995 | 44,228 | 122.1 | 36,223 | 24,319 | 134.2 | 18,121 |
| 1996 | 46,810 | 120.2 | 38,943 | 25,564 | 138.12 | 18,514 |
| 1997 | 48,360 | 130.6 | 37,029 | 26,777 | 141.29 | 18,952 |
| 1998 | 52,308 | 126.9 | 41,220 | 28,173 | 143.49 | 19,635 |
| 1999 | 57,227 | 136.5 | 41,925 | 29,997 | 146.65 | 20,455 |
| 2000 | 61,323 | 145.6 | 44,347 | 30,636 | 151.58 | 20,400 |
| 2001 | 65,968 | 144.8 | 45,558 | 31,677 | 155.9 | 20,319 |
| 2002 | 68,794 | 147.9 | 46,514 | 33,893 | 158.36 | 21,403 |
| 2003 | 69,876 | 149.8 | 46,646 | 35,467 | 161.97 | 21,897 |
| 2004 | 70,274 | 154.4 | 45,514 | 36,327 | 166.29 | 21,846 |
Capital Outlay Constant 1987 Dollars are calculated using the Federal-Aid Highway Construction Index. See table PT-1.
Maintenance Constant 1987 Dollars are calculated using the Consumer Price Index.
This table is also available for download in the following formats:
To view PDF files, you need the Acrobat® Reader®.

