U.S. Department of Transportation
Federal Highway Administration
1200 New Jersey Avenue, SE
Washington, DC 20590
202-366-4000


Skip to content
Facebook iconYouTube iconTwitter iconFlickr iconLinkedInInstagram

Policy and Governmental Affairs

FHWA Home / Policy & Governmental Affairs / Highway Statistics 2005 - FHWA

Highway Statistics 2005 - FHWA

1996 - 2005 System Travel Density Trends - Roadway Extent, Characteristics, and Performance - Highway Statistics 2005 - FHWA
Highway Statistics 2005 OHPI > Highway Statistics > 2005 > Roadway Extent, Characteristics, and Performance > System Travel Density Trends 1996 thru 2005

SYSTEM TRAVEL DENSITY TRENDS


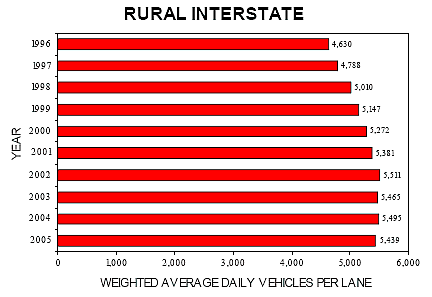
System Travel Density Trend: Rural Interstate. Bar graph shows that rural interstate travel was at its highest level in 2004. The average daily vehicles per lane was 5,495

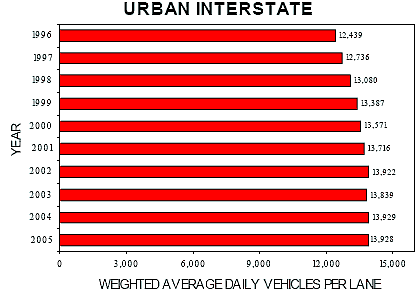
System Travel Density Trends: Urban Interstate.  2004 was the highest year for urban interstate travel.  There were a total of 13,9298 weighted average daily vehicles per lane

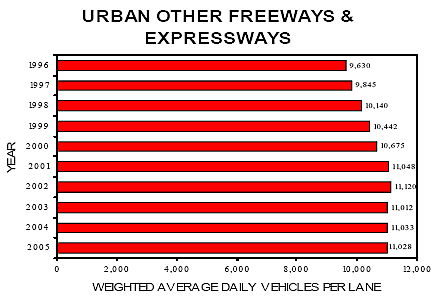
System Travel Density Trend: Urban Other Freeways and Expressways.  The highest travel for urban freeways and expressways was in 2002.  There were a total of 11,120 weighted, average daily vehicles per lane.


This table is also available for download in the following formats:

To view PDF files, you need the Acrobat® Reader®.

Page last modified on November 7, 2014
Federal Highway Administration | 1200 New Jersey Avenue, SE | Washington, DC 20590 | 202-366-4000