U.S. Department of Transportation
Federal Highway Administration
1200 New Jersey Avenue, SE
Washington, DC 20590
202-366-4000
| Highway Statistics 2006 | OHPI > Highway Statistics > 2006 > NHTS > Table NT-2 |


| Men | Women | |
|---|---|---|
| Percent Change in Population 16+ | 52.7% | 49.7% |
| Percent Change in Drivers | 63.0% | 112.9% |
| Percent Change in Workers | 61.3% | 145.1% |
| 1969 | 1977 | 1983 | 1990 (adj) | 1995 | 2001 | |
|---|---|---|---|---|---|---|
| Households | 62,504 | 75,412 | 85,371 | 93,347 | 98,900 | 107,369 |
| Persons | 197,213 | 213,141 | 229,453 | 239,416 | 259,994 | 277,208 |
| Household Vehicle Trips | 87,284 | 108,826 | 126,874 | 193,916 | 229,745 | 234,994 |
| Person Trips | 145,146 | 211,778 | 224,385 | 304,471 | 378,930 | 410,969 |
| Household VMT | 775,940 | 907,603 | 1,002,139 | 1,695,290 | 2,068,368 | 2,281,863 |
| Person Miles of Travel | 1,404,137 | 1,879,215 | 1,946,662 | 2,829,936 | 3,411,122 | 4,026,158 |
| CO | 88,034 | 50,386 | ||||
| N0x | 7,390 | 7,765 | ||||
| VOC | 12,972 | 5,325 |
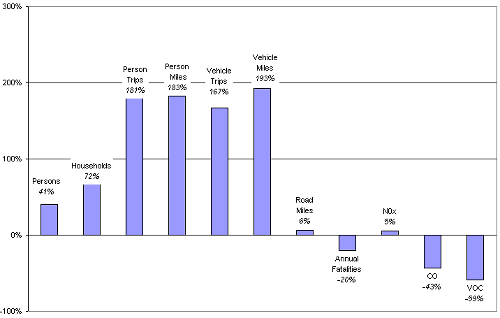
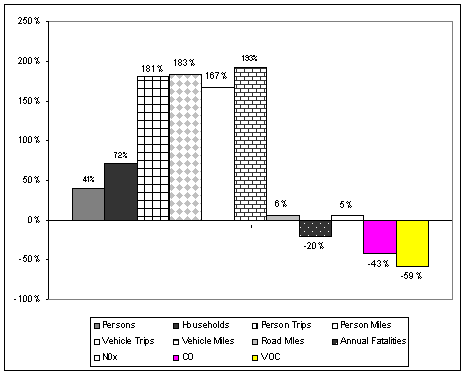
| Percent Change since 1969 | |
|---|---|
| Persons | 41% |
| Households | 72% |
| Person Trips | 181% |
| Person Miles | 183% |
| Vehicle Trips | 167% |
| Vehicle Miles | 193% |
| Road Miles | 6% |
| Annual Fatalities | -20% |
| N0x | 5% |
| CO | -43% |
| VOC | -59% |
This table is also available for download in the following formats:
To view PDF files, you need the Acrobat® Reader®.
OHPI Home | Highway Statistics 2006 | Data Feedback