U.S. Department of Transportation
Federal Highway Administration
1200 New Jersey Avenue, SE
Washington, DC 20590
202-366-4000
Transportation Performance Management (TPM) is a strategic approach that uses system information to make investment and policy decisions to achieve national performance goals in 23 U.S.C 150(b). TPM focuses on setting performance targets, monitoring progress, and using data to inform decision-making and resource allocation to ensure the most efficient investment of Federal transportation funds. Starting with the Moving Ahead for Progress in the 21st Century Act (MAP-21), the Federal-aid highway program was transformed to increase accountability and transparency by focusing on performance outcomes for key national performance goals. As a result, State transportation agencies and metropolitan planning organizations are required to adopt TPM by implementing the national performance management measures codified in 23 CFR Part 490. Traffic data serves as one of the essential foundations of the TPM framework. Consequently, the requirements in 23 CFR Part 490 heavily rely on this data to accurately assess highway performance and prioritize investment strategies.
The PHED Measure (23 CFR Part 490 Subpart G) assesses traffic congestion on the National Highway System (NHS) within urbanized areas exceeding 200,000 in population. Notably, if any part of an urbanized area is designated as a nonattainment or maintenance area for ozone (O3), carbon monoxide (CO), or particulate matter (PM10 and PM2.5) National Ambient Air Quality Standards, the entirety of its NHS network within that urbanized area becomes subject to the measure. Below outlines how the traffic data (i.e., 15-minute travel time data from the National Performance Management Research Dataset (NPMRDS)) is used to derive this performance measure.
Threshold Speed
Defined as the greater of 20 mph or 60 percent of the posted speed limit for each reporting segment in an applicable urbanized area (applicable reporting segment).
Excessive Delay Threshold Travel Time (EDTTT)
For each applicable reporting segment, EDTTT is the travel time on the segment above which delay would be incurred. Observed travel times exceeding EDTTT are recorded as segment delay.

Where:
s = A reporting segment in an applicable urbanized area (applicable reporting segment).
SLs = Total length of segment to the nearest thousandth of a mile for reporting segment "s".
Reporting Segment Delay (RSD)
For each 15-minute bin (increment) of each applicable reporting segment, Reporting Segment Delay (RSD) is computed as follows:

Where:
s = A reporting segment in an applicable urbanized area (applicable reporting segment).
TravelTimes,b = travel time of all vehicles on segment "s" and 15-minute time bin "b" during peak-hours. Peak-hours are: 6:00–10:00 a.m. weekdays from January 1st through December 31st of the same year; and 3:00–7:00 p.m. (or 4:00–8:00 p.m.) weekdays from January 1st through December 31st of the same year.
RSDs,b = travel time segment delay for a 15-minute bin "b" of applicable reporting segment "s" during peak-hours for a calendar year. RSDs,b value not to exceed 900 seconds.
Excessive Delay (ED)
For each 15-minute bin (increment) of each applicable reporting segment, Excessive Delay (ED) is computed as follows:

Average Vehicle Occupancy (AVO)
Annual average vehicle occupancy (AVO) factor for cars, buses, and trucks in an applicable urbanized areas is computed as follows:

Where:
AVOc/t/b = Average vehicle occupancies of cars, trucks, and buses.
Pc/t/b = Traffic proportions of cars, trucks, and buses.
Total Delay (TD)
For each 15-minute bin (increment) of each applicable reporting segment, Total Delay (TD) is computed as:

Where:
s = A reporting segment in an applicable urbanized area (applicable reporting segment).
nhs_pct = percent of the applicable reporting segment ("s") length on the National Highway System.
Volume15 = 15-minute ("b") traffic volume for the applicable reporting segment "s".
Peak Hour Excessive Delay (PHED)
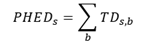
For each applicable reporting segment, compute total annual person-hours of excessive delay during peak hours (PHEDs) by summing the total delay (TD) over all 15-minute bins that occur within the defined weekday peak periods throughout the calendar year.
Annual Hours of PHED per capita

Where:
Annual Hours of Excessive Delay per Capita = The cumulative hours of excessive delay, to the nearest tenth, experienced by all traffic traveling through all reporting segments in the applicable urbanized area for the full calendar year.
s = A reporting segment within an urbanized area (applicable reporting segment).
T = All reporting segments in the applicable urbanized area.
PHEDs = Total hours of excessive delay for all traffic traveling through applicable reporting segment "s" during the calendar year.
Total Population = the total population in the applicable urbanized area from the most recent annual population published by the U.S. Census at the time that the State Biennial Performance Period Report is due to FHWA.
The freight reliability measure (TTTR Index) evaluates truck travel time reliability (or consistency) on the Interstate System using the Truck Travel Time Reliability (TTTR) metric, which reflects the greatest unreliability level rather than congestion. The freight reliability measure is another national performance management measure (23 CFR Part 490 Subpart F).
Truck Travel Time Reliability (TTTR)
For each reporting segment, 15-minute interval truck travel times in the NPMRDS are ranked for each of the five time periods (see note below). Then for each reporting segment, the ratio of the 95th percentile to the 50th percentile of truck travel time (TTTR) is calculated for each of the five time periods.

Where:
s = A travel time reporting segment on the Interstate System.
i = A time period.
Note: Compute TTTRs,i for five time periods: 6:00–10:00 a.m. weekdays from January 1st through December 31st of the same year; 10:00 a.m.–4:00 p.m. weekdays from January 1st through December 31st of the same year; 4:00–8:00 p.m. weekdays from January 1st through December 31st of the same year; 8:00 p.m.–6:00 a.m. all days from January 1st through December 31st of the same year; 6:00 a.m.–8:00 p.m. weekends from January 1st through December 31st of the same year. Round each TTTRs,i value to the nearest hundredth.
Freight Reliability Measure (TTTR Index)
For each reporting segment "s", select the maximum of the five-period specific TTTRs,i values and denote this value as maxTTTRs. The freight reliability measure is computed to the nearest hundredth as follows:

Where:
s = A travel time reporting segment on the Interstate System in a State.
T = All travel time reporting segments on the Interstate System in that State.
SLs = Segment length, to the nearest thousandth of a mile, of Interstate System reporting segment "s".
maxTTTRs = The maximum TTTRs,i of the five time periods, to the nearest hundredth, of Interstate System reporting segment "s".
The Travel Time Reliability Measures are used to evaluate the reliability (or consistency) of travel times across the Interstate and non-Interstate NHS in accordance with 23 CFR Part 490 Subpart E.
The summary below outlines the traffic data elements (i.e., 15-minute increment travel times in the NPMRDS) used to calculate reliability measures for the Interstate and Non-Interstate NHS networks. This compares longer versus normal travel times, combined with vehicle occupancy, to determine the person-miles traveled on segments that are consistent and predictable. Reliability is based on the Level of Time Travel Reliability (LOTTR). The person-miles traveled on these reliable segments are then used to compute the performance measures.
Level of Time Travel Reliability (LOTTR)
Calculated by ranking average travel times recorded in 15-minute intervals from GPS-enabled probe vehicles. These intervals are grouped into four time periods (see note below) which are based on 23 CFR Part 490 Subpart E.
The 50th percentile represents the normal travel time, and the 80th percentile is the value below which 80% of observations fall. A segment is classified as a "reliable" segment if its LOTTR value is less than 1.50 in all four time periods.
An LOTTR for a time period of a reporting segment is computed as follows:

Where:
s = A travel time reporting segment on the National Highway System in a State.
i = Time period.
Note: Round LOTTR to the nearest hundredth. Time periods are the four NHPP periods defined as: 6–10 a.m. weekdays from January 1st through December 31st of the same year, 10 a.m.–4 p.m. weekdays from January 1st through December 31st of the same year, 4–8 p.m. weekdays from January 1st through December 31st of the same year, and 6 a.m.–8 p.m. weekends from January 1st through December 31st of the same year.
Travel Time Reliability Measure
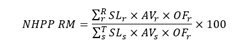
Travel Time Reliability Measures (to the nearest tenth of a percent) for the Interstate System or Non-Interstate NHS is computed as follows:
Where:
SLr = length of "reliable" segment "r" (nearest thousandth) for the highway system being considered (Interstate or non-Interstate NHS). A "reliable" segment is a reporting segment that has LOTTR values less than 1.50 for all 4 time periods.
AVr = annual traffic volume of "reliable" segment "r" . (= AADT * Directional Factor * number of days in the calendar year).
Directional Factor = factor for splitting AADT by direction (use 0.5 for two-way roadways and 1.0 for one-way roadways.)
OFr = average occupancy factor for vehicles on the "reliable" segment "r".
R = All Interstate or all non-Interstate "reliable" segments in a state (reporting segments with LOTTR values less than 1.50 for all 4 time periods).
SLs = the length of the reporting segment "s" (nearest thousandth) for the highway system being considered (Interstate or non-Interstate NHS).
AVs = annual traffic volume of reporting segment "s" . (= AADT * Directional Factor * number of days in the calendar year).
Directional Factor = factor for splitting AADT by direction (use 0.5 for two-way roadways and 1.0 for one-way roadways.)
OFs = average occupancy factor for vehicles on the reporting segment "s"..
T = All Interstate or all non-Interstate reporting segments within the state.
The rate of fatalities and the rate of serious injuries assess the number of traffic-related deaths and serious injuries for every 100 million vehicle-miles traveled (VMT), respectively. 23 CFR Part 490 Subpart B stipulates that the rates, of these two national performance management measures, are assessed on a five-year rolling average basis.
Along with the number of total annual fatalities and series injuries, the rate measures use all statewide public roads VMT from the FHWA Highway Statistics Series Table VM-2. The statewide total of annual VMT for all public roads is converted to a per-100-million-mile for the denominator for rate of fatalities and the rate of serious injuries per 100 million VMT.
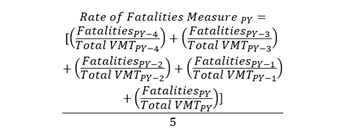
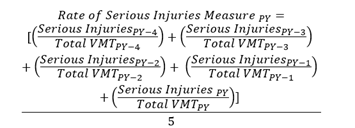
The rate of fatalities measure and the rate of serious injuries measure are computed (rounding to the thousandth decimal place) as follows:
Rate of Fatalities
Rate of Serious Injuries
Where:
PY = performance year (the current year being evaluated).
PY-1 ..PY-4 = the four prior calendar years.
Fatalities = annual total number of fatalities in a state.
Serious Injuries = annual total number of serious injuries in a state.
Total VMT = annual vehicle‑miles traveled per 100 million on all public roads in a state.





