U.S. Department of Transportation
Federal Highway Administration
1200 New Jersey Avenue, SE
Washington, DC 20590
202-366-4000
This case study examines the processes and technology used in Texas for designing a statewide traffic monitoring program. The State of Texas is the second largest U.S. State by area and population. With 254 counties, Texas has just over 311,000 centerline miles of roadways: 25.7% are State roadways (including highways and frontage roads), 47.3% are county roads, and the remaining 27% are city streets, including those functionally classified as local.
In accordance with 23 CFR 500, Subpart B, the Texas Department of Transportation (TxDOT) operates a traffic monitoring system for highways and public transportation facilities. The traffic monitoring system is based on the concepts described in the AASHTO Guidelines for Traffic Data Programs and the FHWA Traffic Monitoring Guide (TMG).
TxDOT was established in 1917 as the Texas Highway Department and charged with “getting the farmer out of the mud”. Within 20 years, it became obvious that information about the number of vehicles using the new roadways was crucial, so beginning in 1936, the Department embarked on an effort to capture this information in what is known today as a traffic monitoring system and traffic data collection program. The first district traffic count maps were published with information from traffic surveys conducted from August 1936 to August 1937, supplemented by short-term counts taken from December 1936 to May 1939 (actual months varied by district).
TxDOT’s Transportation Planning and Programming Division is designated as the Department’s single source for all traffic data. The Division collects traffic counts via various methods on all on-system roadways statewide. Count on many local and rural minor collector roads are also collected annually via the short-term count program.
TxDOT’s Traffic Monitoring System consists of continuous counter operations as well as short-term traffic monitoring, including pneumatic tube counts and manual classification counts. TxDOT has installed and maintains about 350 permanent, continuous traffic data collection sites that include collection of volume, classification, speed, and weight data.
Traffic data is used both internally and externally by countless end users and is routinely provided to TxDOT’s Commission, the Legislature, the governor, and the public. Data is used for a wide variety of purposes, including engineering design, engineering economy, environmental analysis, finance, legislation, maintenance, operations, planning, safety, and statistics.
TxDOT’s continuous counter operations include the installation, upgrade, repair, and maintenance of in-road traffic data collection hardware at about 350 permanent traffic data collection sites statewide. The sites include automatic traffic recorder (ATR), speed, automatic vehicle classification (AVC), long-term pavement performance (LTPP), and weigh-in-motion (WIM) data collection sites. TxDOT purchases and installs WIM systems in support of TxDOT’s WIM Strategic Plan.
Actual installation of roadway infrastructure is dependent on local district construction schedules. Efforts are coordinated with TxDOT’s 25 districts and four regions to meet Federal, State, and local needs, and the system continues to expand at the rate of approximately two new sites per month on average. Where good signal strength is available, TxDOT installs wireless modems rather than using landline communications.
Traffic data is collected remotely via telemetry from permanent traffic data collection sites statewide. The collected and analyzed data is used for producing traffic maps, forecasting future traffic volumes, estimating the frequency of application of wheel, axle, and gross vehicle weight loads on Texas highways, and developing pavement and bridge designs.
TxDOT administers and monitors the work of a contractor who collects on-system traffic data and off-system saturation count data in urban areas, including county roads and city streets throughout Texas. Approximately 75,000 to 85,000 counts are conducted annually. Saturation counts account for approximately one-third of the overall counts, and TxDOT coordinates internally and with metropolitan planning organizations (MPOs) to accommodate State and local needs. Collected data is used to assist in forecasting future traffic volumes
Pneumatic tube data is also collected by in-house personnel on an ad-hoc basis to meet the volume and classification data needs of special projects, corridor analyses, and travel demand modeling development.
The TMG recommends a three-year cycle with 48-hour counts to be effective without unreasonably affecting reliability and addresses the possibility of a five-year cycle by noting that the potential error from a compounded average growth rate can exceed the daily volume variability. In the mid-1990s, the variability of even a three-year cycle was of concern, so TxDOT requested and received approval from FHWA to alter the traffic data collection methodology to collect all on-system data annually with 24-hour counts and to collect off-system data on a five-year rotating cycle. As Texas is a large state, the financial impact is substantial but the modified methodology is more cost effective, and having actual ground truth data from on-system roadways on an annual basis has been valuable. For example, the vehicles miles traveled (VMT) trends are being tracked more accurately.
For many years, TxDOT conducted the pneumatic tube counts with both in-house equipment and in-house personnel. Beginning in the late 1980s, TxDOT contracted out the data collection, but the contractor still used TxDOT equipment. With the award of the latest contract in January 2011, the contractor is responsible for obtaining, maintaining, repairing, and calibrating the data collection equipment. The primary reason TxDOT made the decision to make this contractual change was due to in-house staffing issues.
TxDOT administers and monitors the work of a contractor who collects vehicle classification information relative to the numbers and percentages in the traffic stream based on the FHWA 13 vehicle category classification system. The detailed information of the number of vehicles of different sizes and operating characteristics is critical when planning, designing, constructing, and maintaining the State highway system.
For many years, TxDOT conducted the manual classification data collection with in-house personnel. Beginning in the mid-1990s, with the success of the pneumatic tube services contracts and the continued staffing issues, TxDOT contracted out the manual classification data collection.
TxDOT currently uses both the Diamond Traffic Products Unicorn Limited and the International Roadway Dynamics (IRD) Model ITC as portable road tube classifier/counter equipment for collecting axle and classification data. As noted later, the Trimble Nomad is used to collect GPS data, and the Trimble TerraSync software is used to process the Trimble data files. TxDOT’s manual classification contractor uses MioVision Technologies for video data collection.
For continuous counter operations, TxDOT currently uses IRD Model ITC rack mount equipment to collect volume and classification data with loops and Measurement Specialties Brass Linguini (BL) Sensors. For WIM, TxDOT uses both the IRD/PAT Model 190 and IRD iSync equipment with bending plate and Kistler sensors.
TxDOT processes and analyzes statewide and metropolitan area traffic data to meet the needs of the Highway Performance Monitoring System (HPMS), MPOs, and other States. The traffic data certified on an annual calendar basis includes continuous vehicle counts (ATR), 24 hour pneumatic tube axle counts (Accumulative Count Recorders (ACR)), automatic vehicle classification (AVC), speed, and weigh-in-motion (WIM) counts.
Quality control measures ensure that accurate traffic data is available for the publication of traffic maps and reports, the certification of vehicle miles traveled (VMT), the forecasting of future traffic volumes, geometric design, pavement design, urban transportation assignments, and special studies. Special counts are analyzed and used for calculating traffic data estimates and projections and for developing engineering change recommendations.
TxDOT currently uses the Statewide Traffic Analysis and Reporting System (STARS) and is in the process of pursuing enhancements for the traffic data analysis systems. Maps are developed and maintained using ESRI ArcGIS.
TxDOT’s annual district traffic, urban saturation, and statewide flowband maps for traffic and trucks are available in PDF format via TxDOT’s website.
Annually TxDOT also produces an automatic traffic recorder (ATR) report and vehicle classification report that are graphically represented in report format within a MS Excel spreadsheet.
TxDOT currently maintains and monitors about 350 permanent traffic counters statewide.
With in-house personnel, TxDOT developed a new software program in three phases to improve the pneumatic tube short-term count program.
Phase 1 – Develop an off-the-shelf system to collect data that incorporates bar coding for the station information and a standard tube counter that produces a standard printer (PRN) file. The developed system uses the Trimble Nomad, through a template that captures bar coding, GPS, and contractor / TxDOT inspector information.
Phase 2 – Create a site-scheduling program in ArcGIS. This scheduling feature allows a TxDOT technician to view the sites through a map-based system. After all the stations in a district have been scheduled, the schedules can be displayed individually or by district, and the schedules are subsequently converted into PDF files and provided to the contractor. Each file contains bar coding information for each site and a map for each station location.
Phase 3 – Create an acceptable count program that imports the bar coding and PRN files from the contractor and TxDOT inspectors into a database. This data is screened using 29 pre-defined data error checks. For example, stations are reviewed to verify that the actual GPS collection points are within 500 feet of the original map location. After the data is screened, two reports are generated. The first report includes the accepted counts by schedule number, and the second report included detailed information of the rejected counts. Both reports are sent to the contractor for invoicing.
Historically, for the Manual Classification Data Collection Program, individuals would work in crews with each taking a block of time of the 24-hour count period, and the individuals would be stationed on site collecting the data in real time. With the most recent contract award in August 2010, the contractor proposed and TxDOT Administration approved the use of video technology to record the 24-hour count period. Then, the video is counted manually by the contractor at a later time. Gaining approval for such a paradigm shift regarding operations was an accomplishment that resulted in several advantages to TxDOT:
This case study examines how the statewide traffic monitoring program at the Idaho Transportation Department (ITD) supports business needs and how the program is used to comply with Federal traffic data reporting requirements. Idaho was selected to represent the group of small state DOTs, in terms of centerline miles, as an example of best practices in the development and use of a traffic monitoring program.
The Division of Highways, Roadway Data Section (RDS) is responsible for managing the traffic program, including the collection, analyses, reporting, and retention of statewide traffic data and the management of the traffic related databases.
The Roadway Data Section accomplishes this goal by managing traffic-related databases, as well as locating, designing and installing traffic counting sites statewide, and utilizing automatic traffic recorders (ATRs) and short-term count devices. Ultimately, the RDS analyzes and presents the data to a broad variety of clients – ranging from the Federal Highway Administration (FHWA) to public consumers.
Idaho began its automated traffic monitoring program in the early 1950s with the installation of the first ATR in the state. Currently, the RDS maintains approximately 225 permanent data collection sites. The majority of these sites collect a variety of classification, volume, and count data, while 26 sites specifically collect Weigh In Motion (WIM) data. Additionally, each year ITD lays down over 2,200 portable counts at more than 600 stations. The Roadway Data Section maintains all of the ATR and portable count equipment, collects the data, and processes it into a readable format. This information is available to internal and external customers.
ITD utilizes the TMG as a blueprint for its traffic monitoring program. From that foundation, the department has integrated other guidelines and established a network of traffic devices and processes. These processes determine everything from the frequency of collection to the methods of reporting, and they have been developed over the years to reflect the needs of ITD and its customers. Ultimately, The Roadway Data Section collects and processes this data in order to meet ITD internal and external needs, such as State and Federal reporting.
A multitude of reports are eventually made available to clients of the Idaho Transportation Department. Many reports are posted to the ITD website, while other detailed information is formatted and submitted electronically to meet FHWA requirements.
Clients of this data can include municipal planning organizations (MPOs), local highway districts, FHWA, law enforcement, and others. ITD strives to create an atmosphere of participation when it comes to working with other agencies. In fact, the department works with other States and highway districts frequently to provide comprehensive and consistent information sharing
For example, Ada County Highway District (ACHD), which maintains the roadway system for the largest urbanized area in the state, routinely provides speed and/or volume data. At the same time, ITD provides ACHD with copies of the ITD portable count schedule. This allows for coordination between the two agencies, and reduces redundant data collection.
This section discusses the business processes, equipment, and information technology (IT) tools that are used with the ITD traffic monitoring program to support data collection, analysis, and query and reporting functions.
Statewide traffic data collection within Idaho follows a well-established, pre-determined order of business. It begins with equipment maintenance before each collection season, followed by scheduling and collection. The process continues with data processing and analysis, and results in reporting. Some activities occur throughout the year, such as continuous count collection and ATR installation and maintenance. All of these factors go into planning each year’s business needs.
Since its inception, the TMG has been used by ITD as an outline for comprehensive traffic monitoring. In addition, other sources (from other FHWA programs to vendor processes) complement the TMG and enhance Idaho’s processes for monitoring and validating statewide traffic data. Ultimately, more than just the TMG provide a means for assuring and controlling the quality of data being reported by Idaho.
ITD collects traffic volume data at sites statewide. There are approximately 225 permanent traffic counting sites in Idaho using ATRs. Weigh-in-motion (WIM) data is collected at 26 permanent WIM stations statewide.
ITD uses four primary equipment vendors for collecting statewide traffic data:
Most commonly, ATR sites collect speed and length data by bins. Straight volume collection occurs next in frequency; and individual vehicle data is collected third in order of frequency. The selection of data types for each permanent ATR site is based on various criteria, including roadway geometry, vehicle volumes, and the availability of power and phone at the time of installation.
New sites are added each year, and the locations are largely determined by special request and funding from the districts.
The RDS uses several tools to perform collection activities. For short-term counts, the mainframe is used to start the information technology step of collection. On the mainframe, schedules are built for each field person and are printed out for them to take into the field. Then an internally developed DOS application (IDASITE) is used to generate a file that contains pertinent information about the location and geometry of each scheduled count. This file is sent out with the field personnel.
In the meanwhile, Geographical Information Systems (GIS) are used to create maps of where the collection should occur. The maps specify where the station and HPMS sample collection should occur, and are saved as PDF files. They provide the field personnel with a practical reference to use in the field. The field personnel then use the IDASITE software to load up the IDASITE files they received. Specific information about the location and the data collection filename are then tied to that original IDASITE file, and it is sent back into the office along with the data file for processing. Office personnel then tie all of this data together and load it into the recently implemented TRAfficDAta System (TRADAS).
Meanwhile, a series of modems are used to retrieve ATR data on a nightly basis. This continuous data is placed in TRADAS, thus making TRADAS the central storage system for traffic data collected by field personnel and by the ATRs.
ITD uses traffic data for many analysis scenarios, and also uses a multitude of platforms and applications. In the mainframe environment, SAS is primarily used for analyzing data and preparing data for reporting. Meanwhile, ITD utilizes in-house software applications, SAS for Windows, MS Excel, and other tools to analyze data in a MS Windows environment.
For example, the vehicle miles traveled (VMT) is calculated using mainframe SAS, and then exported to the Windows environment where Microsoft Excel is used for final analysis. With the implementation of the new TRADAS system, and the general move away from the mainframe platform, more and more analysis will be done in the future using Structured Query Language (SQL).
Many tools are currently available to report traffic information. On the mainframe, several SAS jobs provide reports, including volume and classification reports. Furthermore, analysts are able to query the data in order to perform quality assurance steps. In the future, however, the data will be migrated to a Microsoft Windows client environment.
The newly implemented ITD Traffic Asset Management System (TAMS) intends to link count data to location in order to merge the two types of data – pavement and traffic. This allows for greater power in comprehensively reporting the state of the roads. TRADAS will be the source of count data, while TAMS becomes the source of count locations, thus moving from the mainframe environment; TAMS will generate reports to internal ITD users. The department’s website will continue to provide data to outside users.
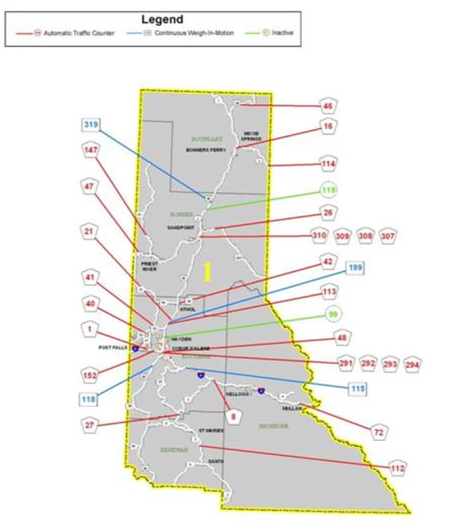
There are a wide variety of reports available to external customers as well, particularly for WIM and ATR data. These reports include monthly, annual, and specialty reports that can be accessed and downloaded from the ITD website. The reports are illustrated in Figures D-1 through D-3.
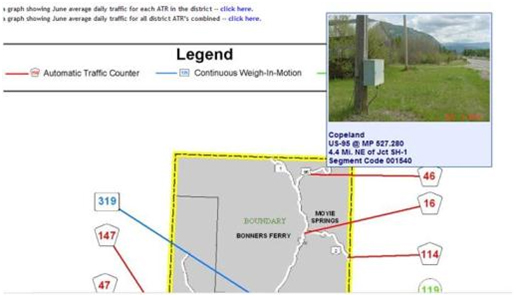
Figure D-1 is a map of District 1 in north Idaho. This map identifies the locations of ATR sites (pentagonal shape), Weigh-In-Motion sites (rectangular shape), and sites that are inactive (circle shape). By selecting a site with the cursor, as illustrated in Figure D-2, a picture appears, with information about the location of the specific permanent ATR site (#46). The location information displayed includes the route-milepoint, distance from intersecting route(s), and segment code ID.
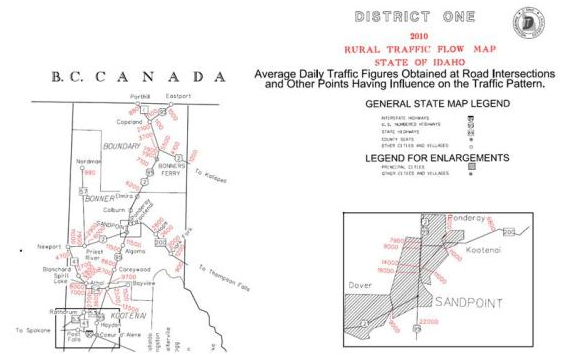
Also included in Figure D-4 is an example of a Flow Map that ITD publishes on its website. This series of maps shows Average Annual Daily Traffic (AADT) at points on the rural state highway system, as well as the entire interstate system. These maps provide an overview of traffic flow throughout the interstate and rural state highway system in Idaho. District-specific maps are also available. Furthermore, commercial maps show the flow of commercial traffic through the State. Figure D-4 shows a partial view of District 1, between Coeur d’Alene and the Canadian border.
NORTH IDAHO
Source: Idaho Transportation Department.
ATR #46
Source: Idaho Transportation Department.
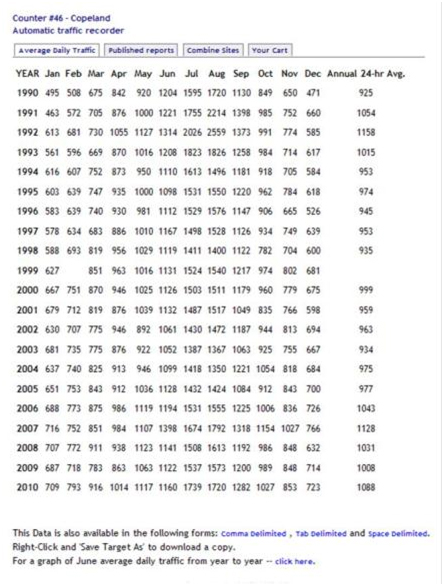
By clicking on the permanent site #46, a tabular report appears as illustrated in Figure D-3. This report includes average daily traffic for each month and an annual average daily traffic count over a multi-year period. This data is also available in comma delimited, tab delimited, and space delimited formats as noted at the bottom of the report.
SITE #46
Source: Idaho Transportation Department.
Source: Idaho Transportation Department.
Because traffic monitoring is such a specialized industry, the software needed can often be specialized as well. ITD has developed a multitude of specialized tools to schedule, collect, analyze, and report data. Some software has been around for many years (such as IDASITE and a host of SAS programs), while other systems have come online much more recently (such as ITD’s customized version of TRADAS).
Even as technology changes and the software itself changes to meet the changing requirements, the process itself remains sound. For example, as ITD moves away from the mainframe environment, the IDASITE software will be moved as well. However, because the business requirements are being met efficiently, only some minor software changes will be made in order to reflect the new environment. The manner in which the software is used will not change. The business of maintaining, collecting, analyzing, and reporting will continue to follow established business practices.
With the implementation and further development of the newly installed TRADAS, customized reports are expected to become more easily produced ad hoc and opportunities will arise to provide more information in a web environment.
Over the years, personnel, technology, and processes have changed. ITD has learned a few lessons along the way. These lessons include challenges associated with implementing a traffic monitoring program, and recommendations for how to address the challenges. ITD’s experiences offer practical guidance to similar sized State DOTs in enhancing their traffic monitoring programs.
There are two main areas where ITD has learned important lessons in maintaining an effective traffic data collection and reporting business model. The first involves strong cooperation and coordination of work, and the second involves a strong business process around testing.
The State of Idaho is largely unpopulated and primarily rural in nature. With only six urbanized areas and a handful of small urban areas, the majority of roads are rural in character and location. This makes gathering traffic data more time-consuming and difficult, because the portable counters take time to set up and maintain for the required 48 hour counts; not to mention that it could take a field person hours to get to the location. Add into these limitations the seasonal issues that occur. Forty eight hour short term counts can only occur for eight months out of the year in the southwest portion of the State (the desert region), with significantly shorter periods in the more mountainous regions in the northern “panhandle” and the east.
With limited personnel and time, the Roadway Data Section has spent a great deal of time trying to develop the best methods for scheduling portable counts and sharing information. By doing so, ITD can gather data more efficiently and provide a more comprehensive look at traffic in the State of Idaho. The Roadway Data Section continues to examine new technologies, never shrinking away from the ever-growing data requirements of the State and Federal government.
ITD has learned that by working cooperatively with others in the transportation industry, knowledge can be more comprehensively obtained and shared. Because ITD works with other groups, such as Ada County Highway District (ACHD), the Washington Department of Transportation, and others, data collection redundancy is reduced greatly through increased schedule coordination.
In previous years, the HPMS Coordinator simply provided a list of sections to the traffic monitoring group, broken down into three collection years. The person responsible for scheduling followed that list for each year. In scheduling portable counts, the Roadway Data Section has worked with Idaho’s HPMS Coordinator and established a more integrated method of scheduling.
Finally, the personnel in the field and the personnel in the office maintain close contact. Those who go out into the field routinely call into the office should questions arise, and the Roadway Data Section treats any calls from those out in the field as high priority. This close contact allows for a quicker resolution of any issues or concerns. It also makes the entire process from scheduling to collection to analysis cohesive.
The common thread is communication inside and outside of ITD. Because of information sharing, ITD maintains a consistent traffic monitoring system.
The Roadway Data Section spends a great deal of time and effort in maintenance-level and implementation-level testing. Maintenance ATR testing is exactly what is implied – maintenance checks are routinely run on counters to verify their accuracy. The field personnel perform manual counts, while the corresponding ATR collects volume data. The manual and continuous data are analyzed in the office to verify no systemic issues exist.
Field personnel perform manual checks against classifier sets. This acts as a refresher on setting classification counters and also verifies that the classifier hardware works prior to the traffic collection season starting. These ongoing maintenance tests occur regularly and are an integral part of how ITD does business.
Implementation testing tends to be more limited, because it revolves around the implementation of new software systems or types of hardware. The organization spends a great deal of time reducing the risk of failure by testing for as many potential issues as possible. By spending time testing, ITD assures a lower chance of systemic issues affecting the business processes from collection to reporting.
The Roadway Data Section has several short-term and long-term enhancement goals. They revolve around integration and development of the newly implemented systems and technologies.
Short-term enhancements will include integrating TRADAS data with the pavement management system implemented in the winter of 2010. At the same time, ITD’s Location Referencing System will also be implemented in the pavement management system, making the data streamlined, cohesive, and complete
The long-term enhancements include developing new reporting systems and tools. Standardized reports outside of those within the TRADAS software will be developed for more customized analysis. Ad hoc reporting tools will need to be implemented to handle specialized requests for information. Both of these are currently being researched, and business processes developed.
Besides these specific long- and short-term goals, the ITD recognizes that more changes will be occurring over the next few years. With reporting requirements changing on a more frequent basis, and technology rapidly advancing and changing the very environment in which data is stored and analyzed, the Roadway Data Section has been working towards developing a system that can handle unforeseen developments. This flexibility leaves the door open for more enhancements and refinement of existing systems in the future.
This case study discusses the state data sharing activities of short term traffic count data between the Colorado Department of Transportation (CDOT) and local agencies in Colorado. This program has incorporated volume counts from vehicles as well as pedestrian and bicycle counts. This traffic data are submitted to CDOT and then incorporated into CDOT’s traffic database and shared through a web traffic data application.
The Traffic Analysis Unit (TAU) is responsible for the development and maintenance of the traffic monitoring program at CDOT. During the fall of every calendar year, TAU staff begins the process of contacting various local agencies for the submittal of their traffic data to CDOT. These local agencies include cities, counties, and metropolitan planning organizations (MPOs). Data must be submitted to CDOT by December 1 of every year in order for CDOT staff to have sufficient time to convert and submit the raw traffic data. Once traffic data is sent to CDOT, TAU staff converts the data into a TRADAS-readable format and submits and processes the data through TRADAS for incorporation into the traffic database. TRADAS then incorporates monthly, seasonal, and axle factors calculated from automatic traffic recorders (ATRs) into the raw count to calculate an AADT for that segment of road. Once annual traffic processing phases are completed, a statistically calculated or unofficial AADT is produced by TRADAS. These numbers are then rounded to produce a published or official AADT.
The official AADT produced by CDOT is then able to be shared to local agencies through a web traffic data application called AVID. AVID allows traffic data to be seen spatially, incorporated from various data sources, analyzed once data is loaded into the traffic database, and shared within CDOT and external agencies. Traffic data given by local agencies to CDOT must also submit a latitude/longitude for each count in order for the data to be shown spatially in AVID. For the raw traffic counts that local agencies submit, they are given in return a statistically calculated AADT. This traffic data can be downloaded by local partners from the AVID website without waiting on a response from TAU staff.
The use of sharing data through local agencies has been a tremendous asset to CDOT. During the annual Highway Performance Monitoring System (HPMS) submittal, there have been several HPMS sections that were flagged by CDOT staff due to significant changes in the AADT. With the counts collected both by CDOT and local agencies on these sections, TAU staff was able to defend the significant changes in AADT by showing two counts that were collected in the same section of road by two different agencies in the same year. Traffic counts by local agencies on CDOT highways have also been used in the development of the annual traffic file that CDOT produces for CDOT owned and operated highways. CDOT had collected a count in the City of Longmont on a CDOT-owned highway that was nearly double that of a count that was collected by Longmont traffic engineering staff. When looking at nearby traffic sections and historical AADTs, it was determined that the count collect by the City of Longmont was more accurate than the CDOT collected count.
There has also been considerable cost savings by CDOT from the submittal of traffic data from local agencies. Since 2008, CDOT has received 3,946 short-term counts from local agencies. With the average cost of a short-term count by CDOT’s contractor being $100, the cost savings from the data sharing program have been approximately $400,000.
There were several lessons that were learned in the development of the data sharing program at CDOT.
This case study illustrates how the sharing of traffic data is accomplished from the perspective of a local agency, represented by the Delaware Valley Regional Planning Commission (DVRPC). The types of traffic data shared include Annual Average Daily Traffic (AADT) volume and classification counts for vehicles, as well as pedestrian and bicycle counts.
The Delaware Valley Regional Planning Commission (DVRPC) is the Federally designated Metropolitan Planning Organization (MPO) that serves the greater Philadelphia region. The region includes nine counties, five of which are located in Pennsylvania and four counties that are located in New Jersey. DVRPC’s responsibilities include planning for the immediate and long-term transportation needs in the region. The MPO relies on partnerships and sharing of data and information with the Pennsylvania Department of Transportation (PennDOT), New Jersey Department of Transportation; county and local governments; and regional transportation providers in order to develop the Long-Range Transportation Plan and the Transportation Improvement Program (TIP). One of the most important types of data shared between agencies is traffic data, which is used for assessing environmental impact to the region, addressing congestion, and managing projects to preserve and maintain the existing transportation infrastructure.
DVRPC has also taken a leadership role in Transportation Operations (TO) by providing a forum in which a comprehensive Transportation Operations Master Plan has been developed for the region. While implementing the Master Plan is the responsibility of individual agencies, the plan identifies the services and projects that support ITS and operations in the region.
Data sharing is also exemplified by the Regional Integrated Multi-Modal Information Sharing (RIMIS) project. This is an information exchange network oriented to traffic and transit operations centers, state police, county 911/emergency management agencies, and local emergency responders. Its primary objective is to provide situational information about incidents, maintenance and construction activity, and special events that impact the transportation system. In addition to event information, RIMIS is a common platform to distribute CCTV images, and eventually VMS messages and traffic speeds.
The next section explores the technology and tools that are used for sharing traffic data in the Delaware Valley region.
The primary tool used for sharing traffic data is referred to as Traffic Count Viewers. These viewers are available on the DVRPC website. The traffic viewers are connected to the traffic count database, so that when counts are entered or updated in the database, they appear on the website and are accessible to the public. Figures D-5 through D-7 illustrate the basic functionality of the Traffic Count Viewers, which incorporates components including Google maps and tabular reports.
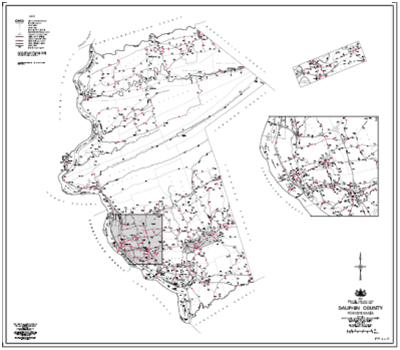
Figure D-5 shows the map of the region prior to the overlay of traffic count locations
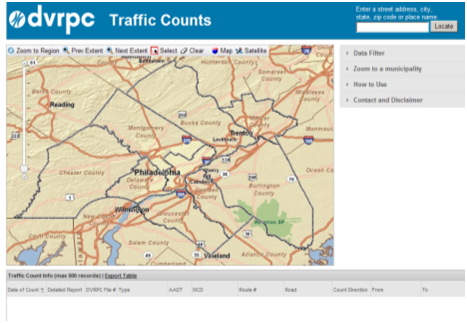
Source: Delaware Valley Regional Planning Commission.
Figure D-6 illustrates the map of the region with the overlay of traffic count locations, indicated by the dots on the map. These dots represent counts taken between 1995 and the current time. A slide bar feature on the left side of the map allows the user to zoom in/out within the map window. Selection options are located to the right of the map. These options include the following:
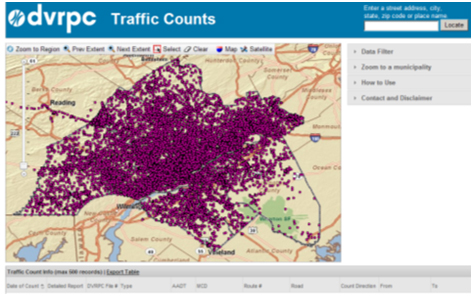
Source: Delaware Valley Regional Planning Commission.
Figure D-7 illustrates the type of report that is generated when the ‘select’ option is used for two traffic count locations on Wissahickon Avenue between Hortter Street and Westview Street. This figure also shows the report that is generated with information including the date of the count(s), the Annual Average Daily Traffic (AADT) at the location, the road where the counts were taken, direction counted, and “from” and “to” limits (intersecting roads) of the counted road segment
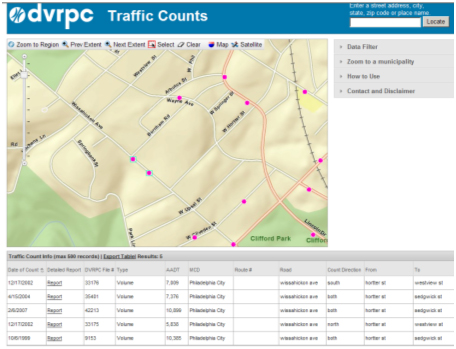
Source: Delaware Valley Regional Planning Commission.
Choosing the “Detailed Report” for a specific count generates a report for that count that contains further location information, the hourly count detail, factors used to calculate the AADT and the a.m. and p.m. peak hour information. In the Figure D-7 example, choosing the count taken 12/17/2002 generates the report shown in Figure D-8.
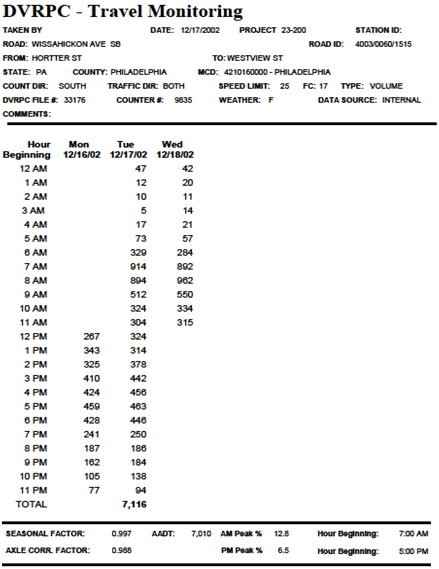
Source: Delaware Valley Regional Planning Commission.
Pedestrian and bicycle counts are also provided on the Traffic Count Viewers. Figures D-9 through D-12 illustrate how the pedestrian and bicycle count data is displayed on the map and how reports can be generated for this type of data. When the viewer is first opened, a window appears providing a disclaimer, instructions on use, and contact information for pedestrian and bicycle counts.
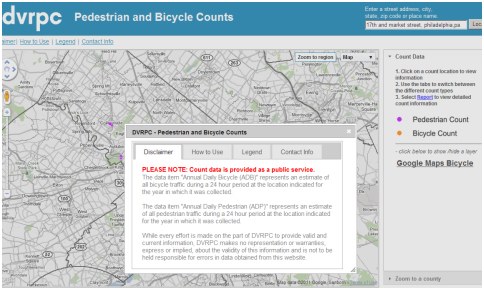
Source: Delaware Valley Regional Planning Commission.
Behind this information box, a map is displayed with dots to represent locations of pedestrian and bicycle counts. A link on the right side of the map adds the Google bicycle facilities in the region to the map.
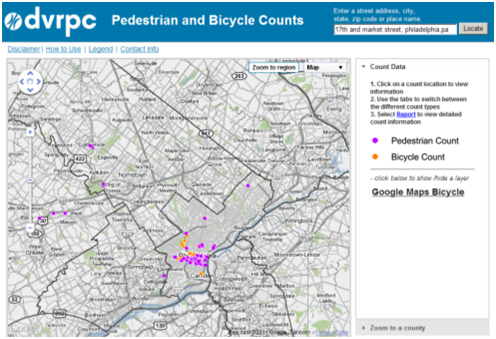
Source: Delaware Valley Regional Planning Commission.
A location on the Walnut Street Bridge between Center City, Philadelphia and University City was selected for purposes of illustration in Figure D-11.
WALNUT STREET BRIDGE; FROM SCHUYLKILL AVENUE TO 23RD STREET
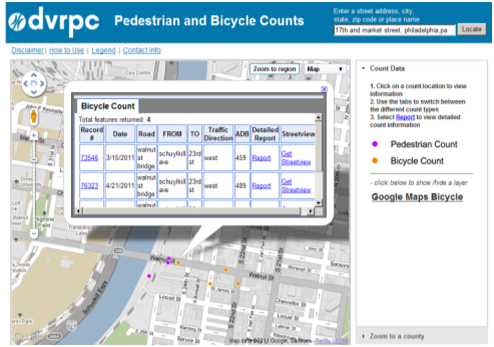
Source: Delaware Valley Regional Planning Commission.
The above figure illustrates the bicycle counts taken on the Walnut Street Bridge (from Schuylkill Avenue to 23rd Street). Similar to the case with the traffic viewer, the table provides a summary of the date of count (usually the first full day of data in a weeklong count), facility, limits of the counted segment, direction of the count and the average of the daily counts within the particular record. An additional function provides a link to Google Streetview so the user can see a street view of the count location.
A detailed report can also be generated for this location, as illustrated in Figure D-12. This report includes further detail of the location, hourly counts during the week that the count was taken, and an average of counts from complete days.
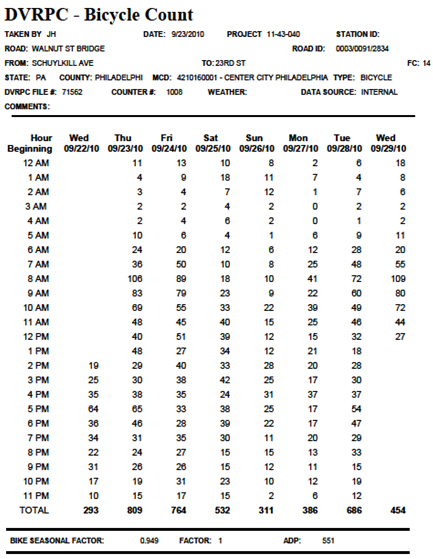
Source: Delaware Valley Regional Planning Commission.
The next section discusses the role of the data-sharing partners in the exchange of traffic data and information.
DVRPC is not the only entity collecting traffic count data. Consultants regularly collect traffic count information in the preparation of development proposals, etc. The availability of count information from highway operations staff via many forms of technology (loosely grouped as ITS) is growing and will play an increasingly prominent role in the data field. Even private sector entities such as Traffic.com (NAVTEC) are gathering count as well as speed data. All of these varied entities benefit when this data is brought together in a central location accessible to all data users. In DVRPC’s database, all traffic counts - no matter the source - are given equal value. On the traffic count detail report, the field “Taken By” identifies the source of the count.
In order to be effective as a source of data, all data must be put through a series of quality control checks. For counts taken by DVRPC staff (approximately 3,000 per year), the field sheet lists the previous two counts at a location. The new count must fall within a certain percentage of historical data or the count is flagged. When this situation arises, barring a reasonable explanation for the variation, the count is scheduled to be retaken. When a location has not been previously counted, nearby counts provide guidance. For counts submitted by traffic counting partners, the same procedure is performed. But when a count falls outside an expected range and no reasonable explanation for the variance is forthcoming, the count is rejected for inclusion in the database.
The primary purpose of using the Traffic Count Viewers is to increase the efficiency of the data collection process. This helps to eliminate duplicate data collection efforts and to support the concept of “collect data once, use it many times”.
There are many advantages to this partnership for all providers and users of traffic data, from both the local agency and the state perspective. Several of these are listed below:
This case study illustrates how the sharing of traffic data is accomplished from the perspective of a state Department of Transportation, represented by the Pennsylvania DOT (PennDOT). The types of traffic data shared include Annual Average Daily Traffic (AADT) volume and classification counts for vehicles and other types of traffic data shared by PennDOT.
The Bureau of Planning and Research (BPR) is one of 25 bureaus and offices under the Pennsylvania Department of Transportation (PennDOT). BPR’s Transportation Planning Division, Traffic Monitoring Section, is responsible for the development and maintenance of the State’s portable and permanent traffic counting programs. The Bureau partners with Metropolitan Planning Organizations (MPO), Rural Planning Organizations (RPO), PennDOT Engineering Districts, and vendors. Data that is provided to BPR by those agencies and companies are used for Federal Highway Administration (FHWA) reporting, congestion management, air quality, pavement design, and development of traffic factors. Over the years, several applications and tools have been developed to assist with timely submittal of traffic data, easy viewing of traffic data for both the public and counting partners, and quick and accurate reporting.
The main way traffic data is shared is through the Internet Traffic Monitoring System (iTMS). Figures D-13 through D-16 show the functionality of iTMS. Users can search for traffic data by ten different categories that are listed below:
Figure D-13 shows the initial map when querying a county.
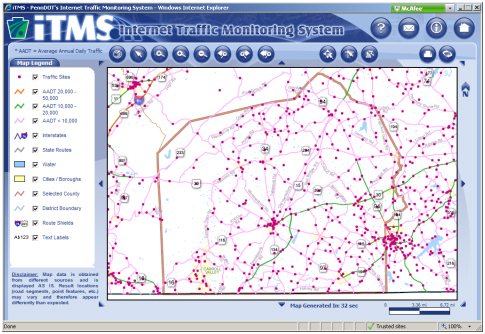
Source: Pennsylvania Department of Transportation.
Figure D-14 illustrates the county map after the user zooms into a specific area. The purple dots represent the area where the traffic counts were collected. All data displayed on the iTMS website is current traffic data. An interactive legend displays on the left of the page, as well as a toolbar across the top of the map. Users can filter what information they would like to display by turning on/off the map icons.
FIGURE D-14 SPECIFIC TRAFFIC COUNT LOCATION
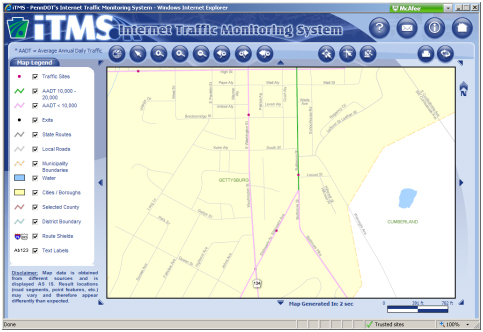
Source: Pennsylvania Department of Transportation.
Figure D-15 displays what type of information the user can expect when selecting the specific site location. The AADT, count frequency, count year, and latitude/longitude are also shown among other information. The user also has the ability to print the information or to go to PennDOT’sVideolog application.
FIGURE D-15 SITE SPECIFIC INFORMATION
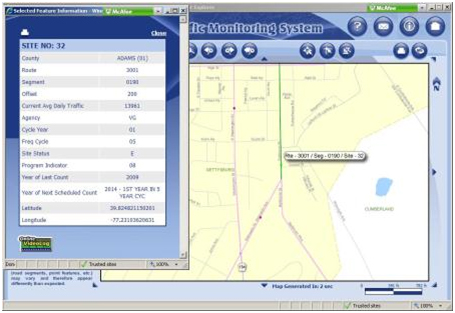
Source: Pennsylvania Department of Transportation.
Figure D-16 displays other information for the site’s limit. Some of the information displayed is the specific traffic data including AADT or the ADTT (Average Daily Truck Traffic).
FIGURE D-16 LIMIT SPECIFIC INFORMATION
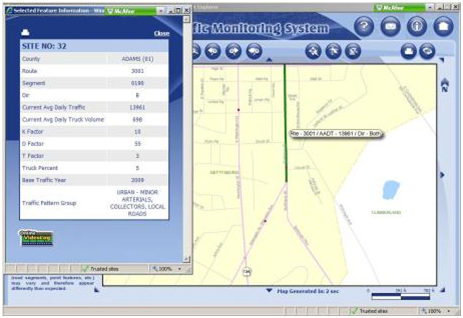
Source: Pennsylvania Department of Transportation.
Traffic Volume Maps and Permanent Site Location Maps:
The traffic data is shared with the public through the Bureau’s traffic volume maps. Statewide and county traffic volume maps (Figure D-17) are generated each year and are accessible for the public to view through PennDOT’s website. (www.dot.state.pa.us) The Statewide traffic volume map displays AADT’s for all interstates, U.S. and PA routes across the State. The county maps display the AADT’s for all State-owned roads in the specific county.
FIGURE D-17 COUNTY TRAFFIC VOLUME MAP
Source: Pennsylvania Department of Transportation.
Permanent traffic sites maps, which show locations and specific information for each of the department’s permanent traffic sites are updated each year and can be found on the Department’s website. Maps are available by district or county. The maps are used by in house field staff and are also provided to PennDOT Engineering Districts as a reference when planning construction projects. Since the Districts were provided the maps, the Bureau has been able to have permanent sites reinstalled during construction projects. In the past, the sites were destroyed during construction and never replaced.
A second form of data sharing is the internet Traffic Data Upload System (iTDUS). iTDUS is a website that allows our traffic counting partners to submit their data quickly and more accurately. The previous traffic data upload system application was a desktop application. Each year the Bureau mailed out each partner’s counts on a floppy disk, which the partners then loaded to the software. Collected raw traffic count data would then be submitted to the Bureau either on floppy disks or via email. Traffic analysts would then have to manually verify the raw data formatting before submission into PennDOT’s mainframe system, Roadway Management System (RMS).
iTDUS has automated error checks for formatting before the data files are entered into the database. The user is notified immediately if the file does not meet the submittal format. Traffic Counting Partners are now able to submit a site in less than one minute and the analyst can review the site right after submittal where previously it would take up to a week to get the same file checked and ready for the mainframe.
Another form of data sharing is the Automatic Traffic Information Collection Suite (ATICS). ATICS is a web portal that allows the Bureau to generate Station Cards (SCard), Volume Cards (Card3), Class Cards (CCard) and Weight Cards (WCard) for monthly permanent data submittals in minutes compared to hours in the previous application. ATICS also has an ad hoc reporting feature. Currently the web portal has 16 reports using the data from the State’s permanent sites. Most of the reports are used for requests such as AADT, AADTT, Volume Detail, and Class Detail among others. Some are used for factors that are stored in RMS and displayed in the Bureau’s traffic data book (PUB 601). The last two reports are used with the Bureau’s quality assurance program of the State’s permanent sites. Manual and tube counts are entered into ATICS; these reports compare the permanent data to the portable data. This program helps the Bureau know how the sites are performing.
As stated before, the Bureau receives data from MPOs, RPOs, PennDOT Engineering Districts, BPR field staff, and vendors. All of the traffic counts are collected with guidelines that each vendor, agency, and State employee follows.
The MPOs and RPOs are under agreement with the Department through the Unified Planning Work Program (UPWP). The UPWP specifies the number of counts and due dates the agencies are required to collect and the MPOs and RPOs are paid accordingly. Each year the Planning Partners are given a traffic count packet and are required to submit the data through iTDUS by a specified date
The Department has a Statewide Traffic Counting Contract that is used as a supplement for collecting traffic count data. After all of the Planning Partners, PennDOT Engineering Districts, and Bureau Field Staff are assigned counts, the remainder of the counts are assigned to the vendor. There is no set amount of counts for each vendor every year. The vendor is paid for only accepted data. If a traffic count is rejected, the vendor is notified. The vendor has the option of resetting the count
The partners play a significant role in data collection. Without the partners there would not be the quantity of accurate data to be able to display on the websites and report to FHWA.
The Bureau has created two websites that has not just helped the Bureau, but, also the agencies that use those websites.
The internet Traffic Data Upload System (iTDUS) enables the partners to submit data quickly and more accurately. It has allowed for quicker upload of the raw data and quicker download for the analysts to get the counts into the mainframe system. With the built in error checks in iTDUS, the system has removed the hours of manual checking the analysts previously did with the desktop version. The website has built-in reports for agencies and analysts to see what data has been submitted. This feature was not available in the previous version. The capability of the report feature means less time for the traffic analysts to verify that all the data was provided to the Bureau.
The Automatic Traffic Information Collection Suite (ATICS) web portal allows the traffic analysts to provide permanent data more quickly. The Bureau generates monthly permanent data submittals in minutes, compared to hours in the previous application. The reports now provide more data to a wider range of business areas. The quality assurance section allows the Bureau to see how the permanent sites are working. The configuration of each site is shown on one page within the portal. Previously the traffic analyst would have to update information through two applications on multiple pages. Along with the monthly submittals; the reports, station configurations, and quality assurance links have saved the Bureau hours in manual work. This allows the traffic analysts more time to review the permanent data in addition to other areas of their jobs.
Improving the applications and methods of data submission and availability has increased productivity and efficiency. The data sharing between the Department and partners helps provide data to multiple bureaus and thousands of customers for various purposes.
Since the implementation of iTMS, the number of traffic data requests has been cut by nearly 50%.
The creation of iTDUS has cut the lifecycle of the traffic count submission by more than 90%. This allows a quicker turnaround of the data to the user.
Permanent Traffic Site Maps have opened the lines of communications between the Bureau and the engineering districts, and made the districts more aware not only of the location of the sites but also the importance of the permanent traffic counting sites.
ATICS provides quicker generation of monthly files for FHWA submission and also internal report generation, which assists with developing factors and processing larger data requests. Larger data requests used to take days to extract. With the various reports now available, those requests can be done in a fraction of the time. The quality assurance section allows the Bureau to see potential issues with permanent site data and to address those issues before they become a significant problem
The State of Alabama has a unique approach for incorporating data collected by local governments, which is then used to provide some of the data for the HPMS submittal, and occasionally, the lower functionally classified roads. Alabama DOT (ALDOT) collects all of the traffic data except on the county roads. Local governments are used to collect the county road data. ALDOT provides instructions and regulations to the local governments for collecting the 48-hour counts by lane and by direction. The data is then sent to ALDOT where it is validated using established quality control procedures.
In addition to the partnership with local governments, which enhances ALDOT’s traffic data collection program, ALDOT has also developed an automated method to calculate AADT values using short duration counts. This method is described in the following paragraphs:
The continuous data is collected daily and processed through the Traffic Monitoring System (TMS) to produce the day of month counts, which are submitted to FHWA in a TMS Plan (note this is not the same as the Data Business Plan discussed in Chapter 2). At the end of the year, the continuous counts are grouped from recorders in the area where the short duration counts were made. A weighted average is then generated by the TMS system and this average is used to factor the short duration counts to produce the AADT values. For example, if a short duration count is made on June 1, the data is entered into the Traffic Data Processing System (TDPS) as raw data. At the end of the year, the TDPS program uses the continuous counts from the count stations around the same area where the counts were made, and for that same period (June 1), to calculate a weighted average from those counts. The TDPS then calculates a factor that is applied to the short duration counts to produce the AADT value.
The automated method now used to develop the AADT from short duration counts replaces a previous method in which a 48-hour count was used to calculate a day of month count, which was then factored to derive an AADT value, and this process was all done manually. The automated method now allows ALDOT to go directly from short duration counts to AADT values, thereby, eliminating manual steps, reducing errors in manual calculations, and saving time for the entire process.
The State of Connecticut provides a different example of how factoring is done by computing a monthly rolling average based on the previous 12 month period. The following steps are used to develop the AADT from raw count data:
Once the factors are developed, they are applied to the weight-averaged data to calculate the AADT.

