U.S. Department of Transportation
Federal Highway Administration
1200 New Jersey Avenue, SE
Washington, DC 20590
202-366-4000
This chapter provides guidance to States in meeting the traffic reporting requirements of the Highway Performance Monitoring System (HPMS) program. Traffic data comprise a significant portion (approximately 25%) of the data that is reported annually for HPMS purposes. Each State’s traffic monitoring program is used to collect, process, and store a variety of types of traffic data. While the traditional traffic monitoring program includes the collection of volume, classification, weight, and speed data, the primary focus of the guidance in the TMG is on volume and classification data, both used for HPMS purposes. The traffic data reported in HPMS should mirror the State’s traffic monitoring program so that information published by the State and FHWA are as similar as possible. HPMS traffic data should be developed in a cooperative process among the State’s HPMS, traffic monitoring, and traffic demand modeling personnel.
This data is nationally standardized so that multiple uses of the data are possible, and the data should be of the highest quality possible or it would not be acceptable for engineering capacity design, pavement deterioration analysis, or use in analytical models such as the Highway Economic Requirements System (HERS). This data is an important part of the Conditions and Performance Report to Congress and development of Federal transportation legislation.
FHWA’s requirements for the States regarding data for HPMS are provided in the HPMS Field Manual (HFM). This manual contains detailed instructions for the States regarding reporting of data for HPMS, including traffic data. The reader should refer to the most recent version of the manual for detailed traffic data reporting requirements, as those requirements may change over time. The information provided in the TMG is based on the most recent HPMS Field Manual of 2012.
A limited amount of background information is provided here to offer an overview explanation of how the HPMS system is organized. The main difference for traffic monitoring is that HPMS is organized by road sections in order to estimate VMT and correlate with road inventory data. HPMS data cover what are known as full extent, sample panel, and partial extent. The following definitions for each of these types of data are from the HPMS FIELD MANUAL.
Full extent data refers to a limited set of data items that are reported for an entire road system such as the National Highway System (NHS) or all public roads. AADT is an example of traffic data that should be reported on a full extent basis and reported for ramps at grade-separated interchanges (HFS 4.4).
Sample panel data consists of data items added to the full extent data that are reported for a select portion of the total roadway system length. K-Factor and D-Factor are examples of traffic data that should be reported on a sample panel basis (HFM 4.4).
Partial extent data refers to those data items that are reported on a full extent basis for some functional systems and on a sample panel basis for other functional systems. AADT-single-unit (truck volumes) and AADT-combination (truck volumes) are examples of traffic data that should be reported on a partial extent basis (HFM 4.4).
The purpose of sampling is to provide a statistically valid representation of the public road network for the State, without imposing additional data collection burdens. Within HPMS, these samples are expanded for a statistically valid representation of the public road network for the State.
The State’s HPMS coordinator is responsible for providing the location of sample sections to the traffic monitoring staff as new samples are added or removed for each HPMS data collection year. The addition of samples, which may require additional traffic data collection, is determined by using the sample management process within the HPMS system. This process allows the HPMS coordinator to work with the traffic monitoring staff to either establish permanent count stations at those locations or take short duration coverage counts at specific locations to provide count data for use with HPMS.
For sampling purposes, HPMS uses the Table of Potential Samples, or TOPS, as the sampling frame. HPMS sample sections are selected from the TOPS. The TOPS includes all Federal-aid highways, which are highways on the National Highway System (NHS) and all other public roads not classified as local roads or rural minor collectors.
Five critical data items are used to establish the TOPS. One of these data items is AADT. The four additional items are functional system, through lanes, urban code, and facility type (used to identify ramps). TOPS sections are defined where the values for these five items remain unchanged (or are homogenous) for a section of road along the full extent of the road. Figure 6-1 illustrates the TOPS sections for a given route (Route ABC) based on the five homogenous data items. The potential TOPS sections are labeled as A,B,C,D, and E on the bottom row of the figure.
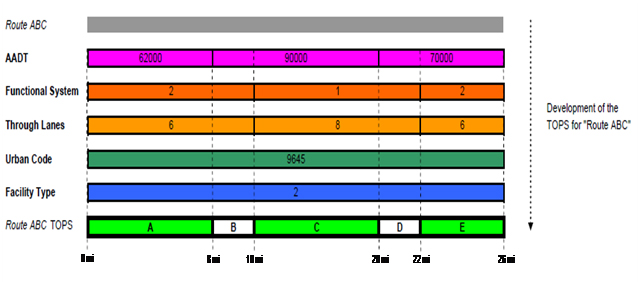
Source: HPMS Field Manual.
Out of the five data elements listed above, States are typically organized such that the AADT comes from the traffic data program, and the other four data elements come from the road inventory data program. Working across these two programs to produce the HPMS statistics is challenging. The following is an example of this challenge.
HPMS requires combining tabular traffic data attributes with geospatial linear referencing system attributes. For example, the combination of point roadway traffic count data with the location (GIS point and linear features) provides information about where exactly along a traffic segment the original point traffic data is applicable. However, State DOTs are sometimes technically and administratively challenged with integrating GIS line and point features.
The AADT statistic is created by the travel monitoring program staff. In some States, the AADT attribute is stored in the roadway inventory, and in other States, the AADT attribute is stored with the travel monitoring data. States should establish business rules to synchronize roadway inventory and traffic data to support management of these data layers.
The HPMS Field Manual, Chapter 6, contains additional information on TOPS.
The remainder of this chapter includes the following sections:
6.2 HPMS Requirements – This section describes traffic data reporting requirements for HPMS
6.3 Guidelines for Collecting Traffic Data to Support HPMS – This section provides guidance about how to acquire the traffic data needed to meet the HPMS requirements.
6.4 Calculation of Data Items – This section provides guidance about how to compute the HPMS data items and includes references.
While traffic data is collected and reported on a full extent, sample, and partial extent basis for HPMS, State highway agencies may not need to physically conduct traffic counts at all locations. In some cases, the States may rely on local governments to collect data and supply the data to the State for use with HPMS. In other cases, procedures such as ramp balancing can be used to estimate traffic volumes on roads where portable counts cannot be performed safely. Regardless of how the data is collected, each State highway agency is responsible for the quality, completeness, and accuracy of all traffic data within their State boundaries.
Specific emphasis is placed on the collection of vehicle classification data on HPMS sample sections, since this data is used in many nationally significant analyses, including estimating annual average truck travel and in pavement deterioration models. Truck volumes are used to calculate the percent of single-unit trucks (Pct_Peak_Single) and the percent of combination (Pct_Peak_Combination) trucks, in the form of annual average daily truck traffic (AADTT) provided by the State’s traffic monitoring program.
The volume data is also used to support the assessment of the nation’s transportation system and helps to ensure a fair distribution of Federal funds to maintain that system.
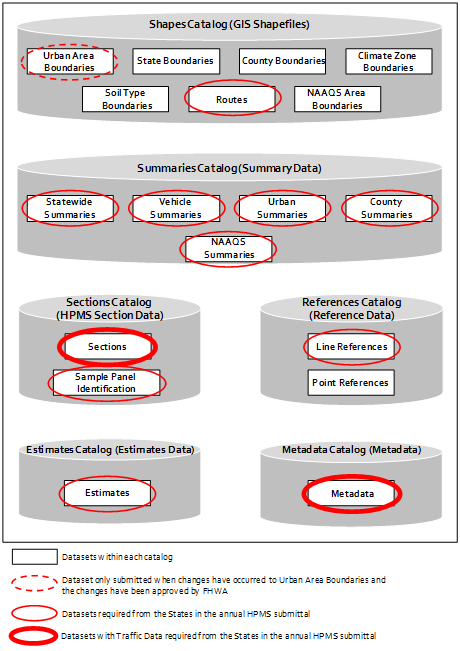
The HPMS Data Model (Figure 6-2) is a geospatial model that allows updates to particular types of data, independent of other types of data. This means that traffic data can be updated without impacting pavement, inventory, route, and geometric data. The geospatial model also provides analytical capabilities to compare traffic data with other information, such as pavement data for use in pavement design, and geometric data for use in highway safety analysis.
The HPMS data model includes six catalogs and seventeen datasets. The traffic data reported in HPMS are stored in the Sections and Metadata catalogs. The Sections dataset identified as part of the Sections catalog grouping is used to store thirteen traffic data items, seven of which are provided by the States’ traffic monitoring program. The additional six items may be provided by other areas of the agency, including operations and/or other sections of the States’ planning division. The traffic data items reported in HPMS are identified in Table 6.1. The following data definitions indicate how these data items are defined for the HPMS program
AADT – is the Annual Average Daily Traffic and represents all days of the reporting year for traffic on a section of road and is required for all Federal-aid highways and grade-separated interchange ramps (HFM 4.4).
AADT_Single_Unit – is the Annual Average Daily Traffic for single-unit trucks and buses and is required for all National Highway System (NHS) and Sample Panel sections (HFM 4.4). This item requires detailed vehicle classification data and includes FHWA vehicle classes 4-7 (HFM 4.4).
Pct_Peak_Single – is the number of single-unit trucks and buses traveling on a section of road during the peak hour, divided by the AADT, and is required for all Sample Panel sections (HFM 4.4). This item requires hourly directional detailed vehicle classification data and includes FHWA vehicle classes 4-7 (HFM 4.4).
AADT_Combination – is the Annual Average Daily Traffic for Combination Trucks and must be reported for the entire NHS and all Sample Panel sections (HFM 4.4). This item requires detailed vehicle classification data and includes FHWA vehicle classes 8-13 (HFM 4.4).
Pct_Peak_Combination – is the percent of peak combination trucks traveling on a section of road during the peak hour. This item requires hourly directional detailed vehicle classification data and includes FHWA vehicle classes 8-13 (HFM 4.4).
K_Factor – is the peak hour volume (i.e., 30th highest hourly volume) expressed as a percentage of total AADT. This item is needed for all Sample Panel sections (HFM 4.4). It is best developed from hourly ATR data. The different methods used for developing short-duration and continuous count K-factors are described in more detail in Chapter 3.
Dir_Factor –is the percent of peak hour volume flowing in the peak direction and is required for all Sample Panel sections (HFM 4.4).
Source: HPMS Field Manual
| Item Number | Data Item |
Data Format |
Example Value |
|---|---|---|---|
| 21 | AADT |
Numeric |
100,000 |
| 22 | AADT_Single_Unit |
Numeric |
10,000 |
| 23 | Pct_Peak_Single |
Decimal to nearest 0.1% (one-tenth) |
2.2 |
| 24 | AADT_Combination |
Numeric |
30,000 |
| 25 | Pct_Peak_Combination |
Decimal to nearest 0.1% (one-tenth) |
0.3 |
| 26 | K_Factor |
Numeric (2-digit) |
1-99 (represents 1%-99%) |
| 27 | Dir_Factor |
Numeric (2-digit) |
1-99 (represents 1%-99%) |
| 28 | Future_AADT |
||
| 29 | Signal_Type |
||
| 30 | Pct_Green_Time |
||
| 31 | Number_Signals |
||
| 32 | Stop_Signs |
||
| 33 | At_Grade_Other |
Further guidance for items 21 through 27 can be found in TMG Chapter 3. HPMS traffic data items 28 through 33 are not collected by the States’ traffic monitoring program.
The standard HPMS reporting requirements for traffic data include the following topics, which are addressed in the subsequent paragraphs:
AADT data is reported in HPMS for both mainlines and ramps on Federal aid facilities. The FHWA HPMS Field Manual provides the following guidelines.
Four approaches can be used to conduct ramp counts where needed:
Additionally, the following approach may be used for estimating ramp counts:
The following are equations and example computations of using relevant data to compute unknowns rather than field counting for the most common interchange configurations.
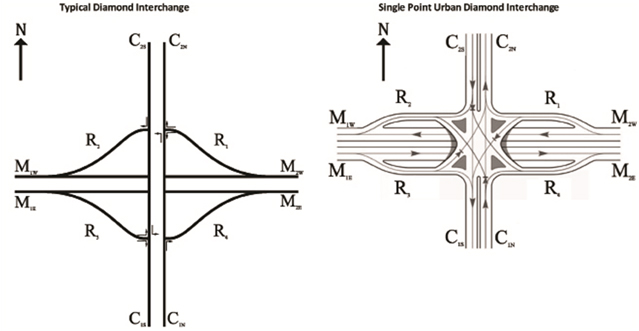
Source: Federal Highway Administration.
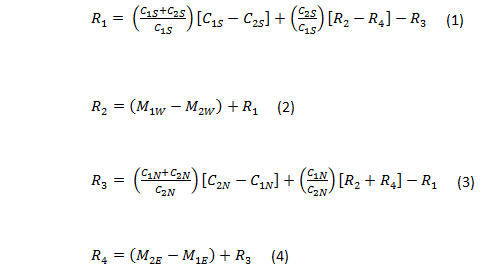
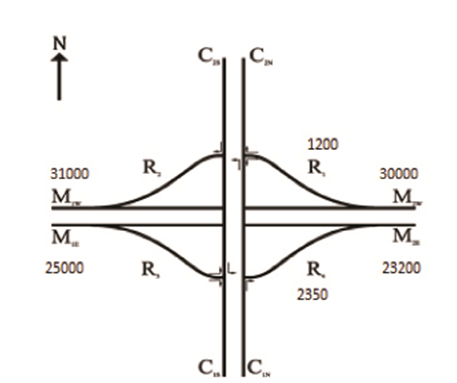
While formulas 1 and 3 require cross street data, ramps 1 and 3 can be counted and formulas 2 and 4 can be used to estimate ramps 2 and 4.
A diamond interchange located on an E/W freeway has directional mainline data both upstream and downstream of the interchange. Two ramps need to be counted in order to use formulas (3) and (5). Ramps R1 and R4 were counted and the following data is now known:
M1E = 25,000
M2E = 23,200
M1W = 31,000
M2W = 30,000
R1 = 1,200
R4 = 2,350
Source: Federal Highway Administration.
R2 = (M1W- M2W) + R1
R2 = (31,000 - 30,000) + 1,200
R2 = 2,200
R4 = (M2E- M1E) + R3
2,350 = (23,200 - 25,000) + R3
2,350 = -1,800 + R3
R3 = 4,150
Source: Federal Highway Administration.
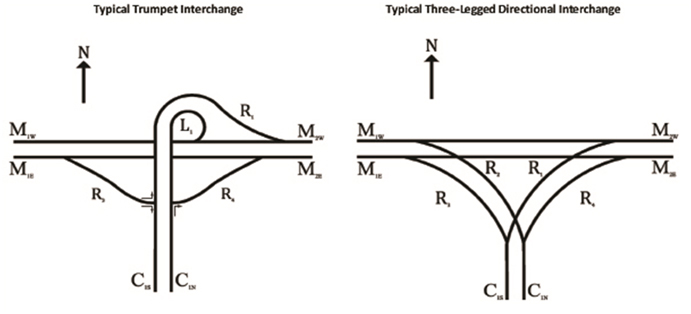
C1S = R1 + R3(5)
R1 = (M2W - M1W ) + L1 or R1 = (M2W - M1W ) + R2(6)
R3 = (M1E - M2E ) + R4 (7)
L1 =C1N - R4 or R2 = C1N - R4 8)
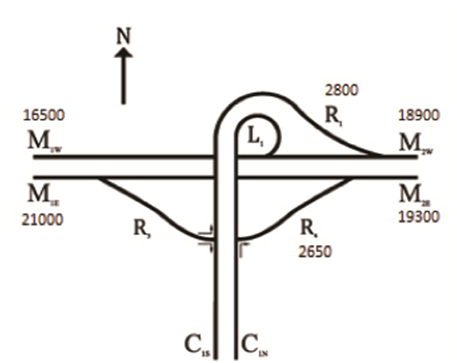
While formulas 5 and 8 require cross street data, ramps 2 (or loop 1) and 4 can be counted and formulas 6 and 7 can be used to estimate ramps 1 and 3.
A trumpet interchange located on an E/W freeway has directional mainline data both upstream and downstream of the interchange. Two ramps need to be counted in order to use formulas (9) and (10). Ramps R1 and R4 were counted and the following data is now known:
M1E = 21,000
M2E = 19,300
M1W = 16,500
M2W = 18,900
R1 = 2,800
R4 = 2,650
Source: Federal Highway Administration.
R1 = (M2W - M1W) + L1
2,800 = (18,900 - 16,500)+ L1
2,800 = 2,400 + L1
L1 = 400
R3 = (M1E- M2E ) + R4
R3 = (21,000 - 19,300) + 2,650
R3 = 4,350
Source: Federal Highway Administration.
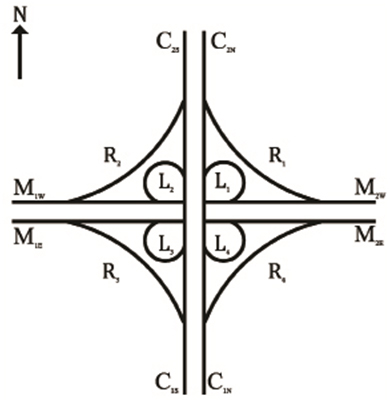
1. Cloverleaf interchanges are the most complex and data intensive scenario for volume to ramp count relationships.
2. Formulas (9) through (12) can be used directly assuming some combination of mainline, cross street, and ramp volumes are known for a given year.
3. A weight factor does not need to be used for exit ramps when approaching the cross street because vehicles do not have an option of which direction to take once on a ramp.
R1 = (M2W - M1W) + (L1 - L2) + R2 (9)
R2 = (C2S - C1S ) + (L2 - L3 ) + R3 (10)
R3 = (M1E - M2E ) + (L3 - L4 ) + R4 (11)
R4 = (C1N - C2N ) + (L4 - L1 ) + R1 (12)
Mainline and cross-street AADTs available with one ramp known.
If only mainline AADT data is available, count three ramps from each of the following lists:
{R1, L1, R2, L2}With six ramps counted, use formulas (9) and (11) to determine the volumes for the remaining ramps.
A cloverleaf interchange located at an intersection of two freeways has directional mainline (E/W) data both upstream and downstream of the interchange. Two ramps need to be counted in order to use formulas (9) and (11). Ramps R1 and R4 were counted and the following data is now known:
M1E = 54,000
M2E = 51,500
M1W = 58,500
M2W = 59,000
R1 = 2,500
L1 = 2,100
R2 = 2,800
R3 = 2,200
L3 = 2,450
R4 = 2,500

R1 = (M2W - M1W ) + (L1 - L2 ) + R2
2,500 = (59,000 – 58,500) + (2,100 -L2 )+2,800
2,500=5,400-L2
L2 =2,900
R3 = (M1E – M2E ) + (L3 -L4 ) + R4
2,200=(54,000–51,500)+(2,450-L4)+2,500
2,200=7,400-L4
L4 =5,250
Source: Federal Highway Administration.
Instead of reporting AADT values for local roads and rural minor collectors, VMT estimates are reported for these functional classes. These estimates should be produced by the States using a documented statistically valid procedure based on monitored traffic. The estimated VMT is summarized by States and is reported in the Statewide Summaries dataset, which is stored in the Summaries catalog of the HPMS database.
Three examples for collecting counts on local roads and rural minor collectors are illustrated by New York, Iowa, and Mississippi.
New York DOT utilizes the assistance of the counties, towns, and cities in collecting local road data for HPMS purposes. The State purchases and provides the counters and supplies for two qualifying counts per counter per year for five years (e.g., ten counts total). A qualifying count is a count on the NHS. The number of counts provided is dependent on the number of miles of roadway within the county. For example, the receiving local agency may be required to perform two counts for a season and the rest are done when the local agency needs them. The State enters into a Memorandum of Agreement (MOA) with the counties in which they collect and provide all the data to the State at select locations, and in turn, the county keeps the equipment. If the county does not fulfill their obligation to the State, the equipment must be returned. After they have completed their obligation to the State, the county can retain the equipment and continue to take counts for themselves. The State does ask that the county continue to provide data, and in turn, the State will help out with repairs to the equipment.
Iowa DOT used a different approach to support their HPMS data collection process. Maintenance staff received training, a truck, and data collection equipment to be used for purposes of collecting the HPMS data. The staff then conducts the scheduled counts during the year. Beginning in 2004 through 2010, the DOT utilized maintenance crews that cleared snow in the winter and provided continuity of employment and job diversity for equipment operators. Staff worked locally in the counties where they lived. Overall program benefits were realized through decreases in travel time and personal expenses, as well as increases in data collection quantity, quality, and metadata regarding changes in traffic patterns. Using permanent staff from local maintenance garages allowed for better ownership of the data and conveyance of personal understanding regarding changing traffic patterns, while at the same time maintaining procedural integrity through a centralized program.
Mississippi had some obsolete traffic counts that were not part of the routine traffic monitoring program. These counts pre-dated the implementation of the HPMS system in 1978. The traffic monitoring staff collaborated with the HPMS staff to determine where additional data collection sites were needed. These sites then became part of the routine traffic monitoring program, and updates were scheduled to be collected on the recommended six-year cycle. This includes expanding the coverage of traffic monitoring to include data collection on local roads.
Each State is encouraged to select the best approach for collecting or estimating local road data and rural minor collectors that meets their business needs.
The TMG does not recommend using a fixed percent of traffic growth method, or using the result of calculating statewide total VMT minus highway systems VMT to produce the estimates for local roads and rural minor collectors.
Other methods can be used to estimate counts and include the following
The following example explains the use of these four methods to estimate current year counts based on previous year actual counts.
In this example, a location in an urban area on a principal arterial roadway does not have a current year counted traffic volume. The AADT from the previous year was 44,500. The current year traffic can be estimated using one of the four methods or a combination of these methods
1. Using the first method, a linear projection is performed based on historical data from the same site. If the growth rate is -3% per year, the current year traffic volume estimate would then be 43,165, which can be rounded to 43,000
2. Using the second method, it has been determined that one or more permanent sites on similar routes exhibit a growth rate of -3.7%. The current year traffic volume estimate would then be 42,854, rounded to 43,000.
3. The third approach uses the previously determined urban system growth rate of -3.6% based on all permanent counters in urban area. The current year traffic volume estimate is therefore 42,898, which is rounded to 43,000.
4. The fourth approach is based on a regional growth rate of -3.8% from all permanent counters in the region, yielding a current year traffic volume estimate of 42,809. This value is rounded to 43,000.
In the above example, all four methods yield the same value. Use method number one first to obtain estimate counts. If site specific growth is not available, then use route-specific growth; if route-specific growth is not available, use systems growth; and finally if systems growth is not available, regional growth should be used.
The rounding of AADTs is acceptable for HPMS purposes only following the scheme recommended by the AASHTO Guide. The TMG does not recommend this unless it is common practice for the State to round all traffic data in their traffic monitoring database and is applied to all traffic data consistently. This applies to the reporting of volume and vehicle classification data.
Rounding should be performed after all adjustments to the raw count data have been made and should NOT be performed when calculating percent single-unit and combination trucks. Low volume counts (e.g., 0.2%) should not be rounded to report zero as a volume or as a percent since this will not accurately represent the presence of the minimal volumes, and will also show no change in trends. A zero should only be reported when the actual count is zero.
The following guidance should be followed regarding rounding of AADTs:
Accurate motorcycle counting may require unique procedures and equipment. More information is provided on this topic in Chapter 3. Some limitations exist regarding the use of technology in properly measuring motorcycle counts. More information on the type of equipment used for these counts is found in Appendix F.
Vehicle classification data is needed in HPMS to determine the accurate percentage of truck traffic on the roadway during peak travel hours as well as off-peak travel hours. Both truck volume (AADT_Single_Unit and AADT_Combination) and truck percent data is reported for the various types of records in HPMS. This data is used to analyze the impact of truck traffic on pavement deterioration and are also used for reporting in summary tables in HPMS.
Since class counts are required by HPMS for many road sections, it will likely be too costly to maintain permanent traffic classifiers on all of these sections. Therefore, a combination of permanent and portable classifiers will be needed to meet the requirement. This will entail adjusting portable class counts by the permanent classifiers as further described in TMG Chapter 3.
The AADT for trucks is required for the entire NHS and all HPMS Sample Panel Sections. Two types of truckAADT are reported in HPMS: AADT_Single_Unit (which is the single-unit truck and bus AADT for vehicle classes 4 through 7) and AADT_Combination (which is the combination truckAADT for vehicle classes 8 through 13). Appendix C provides additional information on the 13 vehicle classes.
In addition to truckAADT for single and combination trucks, two additional types of truck data is required. These are the percent of single-unit trucks (Pct_Peak_Single) and percent of combination trucks (Pct_Peak_Combination) traveling on a section of road during the peak hour.
Estimates of travel by vehicle type are required for HPMS and are summarized by Area Type (AT) and Functional System (FS) group. While there are seven functional systems, there are only three FS groups. The three FS groups are combined with two area types, rural and urban, for six combined AT and FS groups as shown in Table 6-2.
HPMS is designed as a random sample stratified by traffic volume groups. To the extent that vehicle class counts reflect this design, they may be averaged to estimate the distribution of VMT by vehicle type. Estimating the VMT by vehicle type to meet this requirement is not necessary.
| Area Type and Functional System | Group |
|---|---|
| Rural Interstate | 1 |
| Rural Other Arterial (includes Other Freeways and Expressways, Other Principal Arterials, and Minor Arterials) | 2 |
| Rural Other (includes Major Collectors, Minor Collectors, and Locals) | 3 |
| Urban Interstate | 4 |
| Urban Other Arterial (includes Other Freeways and Expressways, Other Principal Arterials, and Minor Arterials) | 5 |
| Urban Other (includes Major Collectors, Minor Collectors, and Locals) | 6 |
The estimates of travel by vehicle type are reported as percent values for the type(s) of vehicles in each AT-FS group, such as percent of motorcycles (Pct MC), percent of passenger cars (Pct Cars), and percent of single-unit trucks (Pct SU Trucks).
These estimated values are reported in the Vehicle Summaries dataset and are stored in the Summaries catalog of the HPMS database. This information can be derived from the vehicle classification and WIM programs.
The State’s comprehensive traffic count program should be used to develop traffic volume group assignments for all road sections in a program that adequately monitors both high and low volume roads, including those off the State system. High and low volume sites are specific to each State, and engineering judgment is required to determine the values for these for each State individually. To facilitate this process, count station locations should be selected to represent expected AADT volume group breakpoints for the volume ranges of all required samples. This may require locating count stations at one per several miles in rural areas and more closely in urban areas. If there are homogeneous traffic sections (i.e., traffic counts are same for the length of the sections) as determined by prior counts or knowledge of local traffic conditions, more than one section may be represented by a single traffic count station as long as traffic does not vary more than 10%. In this scenario, local traffic monitoring offices may know of no major traffic generators or significant enough development to cause changes in the traffic volumes within HPMS sections. This situation can result in more than one HPMS section using the same traffic count station. HPMS sections exist for reasons other than fluctuations in traffic volumes, as noted in the discussion of TOPS sections. Selection of count locations should be based on previous count experience on the section or adjacent sections, recent land use development, and the existence of uncounted sections along the route.
Metadata for traffic are also reported in HPMS and are used to further explain any variability in the collection and/or reporting of traffic, such as: whether the AADT is adjusted for DOW or for number of axles; if the traffic data is reported from the State traffic database only; or if the data is reported from the State traffic database and local governments.
The metadata provide additional information about the following:
Additional information on the reporting of traffic metadata in HPMS can be found in Chapter 3 of the HPMS Field Manual.
The traffic data supplied for HPMS use are derived from the State’s regular traffic monitoring program with adjustments (such as aggregating data for short/long samples or using weighted-average for HPMS sections) to meet specific HPMS requirements. Collection of HPMS-specific traffic data should be fully integrated into the normal traffic monitoring program. As stated in Chapter 3, measures should be taken to ensure the quality of all data within the traffic monitoring program.
Several guidelines should be followed when collecting and processing traffic data to ensure that the highest quality traffic data is provided to HPMS. This section describes the following guidelines:
States should provide at least one continuous counter on each major (as defined by HPMS) Principal Arterial System (PAS)/NHS highway route, where possible. HPMS requires at least one; however, States are encouraged to use engineering judgment. The HPMS Field Manual defines the NHS as a network of nationally significant highways approved by Congress in the National Highway System Designation Act of 1995. It includes the interstate system and over 117,000 miles of other roads and connectors to major intermodal terminals. Due to MAP-21 legislation, the NHS was enhanced to include many roads from the PAS. At a minimum, each continuous counter should have at least one full day of data for each day of the week for each month provided the State has an adequate automatic editing process, with documentation of the edits performed based on historic trends.
This Guide recommends that the short duration counts used for HPMS reporting purposes be fully integrated with the agency’s coverage count program. This means using the same personnel, procedure, equipment, and counting schedule used for coverage and other traffic counts.
Highway agencies should be aware of the potential for geographic and temporal bias when scheduling counts and counteract it by devising strategies to distribute counts as much as feasible
The HPMS sample and full extent sections are located within the traffic volume segments defined in the coverage count program. Traffic counts taken to meet the HPMS requirements are taken the same way as other short duration traffic volume counts. These are described in Chapter 3. The main difference is that the HPMS has specified nationally standardized criteria for the collection and duration of the counts. The HPMS Coordinator should request those additional counts needed for HPMS sufficiently in advance (i.e., prior to scheduling of traffic counts for the data collection year) to allow them to be included in the regular coverage count program. Whenever possible, coverage counts taken within a defined traffic count roadway section should be taken within an HPMS section. Since HPMS sections within the TOPS may change over time, this may require counts to be added or eliminated as needed for the traffic count roadway section.
One third of the HPMS full extent (NHS/PAS) and sample sections should be included in each current year coverage sample to ensure that, at a minimum, each of these HPMS full extent/sample sections are counted once every three years.
While short duration traffic counts can be taken for anywhere from just a few hours to more than a week, this Guide recommends a 48-hour monitoring period for traffic volume and vehicle classification. The 48-hour counts are particularly important for the HPMS because common data collection periods from all States ensure similar levels of accuracy and precision for all volume data in the HPMS database.
Where axle correction factors are needed to adjust raw counts, they should be derived from facility-specific vehicle classification data obtained on the same route or on a similar route with similar traffic in the same area. No other factors (such as equipment error factors) should be applied; only daily, seasonal, and axle correction factors should be used.
A minimum of one count every six years is required for ramps. At a minimum, 48-hour ramp counts should be adjusted with axle correction factors as needed.
The same procedures used to develop AADTs on all HPMS sections should be used to develop ramp AADTs. States are encouraged to use adjustment factors developed based on either entrance or exit travel patterns or on the functional class of the ramp and to use this procedure consistently statewide. Good judgment and experience should be applied regarding factor use. Additional information on developing adjustment factors is found in Chapter 3. Ramp counts should be available from freeway monitoring programs that continuously monitor travel on ramps and mainline facilities. Ramp balancing programs implemented by States on ramp locations and on high volume roadways could also be used to provide AADTs. If a State has a traffic modeling office, ramp traffic estimates may be computed as part of the modeling process.
Vehicle classification counts reported in HPMS should follow the guidelines outlined in Chapter 3. Hourly vehicle classification data by direction should be used for all the truck related data items, including Pct_Peak_Single (trucks) and Pct_Peak_Combination (trucks).
The State should ensure that data collection equipment is calibrated and tested in the field and that the results are validated for accuracy prior to use for HPMS reporting. More information on equipment calibration procedures is found in Appendix F.
The traffic data items reported for HPMS are derived from the traffic data collection activities, which are part of the State’s traffic monitoring program. These data items include
The calculation methods for these data items are described in the following paragraphs.
Annual Average Daily Traffic calculations are defined in Chapter 3. The following Quality Control (QC) checks on AADT data will be performed manually by FHWA staff or will be checked by the HPMS submittal software and may indicate an error with the AADT data:
Annual Average Daily Traffic for Single Unit Trucks – This value represents all single-unit truck and bus activity based on vehicle classification count data from both the State’s and other agency’s traffic monitoring programs over all days of the week and all seasons of the year. Single-unit trucks are defined as vehicle classes five through seven, and buses are defined as vehicle class four. AADT_Single_Unit is reported as the volume for all single-unit activity over all days of the week and seasons of the year in terms of the annual average daily traffic. The following QC checks will be performed by the HPMS submittal software and may indicate an error with the AADT_Single_Unit data:
Percent of single-unit trucks and buses during the peak hour – The percent of single-unit trucks and buses is the single-unit truck and bus volume during the peak hour shown as the percentage of section AADT, to the nearest tenth of a percent (0.1%). For example, if the section AADT is 3,000 and the volume of single-unit trucks and buses in the peak hour is 65, then the Pct_Peak_Single data item is shown as 0.2%. This percent should not be rounded to the nearest whole percent or to zero percent if minimal trucks and buses exist. The following QC check will be performed by the HPMS submittal software and may indicate an error with the Pct_Peak_Single data:
If (Pct_Peak_Single/100) × AADT>AADT_Single_Unit, there is an error.
Annual Average Daily Traffic for Combination Trucks – This value represents all combination truck activity based on vehicle classification count data from both the State’s and other agencies’ traffic monitoring programs over all days of the week and all seasons of the year. Combination trucks are defined as vehicle classes eight through thirteen. AADT_Combination is reported as the volume for combination-unit truck activity over all days of the week and seasons of the year in terms of the annual average daily traffic. The following QC checks will be performed by the HPMS submittal software and may indicate an error with the AADT_Combination data:
Pct_Peak_Combination– Percent of peak combination trucks during the peak hour. The percent of peak combination trucks is the combination truck traffic volume during the peak hour shown as the percentage of section AADT, to the nearest tenth of a percent (0.1%). For example, if the section AADT is 5,000 and the volume of combination trucks in the peak hour is 165, then the Pct_Peak_Combination trucks is shown as 0.3%. This percent should not be rounded to the nearest whole percent or to zero percent if minimal trucks exist. The following QC check will be performed by the HPMS submittal software and may indicate an error with the Pct_Peak_Combination data:
If (Pct_Peak_Combination/100) >AADT_Combination, there is an error.
K_Factor – K_Factor is the design hour volume expressed as a percent of AADT. The K_Factor conveys the design hour volume or the 30th highest hourly volume, as a percent of total AADT. The value for K_Factor is reported to the nearest percent. For example, if the traffic volume during the design hour or 30th highest hourly volume is 10% of the AADT for a section of road, then the K_Factor is reported as 10 for that section. The following QC checks will be performed by the HPMS submittal software and may indicate an error with the K_Factor data:
Dir_Factor (Directional Factor) – Dir-Factor is the percent of design hour volume flowing in the peak direction. The Dir_Factor is reported as the percentage of design hour volume (30th highest hour) flowing in the peak direction. For example, a Dir_Factor of sixty indicates that sixty percent of the design hour volume is flowing in the peak direction. A value of one hundred is used for one-way facilities when reporting this value in HPMS. The following QC checks will be performed by the HPMS submittal software and may indicate an error with the Dir_Factor data:
Future AADT may not be an item reported as part of a State’s traffic monitoring program although reported as a data item in HPMS. The estimates for Future AADT are usually developed from statewide modeling programs and on input provided by MPOs as appropriate. If data from statewide modeling programs is not available, population growth or gasoline tax growth can be used to estimate traffic growth. The Future AADT is a 20-year forecast AADT, which may cover a period of 18 to 25 years from the date of the HPMS data year submittal. The following QC checks will be performed by the HPMS submittal software and may indicate an error with the Future AADT data:
This chapter discussed the HPMS requirements for traffic data. The traffic data derived from the State’s traffic monitoring program should be the primary source for the traffic data reported in HPMS, supplemented with additional traffic data from local governments or MPOs as needed. All data validations for HPMS, including traffic data, are done within the HPMS submittal software and are discussed briefly in the HPMS Field Manual. A different set of data validations are performed on traffic data submitted for the Travel Monitoring Analysis System (TMAS). The next chapter discusses the traffic data format requirements for TMAS.

