U.S. Department of Transportation
Federal Highway Administration
1200 New Jersey Avenue, SE
Washington, DC 20590
202-366-4000
The goal of pavement design is to obtain a set of specific pavement construction parameters, such as types of construction material and construction methods; thickness of various courses, including base, structural layer; and a surface course to achieve pre-determined performance criteria. Traffic, climate, soil, and other geological data are typically used as inputs for pavement design. Traffic data shall cover the entire life expectancy, which is between the opening year and the last year of life expectancy (Figure H-1). The last year of life expectancy of pavement is often referred to as the design year.
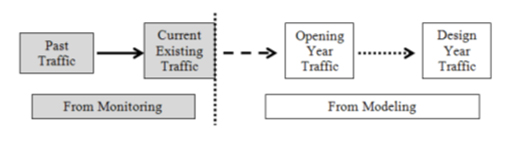
Source: Federal Highway Administration.
Traditionally, traffic impact on pavement design is through the concept of equivalent single-axle loads (ESAL). ESAL is the equivalent number of 18,000 lbf (pound force) single-axle loads that would produce the same amount of damage over the pavement design life. Traffic modeling and design traffic professionals project cumulative ESAL data from all vehicles for the entire pavement life expectancy.
NCHRP Project 1-37A’s Mechanistic-Empirical Pavement Design Guide enables a dynamic approach where pavement performance can be modeled with very specific traffic related parameters. The new process requires significant traffic data from demand forecasting professionals, which in turn necessitates significant field monitoring data.
The FHWA’s 13 vehicle category classification system relies on vehicle axle spacing to differentiate various vehicles. Vehicle data classified under this system are referred to as vehicle class information or data.
Vehicle axle configuration refers to the different axle configurations that a vehicle may have. Under each vehicle axle configuration, the weight on the axle/axles is called axle loading. Axle load reflects both the weight of a vehicle itself and the cargo it carries.
To design pavement for a travel lane, AASHTO’s Guide for Design of Pavement of Structures offers the formula for traffic data as listed below
| 1 | DL (lane splitting factor): traffic distribution among different lanes with the same travel direction by vehicle types |
| 2 | DD (directional factor): directional traffic split of a two way roads |
| 3 | AADT by vehicle types |
| 4 | AADT by axle weight by vehicle types |
Source: Federal Highway Administration.
w18= DD × DL × W18
Where:
w18 is the ESAL for the design lane. W188 represents the ultimate traffic data needed for pavement design.
DD is the traffic directional factor for a two way roadway.
DL is a lane traffic splitting factor for a roadway having more than one lane in each direction.
W18 is cumulative two way ESAL projected for a roadway segment.
The W18 is the cumulative dual directional ESAL covering the entire life expectancy. To compute W18, data on number of axles for various axle configurations under various axle loads is needed. While the number of axles for various axle configurations under various axle loads can be obtained from traffic projection professionals, axle load equivalence factors are to be obtained from AASHTO’s Guide Appendix D.
1. Obtain Column A, B, and C information from AASHTO’s Guide for Design of Pavement Structures Appendix D.
2. Fill out Column D with forecasted cumulative traffic measured in number of axles by axle load from traffic forecasting professionals.
3. Column E = Column C × Column D.
4. Summarize Column E to obtain the W18.
| A | B | C | D | E |
|---|---|---|---|---|
| AASHTO Guide Table | Traffic Forecasting | D × C | ||
| Axle Type | Axle Loads (KIPS) | Axle Load Equivalence Factor |
Cumulative Number of Axle |
ESALs |
| Single Axle | 2.00 | 0.00 | 768,021 | 153.6 |
| 4.00 | 0.00 | 120,123,356 | 240,246.7 | |
| 6.00 | 0.01 | 3,227,896,123 | 35,506,857.4 | |
| 8.00 | 0.04 | 623,456,799 | 22,444,444.8 | |
| 10.00 | 0.09 | 321,456,799 | 28,931,111.9 | |
| 12.00 | 0.19 | 2,100,003 | 396,900.6 | |
| 14.00 | 0.35 | 186,000,159 | 65,844,056.3 | |
| 16.00 | 0.61 | 0 | 0.0 | |
| 18.00 | 1.00 | 0 | 0.0 | |
| 20.00 | 1.56 | 0 | 0.0 | |
| 22.00 | 2.35 | 0 | 0.0 | |
| 24.00 | 3.43 | 0 | 0.0 | |
| 26.00 | 4.88 | 0 | 0.0 | |
| … | 0 | 0.0 | ||
| 50.00 | 97.00 | 0 | 0.0 | |
| Tandem Axle | 2.00 | 0.00 | 0 | 0.0 |
| 4.00 | 0.00 | 0 | 0.0 | |
| 6.00 | 0.00 | 0 | 0.0 | |
| 8.00 | 0.00 | 12,345,789 | 37,037.4 | |
| 10.00 | 0.01 | 8,964,566 | 71,716.5 | |
| 12.00 | 0.02 | 368,945 | 5,903.1 | |
| 14.00 | 0.03 | 14,789 | 428.9 | |
| 16.00 | 0.05 | 78,965,145 | 3,948,257.3 | |
| 18.00 | 0.08 | 32,514,589 | 2,633,681.7 | |
| … | 0 | 0.0 | ||
| 32.00 | 0.84 | 45,678,912 | 38,507,322.8 | |
| 34.00 | 1.08 | 256,000 | 276,480.0 | |
| 36.00 | 1.38 | 12,589,631 | 17,373,690.8 | |
| 38.00 | 1.73 | 0 | 0.0 | |
| 40.00 | 2.15 | 4,781,265 | 10,279,719.8 | |
| 42.00 | 2.64 | 3,612,987 | 9,538,285.7 | |
| … | 0 | 0.0 | ||
| 68.00 | 22.40 | 0 | 0.0 | |
| 70.00 | 25.60 | 0 | 0.0 | |
| … | 0 | 0.0 | ||
| 86.00 | 66.00 | 14,569,124 | 961,562,184.0 | |
| 88.00 | 73.40 | 1,256,789 | 92,248,312.6 | |
| 90.00 | 81.50 | 345,789 | 28,181,803.5 | |
| Cumulative ESAL | 1,289,846,791.7 | |||
Source: Federal Highway Administration.
NCHRP Project 1-37A’s Mechanistic-Empirical Pavement Design Guide requires the extensive input of traffic data. The following are traffic data items required for the process
1. Opening Year Two-Way Annual Average Daily Truck Traffic
Two-way annual average daily truck traffic (AADTT) (trucks are referred to as FHWA’s class 4 to 13 vehicles) is needed for opening year condition. This data is used as the base for future growth projection. It is a projected traffic value done by a traffic forecasting professional.
2. Percent of Truck Traffic in Design Direction
2. Percent of Truck Traffic in Design Direction
3. Percent of Truck Traffic in Design Lane %
This is the percentage of truck traffic for the design lane. The design lane is typically the outside lane with a multilane highway (more than one lane in each travel direction). Trucks tend to operate away from the far inside lane, which is adjacent to the median or the center lane divide on a multilane roadway.
4. Truck Monthly Adjustment Factor (TMAF)
The Truck Monthly Adjustment Factor reflects truck travel patterns throughout the year. There are 10 truck types (FHWA vehicle class 4-13) that result 10 potential different temporal patterns over a 12 month period. Mathematically the monthly adjustment factor for a given vehicle class and a given month is obtained by dividing the average monthly average daily truck traffic (MADTT) for the month by the summation of all the 12 month MADTTs and then multiplied by 12. There are a total of 120 TMAFs [10 vehicle classes × 12 months = 120 individual TMAF].
The TMAF formula for vehicle class i and month k is TMAFik=[MADTTik/(∑(MADTT)i)] × 12.
| MADTT | Class 4 | Class 5 | Class 6 | Class 7 | Class 8 | Class 9 | Class 10 | Class 11 | Class 12 | Class 13 |
|---|---|---|---|---|---|---|---|---|---|---|
| January | 588 | 2,800 | 1,216 | 502 | 250 | 527 | 485 | 51 | 142 | 124 |
| February | 598 | 2,851 | 896 | 498 | 263 | 654 | 493 | 38 | 152 | 108 |
| March | 602 | 2,864 | 1,211 | 561 | 296 | 625 | 520 | 25 | 164 | 165 |
| April | 630 | 3,001 | 1,321 | 598 | 299 | 692 | 586 | 62 | 159 | 154 |
| May | 674 | 3,213 | 1,452 | 625 | 421 | 568 | 564 | 45 | 156 | 142 |
| June | 717 | 3,415 | 1,621 | 740 | 465 | 587 | 652 | 65 | 187 | 165 |
| July | 756 | 3,602 | 1,690 | 789 | 489 | 623 | 657 | 82 | 221 | 120 |
| August | 810 | 3,859 | 1,699 | 785 | 620 | 621 | 678 | 32 | 235 | 95 |
| September | 832 | 3,962 | 1,780 | 741 | 661 | 451 | 725 | 67 | 268 | 67 |
| October | 755 | 3,455 | 1,795 | 645 | 561 | 482 | 712 | 12 | 189 | 64 |
| November | 685 | 2,699 | 1,400 | 560 | 421 | 389 | 608 | 18 | 167 | 96 |
| December | 598 | 2,760 | 1,324 | 495 | 412 | 462 | 527 | 19 | 152 | 116 |
| Total | 8,245 | 38,481 | 17,405 | 7,539 | 5,158 | 6,681 | 7,207 | 516 | 2,192 | 1,416 |
TMAFij=MADTTij/[∑(MADTT)j] × 12 MAFij; MAFij is the monthly adjustment factor for month i and vehicle class j truck
| MADTT | Class 4 | Class 5 | Class 6 | Class 7 | Class 8 | Class 9 | Class 10 | Class 11 | Class 12 | Class 13 |
|---|---|---|---|---|---|---|---|---|---|---|
| January | 0.86 | 0.87 | 0.84 | 0.80 | 0.58 | 0.95 | 0.81 | 1.19 | 0.78 | 1.05 |
| February | 0.87 | 0.89 | 0.62 | 0.79 | 0.61 | 1.17 | 0.82 | 0.88 | 0.83 | 0.92 |
| March | 0.88 | 0.89 | 0.83 | 0.89 | 0.69 | 1.12 | 0.87 | 0.58 | 0.90 | 1.40 |
| April | 0.92 | 0.94 | 0.91 | 0.95 | 0.70 | 1.24 | 0.98 | 1.44 | 0.87 | 1.31 |
| May | 0.98 | 1.00 | 1.00 | 0.99 | 0.98 | 1.02 | 0.94 | 1.05 | 0.85 | 1.20 |
| June | 1.04 | 1.06 | 1.12 | 1.18 | 1.08 | 1.05 | 1.09 | 1.51 | 1.02 | 1.40 |
| July | 1.10 | 1.12 | 1.17 | 1.26 | 1.14 | 1.12 | 1.09 | 1.91 | 1.21 | 1.02 |
| August | 1.18 | 1.20 | 1.17 | 1.25 | 1.44 | 1.12 | 1.13 | 0.74 | 1.29 | 0.81 |
| September | 1.21 | 1.24 | 1.23 | 1.18 | 1.54 | 0.81 | 1.21 | 1.56 | 1.47 | 0.57 |
| October | 1.10 | 1.08 | 1.24 | 1.03 | 1.31 | 0.87 | 1.19 | 0.28 | 1.03 | 0.54 |
| November | 1.00 | 0.84 | 0.97 | 0.89 | 0.98 | 0.70 | 1.01 | 0.42 | 0.91 | 0.81 |
| December | 0.87 | 0.86 | 0.91 | 0.79 | 0.96 | 0.83 | 0.88 | 0.44 | 0.83 | 0.98 |
| Total | 12.00 | 12.00 | 12.00 | 12.00 | 12.00 | 12.00 | 12.00 | 12.00 | 12.00 | 12.00 |
Source: Federal Highway Administration.
5. Vehicle Class Distribution
Vehicle class distribution (VCD) refers to AADTT distribution among the 10 vehicle types (FHWA’s 4 to 13 vehicle class). The percentage data are computed directly from vehicle classification data. There are 12 of such VCDs
| Class 4 | Class 5 | Class 6 | Class 7 | Class 8 | Class 9 | Class 10 | Class 11 | Class 12 | Class 13 | Total | |
|---|---|---|---|---|---|---|---|---|---|---|---|
| AADTT | 235 | 654 | 961 | 1,620 | 1,240 | 654 | 598 | 103 | 1,245 | 4,621 | 11,931 |
| % | 2.0 | 5.5 | 8.1 | 13.6 | 10.4 | 5.5 | 5.0 | 0.9 | 10.4 | 38.7 | 100.0 |
Source: Federal Highway Administration
VCDj=AADTTj/∑(AADTT)j; VCDj is the truck distribution factor for vehicle class j truck
6. Truck Hourly Distribution Factor (THDF)
Truck hourly distribution factor refers to the percentage of hourly AADTT among a 24 hour period starting at midnight. There are 24 THDFs.
| Start Time | End Time | Hourly Distribution | |
|---|---|---|---|
| Hourly-AADTT | % | ||
| 00:00 | 01:00 | 8 | 0.6 |
| 01:00 | 02:00 | 9 | 0.7 |
| 02:00 | 03:00 | 12 | 0.9 |
| 03:00 | 04:00 | 16 | 1.3 |
| 04:00 | 05:00 | 25 | 2.0 |
| 05:00 | 06:00 | 36 | 2.8 |
| 06:00 | 07:00 | 45 | 3.5 |
| 07:00 | 08:00 | 68 | 5.3 |
| 08:00 | 09:00 | 78 | 6.1 |
| 09:00 | 10:00 | 76 | 5.9 |
| 10:00 | 11:00 | 78 | 6.1 |
| 11:00 | 12:00 | 82 | 6.4 |
| 12:00 | 13:00 | 98 | 7.7 |
| 13:00 | 14:00 | 98 | 7.7 |
| 14:00 | 15:00 | 86 | 6.7 |
| 15:00 | 16:00 | 88 | 6.9 |
| 16:00 | 17:00 | 74 | 5.8 |
| 17:00 | 18:00 | 78 | 6.1 |
| 18:00 | 19:00 | 64 | 5.0 |
| 19:00 | 20:00 | 52 | 4.1 |
| 20:00 | 21:00 | 54 | 4.2 |
| 21:00 | 22:00 | 26 | 2.0 |
| 22:00 | 23:00 | 18 | 1.4 |
| 23:00 | 24:00 | 10 | 0.8 |
| Total | 1,279 | 100.0 | |
Source: Federal Highway Administration.
THDF%h=AADTTh/(AADTT); THDF%h is the truck distribution hourly factor for the hth hour of the day
7. Axle Load Factor
FHWA vehicles in class 4 to 13 can have a variety of axle configurations, including single axle, tandem axle, tridem axle, and quad axle. For a given vehicle class and axle configuration, axle weight varies depending on vehicle load. Axle Load Factor (ALF) is to capture that information in terms of distributions of vehicles based on axle weight under a given vehicle class and axle configuration for a given month. This is one of the most demanding data sets. Mathematically, the ALF is the percentage of a given axle load among all axle loads under a given vehicle axle configuration.
7a. Single Axle Configuration Axle Load Factor
There are 39 axle weight groups for single axle configuration vehicles. The axle weight group ranges from 3,000 lbs. to 41,000 lbs. with increments of 1,000 lbs. The computation of the axle load factor data is based on MADT for a particular vehicle class and axle weight group.
| Month | Jan | Jan | Jan | Jan | Jan | Jany | Jan | Jan | Jan | Jan | Feb | Feb | Dec | |
|---|---|---|---|---|---|---|---|---|---|---|---|---|---|---|
| Vehicle Class | 4 | 5 | 6 | 7 | 8 | 9 | 10 | 11 | 12 | 13 | 4 | 5 | 13 | |
| Axle Weight (lbs) | 3,000 | 1.8 | 10.05 | 2.47 | 2.14 | 11.65 | 1.74 | 3.64 | 3.55 | 6.68 | 8.88 | 1.8 | 10.03 | 8.88 |
| 4,000 | 0.96 | 13.21 | 1.78 | 0.55 | 5.37 | 1.37 | 1.24 | 2.91 | 2.29 | 2.67 | 0.96 | 13.21 | 2.67 | |
| 5,000 | 2.91 | 16.42 | 3.45 | 2.42 | 7.84 | 2.84 | 2.36 | 5.19 | 4.87 | 3.81 | 2.91 | 16.41 | 3.81 | |
| 6,000 | 3.99 | 10.61 | 3.95 | 2.7 | 6.99 | 3.53 | 3.38 | 5.27 | 5.86 | 5.23 | 3.99 | 10.61 | 5.23 | |
| 7,000 | 6.8 | 9.22 | 6.7 | 3.21 | 7.99 | 4.93 | 5.18 | 6.32 | 5.97 | 6.03 | 6.8 | 9.24 | 6.03 | |
| 8,000 | 11.47 | 8.27 | 8.45 | 5.81 | 9.63 | 8.43 | 8.35 | 6.98 | 8.86 | 8.1 | 11.47 | 8.27 | 8.1 | |
| 9,000 | 11.3 | 7.12 | 11.85 | 5.26 | 9.93 | 13.67 | 13.85 | 8.08 | 9.58 | 8.35 | 11.31 | 7.12 | 8.35 | |
| 10,000 | 10.97 | 5.85 | 13.57 | 7.39 | 8.51 | 17.68 | 17.35 | 9.68 | 9.94 | 10.69 | 10.97 | 5.85 | 10.69 | |
| 11,000 | 9.88 | 4.53 | 12.13 | 6.85 | 6.47 | 16.71 | 16.21 | 8.55 | 8.59 | 10.69 | 9.88 | 4.54 | 10.69 | |
| 12,000 | 8.54 | 3.46 | 9.48 | 7.42 | 5.19 | 11.57 | 10.27 | 7.29 | 7.11 | 11.11 | 8.54 | 3.46 | 11.11 | |
| 13,000 | 7.33 | 2.56 | 6.83 | 8.99 | 3.99 | 6.09 | 6.52 | 7.16 | 5.87 | 7.32 | 7.32 | 2.56 | 7.32 | |
| 14,000 | 5.55 | 1.92 | 5.05 | 8.15 | 3.38 | 3.52 | 3.94 | 5.65 | 6.61 | 3.78 | 5.55 | 1.92 | 3.78 | |
| 15,000 | 4.23 | 1.54 | 3.74 | 7.77 | 2.73 | 1.91 | 2.33 | 4.77 | 4.55 | 3.1 | 4.23 | 1.54 | 3.1 | |
| 16,000 | 3.11 | 1.19 | 2.66 | 6.84 | 2.19 | 1.55 | 1.57 | 4.35 | 3.63 | 2.58 | 3.11 | 1.19 | 2.58 | |
| 17,000 | 2.54 | 0.9 | 1.92 | 5.67 | 1.83 | 1.1 | 1.07 | 3.56 | 2.56 | 1.52 | 2.54 | 0.9 | 1.52 | |
| 18,000 | 1.98 | 0.68 | 1.43 | 4.63 | 1.53 | 0.88 | 0.71 | 3.02 | 2 | 1.32 | 1.98 | 0.68 | 1.32 | |
| 19,000 | 1.53 | 0.52 | 1.07 | 3.5 | 1.16 | 0.73 | 0.53 | 2.06 | 1.54 | 1 | 1.53 | 0.52 | 1 | |
| 20,000 | 1.19 | 0.4 | 0.82 | 2.64 | 0.97 | 0.53 | 0.32 | 1.63 | 0.98 | 0.83 | 1.19 | 0.4 | 0.83 | |
| 21,000 | 1.16 | 0.31 | 0.64 | 1.9 | 0.61 | 0.38 | 0.29 | 1.27 | 0.71 | 0.64 | 1.16 | 0.31 | 0.64 | |
| 22,000 | 0.66 | 0.31 | 0.49 | 1.31 | 0.55 | 0.25 | 0.19 | 0.76 | 0.51 | 0.38 | 0.66 | 0.31 | 0.38 | |
| 23,000 | 0.56 | 0.18 | 0.38 | 0.97 | 0.36 | 0.17 | 0.15 | 0.59 | 0.29 | 0.52 | 0.56 | 0.18 | 0.52 | |
| 24,000 | 0.37 | 0.14 | 0.26 | 0.67 | 0.26 | 0.13 | 0.17 | 0.41 | 0.27 | 0.22 | 0.37 | 0.14 | 0.22 | |
| 25,000 | 0.31 | 0.15 | 0.24 | 0.43 | 0.19 | 0.08 | 0.09 | 0.25 | 0.19 | 0.13 | 0.31 | 0.15 | 0.13 | |
| 26,000 | 0.18 | 0.12 | 0.13 | 1.18 | 0.16 | 0.06 | 0.05 | 0.14 | 0.15 | 0.26 | 0.18 | 0.12 | 0.26 | |
| 27,000 | 0.18 | 0.08 | 0.13 | 0.26 | 0.11 | 0.04 | 0.03 | 0.21 | 0.12 | 0.28 | 0.18 | 0.08 | 0.28 | |
| 28,000 | 0.14 | 0.05 | 0.08 | 0.17 | 0.08 | 0.03 | 0.02 | 0.07 | 0.08 | 0.12 | 0.14 | 0.05 | 0.12 | |
| 29,000 | 0.08 | 0.05 | 0.08 | 0.17 | 0.05 | 0.02 | 0.03 | 0.09 | 0.09 | 0.13 | 0.08 | 0.05 | 0.13 | |
| 30,000 | 0.05 | 0.02 | 0.05 | 0.08 | 0.04 | 0.01 | 0.02 | 0.06 | 0.02 | 0.05 | 0.05 | 0.02 | 0.05 | |
| 31,000 | 0.04 | 0.02 | 0.03 | 0.72 | 0.04 | 0.01 | 0.03 | 0.03 | 0.03 | 0.05 | 0.04 | 0.02 | 0.05 | |
| 32,000 | 0.04 | 0.02 | 0.03 | 0.06 | 0.12 | 0.01 | 0.01 | 0.04 | 0.01 | 0.08 | 0.04 | 0.02 | 0.08 | |
| 33,000 | 0.04 | 0.02 | 0.03 | 0.03 | 0.01 | 0.01 | 0.02 | 0.01 | 0.01 | 0.06 | 0.04 | 0.02 | 0.06 | |
| 34,000 | 0.03 | 0.02 | 0.02 | 0.03 | 0.02 | 0.01 | 0.01 | 0 | 0.01 | 0.02 | 0.03 | 0.02 | 0.02 | |
| 35,000 | 0.02 | 0.02 | 0.01 | 0.02 | 0.02 | 0 | 0.01 | 0 | 0 | 0.01 | 0.02 | 0.02 | 0.01 | |
| 36,000 | 0.02 | 0.02 | 0.01 | 0.02 | 0.01 | 0.01 | 0 | 0 | 0 | 0.01 | 0.02 | 0.02 | 0.01 | |
| 37,000 | 0.01 | 0.01 | 0.01 | 0.01 | 0.01 | 0 | 0.01 | 0.01 | 0.01 | 0.01 | 0.01 | 0.01 | 0.01 | |
| 38,000 | 0.01 | 0.01 | 0.01 | 0.01 | 0 | 0 | 0 | 0.02 | 0.01 | 0.01 | 0.01 | 0.01 | 0.01 | |
| 39,000 | 0.01 | 0 | 0.01 | 0.01 | 0.01 | 0 | 0.01 | 0.01 | 0 | 0.01 | 0.01 | 0 | 0.01 | |
| 40,000 | 0.01 | 0 | 0.01 | 0.01 | 0 | 0 | 0.04 | 0.02 | 0 | 0 | 0.01 | 0 | 0 | |
| 41,000 | 0 | 0 | 0 | 0 | 0 | 0 | 0 | 0 | 0 | 0 | 0 | 0 | 0 | |
| % of Total | 100 | 100 | 100 | 100 | 100 | 100 | 100 | 100 | 100 | 100 | 100 | 100 | 100 | 100 |
Source: Federal Highway Administration.
For tandem axle vehicles, the axle weight group starts at 6,000 lbs. and ends at 82,000, lbs. with increments of 2,000 lbs. For both tridem and quad axle vehicles, the axle weight group start at 12,000 lbs. and ends at 102,000 lbs. with increments of 3,000 lbs.
8. Number of Axle Types per Truck Class
The number of axles per vehicle class for a given axle configuration is an annual average number of axles per vehicle category (per vehicle class and vehicle axle configuration).
| Single Axle | Tandem | Tridem | Quad | |
|---|---|---|---|---|
| Class 4 | 1.62 | 0.39 | 0 | |
| Class 5 | 2 | 0 | 0 | |
| Class 6 | 1.02 | 0.99 | 0 | |
| Class 7 | 1 | 0.26 | 0.83 | |
| Class 8 | 2.38 | 0.67 | 0 | |
| Class 9 | 1.13 | 1.93 | 0 | |
| Class 10 | 1.19 | 1.09 | 0.89 | |
| Class 11 | 4.29 | 0.26 | 0.06 | |
| Class 12 | 3.52 | 1.14 | 0.06 | |
| Class 13 | 2.15 | 2.13 | 0.35 |
Source: Federal Highway Administration
9. Axle Spacing
Axle spacing data are only applicable to tandem, tridem, and quad vehicles in the sense for pavement design concepts discussed here. It is the distance between two consecutive tandem, tridem, and quad axles.
10. Average Axle Width
The distance between the two outside edges of an axle is defined as axle width
11. Wheelbase
The distance between the steering and the first device axle of a tractor or a heavy single unit. This definition is only applicable to the pavement design concept discussed here.
| Date Item # | Date Item Name | # of Data Points | Frequency | Foundation Data | Data Dimension |
|---|---|---|---|---|---|
| 1 | Annual Average Daily Truck Traffic | 1 | Annually | AADTT | By sum of all trucks |
| 2 | % of Truck Traffic in Design Direction | 1 | Annually | AADTT | By sum of all trucks and travel direction |
| 3 | % of Truck Traffic in Design Lane | 1 | Annually | AADTT | By sum of all trucks, travel direction, and travel lane |
| 4 | Truck Monthly Adjustment Factor | 120 | Monthly | MADTT | MADTT by truck class for each month in a year |
| 5 | Truck Classification | 12 | Annually | AADTT | AADTT by truck class |
| 6 | Truck Hourly Distribution | 24 | Annually | AADTT | AADTT by sum of all trucks by hour of the day |
| 7 | Axle Load Factor – Single Axle | 4680 | Monthly | MADTT | MADTT by truck class, axle configuration, and axle weight group |
| Axle Load Factor – Tandem | 4680 | Monthly | MADTT | MADTT by truck class, axle configuration, and axle weight group | |
| Axle Load Factor – Tridem | 3720 | Monthly | MADTT | MADTT by truck class, axle configuration, and axle weight group | |
| Axle Load factor – Quad | 3720 | Monthly | MADTT | MADTT by truck class, axle configuration, and axle weight group | |
| 8 | Number of Axles | 40 | Annually | AADTT | AADTT by truck class and axle configuration |
| 9 | Axle Spacing-tandem, tridem, and quad | 3 | Annually | AADTT | AADTT by axle configuration |
| 10 | Wheelbase | 3 | Annually | AADTT | AADTT by wheelbase |
Source: Federal Highway Administration.
Traffic data is one of the most critical elements in pavement design. Even though all traffic data used in pavement design reflects future traffic conditions, traffic monitoring programs and traffic monitoring data provide the needed ground truth in the projection processes including, but not limited to, establishing historical trend and model calibration and validation.

