U.S. Department of Transportation
Federal Highway Administration
1200 New Jersey Avenue, SE
Washington, DC 20590
202-366-4000
This chapter provides coding instructions and detailed record formats for the traffic data reported to FHWA as part of each State’s traffic monitoring program. The CSV format is acceptable for all formats described in this chapter. By-direction data should use the same format for all data submitted to FHWA. This chapter explains the record formats and reporting requirements for both motorized and non-motorized data. The types of motorized data include station, volume, speed, classification, weight, and per vehicle data.
These formats and instructions have been developed to provide input to national databases maintained by FHWA, including the Travel Monitoring Analysis System (TMAS). Each record format described in this chapter has a specific length. In order to submit a record format that is smaller or larger than the specified length, it is necessary to submit a CSV file with a pipe character “|” between each field in the record. This rule applies to all record formats described in this chapter. In addition, there are no decimals or commas used in any fields, other than when applicable in notes descriptions.
The data records for motorized data are divided into six types: station description data, traffic volume data, speed data, vehicle classification data, weight data, and the per vehicle data format (referred to as PVF). Each type of data has its own individualized record format. Specific coding instructions and record layouts are discussed separately for each type of data in the following sections.
Fields in the record formats include instructions to “blank fill” or “zero fill” those fields. This means that either leading blanks or zeros, starting at the left of the field are to be used when the value in the field does not consume all of the columns for the field. For example, if a field is five columns wide, and the data value is 250, then a blank-filled representation for this field is _ _ 250, and a zero-filled representation for this field is 00250.
In addition, each of the data fields on the record formats are labeled as critical, optional, or critical/optional. A designation of critical means that a record cannot be processed by the TMAS software without these fields being supplied. An optional designation indicates that the data is not required for the record to be processed by TMAS. The critical/optional designation indicates that in certain cases, this field may be critical for the record to be processed by TMAS, based on input of other data fields on the record, or, it may be optional. The designations for each field are included with their field definitions. Also, certain data items are common to all six types of records. For example, all records contain a six-character station identification field. This allows States to use a common identification system for all traffic monitoring stations. Also, it is important to note that data reporting requirements described in the TMG are in English units, not metric units.

Where:
ss= State FIPS code
abcxyz = traffic counting station ID (may be omitted if file contains more than one site’s data)
mm = month of data
yyyy = year of data
TYP = type of data using the following three-character names:
STA = station data
VOL = volume data
SPD = speed data
CLA = axle classification data
LEN = length classification data
WGT = weight data
PVF = per vehicle data
FHWA also recommends the use of consistent file naming conventions as this helps identify files, helps States perform quality assurance testing of the data they are utilizing, and provides an easy mechanism for identifying the content of files when transferring data to users. However, the use of the example file naming convention by the States is not required.
Record formats are also included in this chapter for non-motorized data. The two record formats described are non-motorized count station descriptionand non-motorized count record
Each of these records also includes fields, which are designated as critical or optional. A designation of critical means that a record should contain this field for the record to be processed. A designation of optional means that the record can be processed if this field is left blank on the record.
The remainder of this chapter is organized into the following sections
The Station Description record format is needed for reporting all data. If a Station Description record is omitted, any succeeding records for other record formats will not be processed by the TMAS software. The Station Description file contains one record per traffic monitoring station, per direction, per lane (unless lanes are combined by the data collection device), per year. In addition, updated station records can be submitted at any time during the year if an equipment change occurs at a site, which would result in a different type of data being submitted at that location. All fields on each record are character fields.
The TMAS software retains all approved station records as of December 31 of each year. FHWA recommends that a yearly review of all station record fields be conducted to insure the records are current and reflect what is in the field. It is expected that TMAS version 3.0 will have the capability to read all 2001 and 2012 TMG formats.

Table 7-1 summarizes the Station Description record format
| Field | Columns | Width | Description | Type |
|---|---|---|---|---|
| 1 | 1 | 1 | Record Type | C |
| 2 | 2-3 | 2 | FIPS State Code | C |
| 3 | 4-9 | 6 | Station ID | C |
| 4 | 10 | 1 | Direction of Travel Code | C |
| 5 | 11 | 1 | Lane of Travel | C |
| 6 | 12-15 | 4 | Year of Data | C |
| 7 | 16-17 | 2 | Functional Classification Code | C |
| 8 | 18 | 1 | Number of Lanes in Direction Indicated | C |
| 9 | 19 | 1 | Sample Type for TMAS | C |
| 10 | 20 | 1 | Number of Lanes Monitored for Traffic Volume | C |
| 11 | 21 | 1 | Method of Traffic Volume Counting | C |
| 12 | 22 | 1 | Number of Lanes Monitored for Vehicle Class | C |
| 13 | 23 | 1 | Method of Vehicle Classification | C/O |
| 14 | 24 | 1 | Algorithm for Vehicle Classification | C/O |
| 15 | 25-26 | 2 | Vehicle Classification Groupings | C/O |
| 16 | 27 | 1 | Number of Lanes Monitored for Truck Weight | C |
| 17 | 28 | 1 | Method of Truck Weighing | C/O |
| 18 | 29 | 1 | Calibration of Weighing System | C/O |
| 19 | 30 | 1 | Method of Data Retrieval | C |
| 20 | 31 | 1 | Type of Sensor | C |
| 21 | 32 | 1 | Second Type of Sensor | O |
| 22 | 33 | 1 | Primary Purpose | C |
| 23 | 34-93 | 60 | LRS Identification | C |
| 24 | 94-101 | 8 | LRS Location Point | C |
| 25 | 102-109 | 8 | Latitude | C |
| 26 | 110-118 | 9 | Longitude | C |
| 27 | 119-122 | 4 | LTPP Site Identification | O |
| 28 | 123-128 | 6 | Previous Station ID | O |
| 29 | 129-132 | 4 | Year Station Established | C |
| 30 | 133-136 | 4 | Year Station Discontinued | O |
| 31 | 137-139 | 3 | FIPS County Code | C |
| 32 | 140 | 1 | HPMS Sample Type | C |
| 33 | 141-152 | 12 | HPMS Sample Identifier | C/O |
| 34 | 153 | 1 | National Highway System | C |
| 35 | 154-155 | 2 | Posted Route Signing | C |
| 36 | 156-163 | 8 | Posted Signed Route Number | C |
| 37 | 164-213 | 50 | Station Location | O |
Note: C=Critical, C/O=Critical/Optional, O=Optional
Fields designated as Critical are required for entry of this record into the TMAS software
Fields designated as Optional on the record formats in this chapter are not required for that record format only. Follow the coding instructions as indicated for each optional field.
Fields designated as Critical/Optional could be either critical or optional based on values used for other related fields.
The fields for the Station Description record are:
1. Record Type (Column 1) – Critical
S = station description record (Code the letter “S” in the first column.)
2. FIPS State Codes (Columns 2-3) – Critical
| State | Code | State | Code | State | Code |
|---|---|---|---|---|---|
| Alabama | 1 | Maine | 23 | Pennsylvania | 42 |
| Alaska | 2 | Maryland | 24 | Rhode Island | 44 |
| Arizona | 4 | Massachusetts | 25 | South Carolina | 45 |
| Arkansas | 5 | Michigan | 26 | South Dakota | 46 |
| California | 6 | Minnesota | 27 | Tennessee | 47 |
| Colorado | 8 | Mississippi | 28 | Texas | 48 |
| Connecticut | 9 | Missouri | 29 | Utah | 49 |
| Delaware | 10 | Montana | 30 | Vermont | 50 |
| D.C. | 11 | Nebraska | 31 | Virginia | 51 |
| Florida | 12 | Nevada | 32 | Washington | 53 |
| Georgia | 13 | New Hampshire | 33 | West Virginia | 54 |
| Hawaii | 15 | New Jersey | 34 | Wisconsin | 55 |
| Idaho | 16 | New Mexico | 35 | Wyoming | 56 |
| Illinois | 17 | New York | 36 | Puerto Rico | 72 |
| Indiana | 18 | North Carolina | 37 | American Samoa | 60 |
| Iowa | 19 | North Dakota | 38 | Guam | 66 |
| Kansas | 20 | Oregon | 41 | Northern Mariana Islands | 69 |
| Kentucky | 21 | Ohio | 39 | Virgin Islands of the U.S. | 78 |
| Louisiana | 22 | Oklahoma | 40 |
Canadian Provinces may use TMAS with the following codes (based on the LTPP):
| State | Code | State | Code | State | Code |
|---|---|---|---|---|---|
| Alberta | 81 | Nova Scotia | 86 | Yukon | 91 |
| British Columbia | 82 | Ontario | 87 | Northwest Territory | 92 |
| Manitoba | 83 | Prince Edward Island | 88 | Labrador | 93 |
| New Brunswick | 84 | Quebec | 89 | Nunavut | 94 |
| Newfoundland | 85 | Saskatchewan | 90 |
3.Station Identification (Columns 4-9) – Critical
This field should contain an alphanumeric designation for the station where the survey data is collected. Station identification field entries must be identical in all records for a given station. Differences in characters, including spaces, blanks, hyphens, etc., prevent proper match.
Right justify the Station ID if it is less than 6 characters. This field should be right-justified with unused columns zero-filled. This field can only be longer than 6 characters if the CSV pipe format is used for all fields on the record.
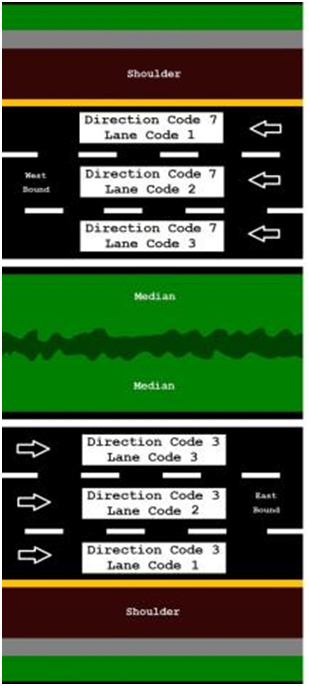
4.Direction of Travel Code (Column 10) – Critical
Combined directions are only permitted for volume stations only. There should be a separate record for each direction identified in Table 7-3. Whether or not lanes are combined in each direction depends on field #5, Lane of Travel.
| Code | Direction |
|---|---|
| 1 | North |
| 2 | Northeast |
| 3 | East |
| 4 | Southeast |
| 5 | South |
| 6 | Southwest |
| 7 | West |
| 8 | Northwest |
| 9 | North-South or Northeast-Southwest combined (volume stations only) |
| 0 | East-West or Southeast-Northwest combined (volume stations only) |
5. Lane of Travel (Column 11) – Critical
Either each lane is considered a separate station or all lanes in each direction are combined.
| Code | Lane |
|---|---|
| 0 | Data with lanes combined |
| 1 | Outside (rightmost) lane |
| 2-9 | Other lanes |
Note: The Station ID, Direction of Travel, and Lane of Travel make up the Station Code. There should be one Station Description record per Station Code. Stations can be either by lane or with lanes combined by direction, but not both.
All data for volume, class, and speed should be reported with the same resolution of being by lane/direction or lanes combined/direction to be consistent in the station record for all data types submitted. All data in either weight or PVF must be submitted by individual lane and by individual direction.
Source: Federal Highway Administration.
6. Year of Data (Columns 12-15) – Critical
Code the four digits of the year in which the data were collected.
7. Functional Classification Code (Columns 16-17) – Critical
Column 16 contains one of the Functional Classification Codes listed in Table 7-5. Column 17 contains either an “R” for rural or “U” for urban. For example, a code of 2R indicates a Rural Principal Arterial – Other Freeways and Expressways.
| Code | Functional Classification |
|---|---|
| 1 | Interstate |
| 2 | Principal Arterial – Other Freeways and Expressways |
| 3 | Principal Arterial – Other |
| 4 | Minor Arterial |
| 5 | Major Collector |
| 6 | Minor Collector |
| 7 | Local |
8. Number of Lanes in Direction Indicated (Column 18) – Critical
Code the number of lanes in one direction at the site regardless of the number of lanes being monitored. Use 9 if there are more than eight lanes.
9.Sample Type for TMAS (Column 19) – Critical
Y = Station used for TMAS
N = Station not used for TMAS
Data submitted to TMAS may be from research or other needs that do not follow the trends in a given State and may not be for long-term purposes.
10. Number of Lanes Monitored for Traffic Volume (Column 20) – Critical
Code the number of lanes in one direction that are monitored at this site. Use 9 if there are more than eight lanes.
11. Method of Traffic Volume Counting (Column 21) – Critical
1 = Human observation (manual
2 = Portable traffic recording device
3 = Permanent continuous count station (CCS) formerly ATR
12. Number of Lanes Monitored for Vehicle Classification and/or speed (Column 22) – Critical
Code the number of lanes in one direction that are monitored for vehicle classification and/or speed at this site. Use 9 if there are more than eight lanes in a given direction
13. Method of Vehicle Classification and/or speed (Column 23) – Critical/Optional
Blank-fill this field when unused
1 = Human observation (manual) vehicle classification
2 = Portable vehicle classification device
3 = Permanent vehicle classification device
4 = Speed only site
14. Algorithm for Vehicle Classification (Column 24) – Critical/Optional
Blank-fill this field when unused
Code the type of input and processing used to classify vehicles:
A = Human observation on site (manual)
B = Human observation of vehicle image (e.g., video)
C = Automated interpretation of vehicle image or signature (e.g., video, microwave, sonic, radar)
D = Vehicle length classification
E = Axle spacing with ASTM Standard E1572
F = Axle spacing with FHWA 13 Vehicle Types
F = Axle spacing with FHWA 13 Vehicle Types
G = Axle spacing with FHWA 13 Vehicle Types (modified)
H = Other axle spacing algorithm
K = Axle spacing and weight algorithm
L = Axle spacing and vehicle length algorithm
M = Axle spacing, weight, and vehicle length algorithm
N = Axle spacing and other input(s) not specified above
R = LTPP classification algorithm (The details of this scheme can be obtained in the report Verification, Refinement, and Applicability of LTPP Classification Scheme.)
S = State specific algorithm
V = Vendor default algorithm
Z = Other means not specified above
15. Vehicle Classification Groupings (Columns 25-26) – Critical/Optional
The value in this field indicates the total number of classes in the vehicle classification system being used as well as how vehicles are grouped together in those classes in relation to the 13 FHWA categories. The recommended default value is 13, which indicates that the standard FHWA 13 vehicle category classification system (see Appendix C) is being used. Other vehicle classification systems may be based on the HPMS or specific States’ classification schema documented in the State’s Traffic Monitoring System (TMS) documentation. The value that is placed in columns 25 and 26 will determine the number of count fields needed on the Vehicle Classification Record (see Section 7.5). The following list indicates the acceptable values that can be entered into Columns 25 and 26 and their meaning. In the following table, the numbers in parentheses refer to the 13 FHWA classes, and describe how the FHWA classes relate to the classes being reported. Blank-fill this field when unused.
| Value Entered Into Columns 25-26 |
Number of Groups | How Vehicles are Classified |
|---|---|---|
| 02 | Two groups | (classes 1-3) vehicles (classes 4-7; 8-10; 11-13) vehicles |
| 03 | Three groups | (classes 1-3) vehicles single-unit (classes 4-7) (classes 8-13) vehicles |
| 04 | Four groups | (classes 1-3) vehicles single-unit vehicles (classes 4-7) single-trailer vehicles (classes 8-10) multiple -trailer vehicles (classes 11-13) |
| 05 | Five groups | motorcycles (class 1) two-axle, four-tire vehicles (classes 2-3) buses and single-unit vehicles (classes 4-7) single-trailer combination vehicles (classes 8-10) multiple-trailer combination vehicles (classes 11-13) |
| 06 | Six groups | motorcycles (class 1) two-axle, four-tire vehicles (classes 2-3) buses (class 4) single-unit vehicles (classes 5-7) single-trailer combination vehicles (classes 8-10) multiple-trailer combination vehicles (classes 11-13) |
| 13 | FHWA’s standard 13 class system | |
| Other Positive Integers | number of classes (unsupported by TMAS software |
16. Number of Lanes Monitored for Truck Weight (Column 27) – Critical
Code the number of lanes in one direction that are monitored for truck weight at this site. Use 9 if there are more than eight lanes.
17. Method of Truck Weighing (Column 28) – Critical/Optional
Blank-fill this field when unused.
1 = Portable static scale
2 = Chassis-mounted, towed static scale
3 = Platform or pit static scale
4 = Portable weigh-in-motion system
5 = Permanent weigh-in-motion system
18. Calibration of Weighing System (Column 29) – Critical/Optional
Code the method used to calibrate the weighing system, e.g., comparing weigh-in-motion and weights from static scales. At a minimum, yearly calibration is recommended, and maybe more often depending upon the site, sensors, equipment, and array used. Blank-fill this field when unused.
A = ASTM Standard E1318
B = Subset of ASTM Standard E1318
C = Combination of test trucks and trucks from the traffic stream (but not ASTM E1318)
D = Other sample of trucks from the traffic stream
M = Statistical average of the steering axle of class nines
R = LTPP Calibration Method
S = Static calibration
T = Test trucks only
U = Uncalibrated
Z = Other method
19. Method of Data Retrieval (Column 30) – Critical
Blank-fill this field when unused.
1 = Not automated (manual)
2 = Automated (telemetry)
20. Type of Sensor (Column 31) – Critical
Code the type of sensor used for traffic detection.
A = Automatic vehicle identification (AVI)
B = Bending plate
C = Capacitance strip
D = Capacitance mat/pad
E = Load cells (hydraulic or mechanical
F = Fiber optic
G = Strain gauge on bridge beam
H = Human observation (manual)
I = Infrared
K = Laser/Lidar
L = Inductive loop
M = Magnetometer
P = Piezoelectric
Q = Quartz piezoelectric
R = Road tube
S = Sonic/acoustic
T = Tape switch
U = Ultrasonic
V = Video image
W = Microwave (radar)
X = Radio wave (radar)
Z = Other
21. Second Type of Sensor (Column 32) – Optional
If there are two types of sensors at the station, code the second using the same codes as Type of Sensor. Otherwise, code N for none. Blank-fill this field when unused.
22.Primary Purpose (Column 33) – Critical
This field indicates the primary purpose for installing the station and hence which organization is responsible for it and supplies the data.
E = Enforcement purposes (e.g., speed or weight enforcement)
I = Operations purposes in support of ITS initiatives
L = Load data for pavement design or pavement management purposes
O = Operations purposes but not ITS
P = Planning or traffic statistics including HPMS reporting purposes
R = Research purposes (e.g., LTPP)
23. LRS Identification (Columns 34-93) (60 characters) – Critical
The LRS Identification reported in this item for the station must be the same as the LRS identification reported in the HPMS for the section of roadway where the station is located. The LRS identification is a 60-character, right justified value. The LRS ID can be alphanumeric, but must not contain blanks; leading zeros must be coded. More information concerning the LRS may be found in Chapter III of the HPMS Field Manual, Linear Referencing System Requirements.
24. LRS Location Point (Columns 94-101) (8 digits) – Critical
This is the LRS location point for the station. It is similar information to the LRS Beginning Point and LRS Ending Point in the HPMS. The milepoint for the station must be within the range of the LRS beginning point and LRS ending point for the roadway section upon which the station is located. It is coded in miles, to the nearest thousandth of a mile, with an implied decimal in the middle: XXXX.XXX
25. Latitude (Columns 102-109) – Critical
This is the latitude of the station location with the north hemisphere assumed and decimal place understood as XX.XXX XXX. If the value is 39.166 400 (Kansas), then the field is coded as ‘39166400’, with an implied decimal point after the second digit.
26. Longitude (Columns 110-118) – Critical
This is the longitude of the station location with the west hemisphere assumed and decimal place understood as XXX.XXX XXX. If the value is 088.354 800 (Kansas), then the field is coded as ‘088354800’, with an implied decimal point after the third digit.
27. LTPP Site Identification (Columns 119-122) – Optional
If the site is used in the LTPP sample, give the LTPP site ID
Blank-fill this field when unused.
28.Previous Station ID (Columns 123-128) – Optional
If the station replaces another station, give the station ID that was used previously. Blank-fill this field when unused.
29. Year Station Established (Columns 129-132) – Critical
Code the four digits of the appropriate year if known.
30. Year Station Discontinued (Columns 133-136) –Optional
Code the four digits of the appropriate year if known. Blank-fill this field when unused.
31. FIPS County Code (Columns 137-139) –Critical
Use the three-digit FIPS county code (see Federal Information Processing Standards Publication 6, Counties of the States of the United States).
32. HPMS Sample Type (Column 140) – Critical
N = No, not on an HPMS standard sample section
Y = Yes, on an HPMS standard sample section
33. HPMS Sample Identifier (Columns 141-152) – Critical/Optional
If the station is on an HPMS standard sample section, code the HPMS Sample Identifier per the HPMS Field Manual (Field 7 in the HPMS Sample Panel Identification dataset). Blank-fill this field when unused.
34. National Highway System (Column 153) – Critical
N = No, not on National Highway System
Y = Yes, on National Highway System
35. Posted Route Signing (Column 154-155) – Critical
This is the same as Route Signing in HPMS Field Manual, 2012 (Data Item 18 in HPMS Sections dataset).
| Code | Description |
|---|---|
| 1 | Not signed |
| 2 | Interstate |
| 3 | U.S. |
| 4 | State |
| 5 | Off-Interstate Business Marker |
| 6 | County |
| 7 | Township |
| 8 | Municipal |
| 9 | Parkway Marker or Forest Route Marker |
| 10 | None of the above |
36. Posted Signed Route Number (Columns 156-163) – Critical
Code the route number of the principal route on which the station is located. This is the same as Signed Route Number in HPMS Field Manual, 2012 (Data Item 17 in HPMS Sections dataset).
If the station is located on a city street, zero-fill this field.
37.Station Location (Columns 164-213) – Optional
This is an English text entry field. For stations located on a numbered route, enter the name of the nearest major intersecting route, State border, or landmark on State road maps and the distance and direction of the station from that landmark to the station (e.g., “12 miles south of the Kentucky border”). If the station is located on a city street, enter the city and street name. Abbreviate if necessary. Left justify this field.
Blank-fill this field when unused.
VOLUME SITE (4 LANE SITE WITH ALL LANES AND DIRECTIONS COMBINED) STATION FILE
| Column Number: |
1 | 2-3 | 4-9 | 10 | 11 | 12-15 | 16-17 | 18 | 19 | 20 | 21 |
| Content Example: |
S | 17 | 01810A | 9 | 0 | 2012 | 2R | 2 | Y | 2 | 3 |
continued
| Column Number: |
22 | 23 | 24 | 25-26 | 27 | 28 | 29 | 30 | 31 | 32 | 33 |
| Content Example: |
0 | Blank | Blank | Blank | 0 | Blank | Blank | 2 | L | Blank | P |
continued
| Column Number: |
34-93 | 94-101 | 102-109 | 110-118 | 119-122 | ||||||
| Content Example: |
00000000000000000000000000000000000867K65T4RE348 | 00785600 | 39166400 | 088354800 | Blank | ||||||
continued
| Column Number: |
123-128 | 129-132 | 133-136 | 137-139 | 140 | 141-152 | 153 | 154-155 | 156-163 | 164-213 | |
| Content Example: |
Blank | 2001 | Blank | 049 | Y | 000012345000 | Y | 03 | 00000404 | .6 miles past old Mill Road | |
CLASSIFICATION (8 LANE SITE WITH ONLY LANES COMBINED) SITE STATION FILE
| Column Number: |
1 | 2-3 | 4-9 | 10 | 11 | 12-15 | 16-17 | 18 | 19 | 20 | 21 |
| Content Example: |
S | 17 | 01811B | 1 | 0 | 2012 | 1R | 4 | Y | 4 | 3 |
| Content Example: |
S | 17 | 01811B | 5 | 0 | 2012 | 1R | 4 | Y | 4 | 3 |
continued
| Column Number: |
22 | 23 | 24 | 25-26 | 27 | 28 | 29 | 30 | 31 | 32 | 33 |
| Content Example: |
2 | 3 | F | 13 | 0 | Blank | Blank | 2 | L | L | P |
| Content Example: |
2 | 3 | F | 13 | 0 | Blank | Blank | 2 | L | L | P |
continued
| Column Number: |
34-93 | 94-101 | 102-109 | ||||||||
| Content Example: |
00000000000000000000000000000000000000000000000880IR5T4RE348 | 00785600 | 39166400 | ||||||||
| Content Example: |
00000000000000000000000000000000000000000000000880IR5T4RE348 | 00785600 | 39166400 | ||||||||
continued
| Column Number: |
110-118 | 119-122 | 123-128 | 129-132 | 133-136 | 137-139 | 140 | 141-152 | 153 | 154-155 | 156-163 |
| Content Example: |
088354800 | Blank | Blank | 1945 | Blank | 049 | N | Blank | Y | 20 | 00000708 |
| Content Example: |
088354800 | Blank | Blank | 1945 | Blank | 049 | N | Blank | Y | 20 | 00000708 |
continued
| Column Number: |
164-213 | ||||
| Content Example: |
.5 miles past Steven City near County Line Road | ||||
| Content Example: |
.5 miles past Steven City near County Line Road | ||||
WEIGHT SITE (2 LANE SITE) STATION FILE
| Column Number: |
1 | 2-3 | 4-9 | 10 | 11 | 12-15 | 16-17 | 18 | 19 | 20 | 21 | 22 | 23 | 24 | 25-26 | 27 | 28 | 29 | 30 | 31 | 32 | 33 |
| Content Example: |
S | 17 | 01812C | 1 | 1 | 2012 | 1R | 1 | Y | 4 | 3 | 1 | 3 | F | 13 | 1 | 5 | A | 2 | Q | L | L |
| Content Example: |
S | 17 | 01812C | 5 | 1 | 2012 | 1R | 1 | Y | 4 | 3 | 1 | 3 | F | 13 | 1 | 5 | A | 2 | Q | L | L |
continued
| Column Number: |
34-93 | 94-101 | 102-109 | ||||||||||||||||
| Content Example: |
00000000000000000000000000000000000000000000000890IR5T4RE348 | 00785600 | 39166400 | ||||||||||||||||
| Content Example: |
00000000000000000000000000000000000000000000000890IR5T4RE348 | 00785600 | 39166400 | ||||||||||||||||
continued
| Column Number: |
110-118 | 119-122 | 123-128 | 129-132 | 133-136 | 137-139 | 140 | ||||||||||||||
| Content Example: |
088354800 | Blank | Blank | 1965 | Blank | 049 | Y | ||||||||||||||
| Content Example: |
088354800 | Blank | Blank | 1965 | Blank | 049 | Y | ||||||||||||||
continued
| Column Number: |
141-152 | 153 | 154-155 | 156-163 | 164-213 | |||||||||||||||||||||
| Content Example: |
008905673459 | Y | 20 | 00000708 | .5 miles past Steven City near County Line Road | |||||||||||||||||||||
| Content Example: |
008905673459 | Y | 20 | 00000708 | .5 miles past Steven City near County Line Road | |||||||||||||||||||||
The Hourly Traffic Volume Record format is a fixed length, fixed field record. One record is used for each calendar day for which traffic monitoring data is being submitted. Each record contains a field for traffic volume occurring during each of the 24 hours of that day. Blank fill the columns used for any hours during which no data is being reported. Table 7-9 summarizes the Hourly Traffic Volume record.
All numeric fields should be right-justified and blank fill the columns for which no data is being reported.

As a reminder, pipe characters “|” can be used between each field in the record if the record length needs to be shorter or longer than the record length of 153 columns, as identified in Table 7-9.
| Field | Columns | Width | Description | Type |
|---|---|---|---|---|
| 1 | 1 | 1 | Record Type | C |
| 2 | 2-3 | 2 | FIPS State Code | C |
| 3 | 4-5 | 2 | Functional Classification | C |
| 4 | 6-11 | 6 | Station Identification | C |
| 5 | 12 | 1 | Direction of Travel | C |
| 6 | 13 | 1 | Lane of Travel | C |
| 7 | 14-17 | 4 | Year of Data | C |
| 8 | 18-19 | 2 | Month of Data | C |
| 9 | 20-21 | 2 | Day of Data | C |
| 10 | 22 | 1 | Day of Week | C |
| 11 | 23-27 | 5 | Traffic Volume Counted, after 00:00 – to 01:00 | O |
| 12 | 28-32 | 5 | Traffic Volume Counted, after 01:00 – to 02:00 | O |
| 13 | 33-37 | 5 | Traffic Volume Counted, after 02:00 – to 03:00 | O |
| 14 | 38-42 | 5 | Traffic Volume Counted, after 03:00 – to 04:00 | O |
| 15 | 43-47 | 5 | Traffic Volume Counted, after 04:00 – to 05:00 | O |
| 16 | 48-52 | 5 | Traffic Volume Counted, after 05:00 - to 06:00 | O |
| 17 | 53-57 | 5 | Traffic Volume Counted, after 06:00 – to 07:00 | O |
| 18 | 58-62 | 5 | Traffic Volume Counted, after 07:00 – to 08:00 | O |
| 19 | 63-67 | 5 | Traffic Volume Counted, after 08:00 – to 09:00 | O |
| 20 | 68-72 | 5 | Traffic Volume Counted, after 09:00 – to 10:00 | O |
| 21 | 73-77 | 5 | Traffic Volume Counted, after 10:00 – to 11:00 | O |
| 22 | 78-82 | 5 | Traffic Volume Counted, after 11:00 – to 12:00 | O |
| 23 | 83-87 | 5 | Traffic Volume Counted, after 12:00 - to 13:00 | O |
| 24 | 88-92 | 5 | Traffic Volume Counted, after 13:00 – to 14:00 | O |
| 25 | 93-97 | 5 | Traffic Volume Counted, after 14:00 – to 15:00 | O |
| 26 | 98-102 | 5 | Traffic Volume Counted, after 15:00 – to 16:00 | O |
| 27 | 103-107 | 5 | Traffic Volume Counted, after 16:00 – to 17:00 | O |
| 28 | 108-112 | 5 | Traffic Volume Counted, after 17:00 – to 18:00 | O |
| 29 | 113-117 | 5 | Traffic Volume Counted, after 18:00 - to 19:00 | O |
| 30 | 118-122 | 5 | Traffic Volume Counted, after 19:00 – to 20:00 | O |
| 31 | 123-127 | 5 | Traffic Volume Counted, after 20:00 – to 21:00 | O |
| 32 | 128-132 | 5 | Traffic Volume Counted, after 21:00 – to 22:00 | O |
| 33 | 133-137 | 5 | Traffic Volume Counted, after 22:00 – to 23:00 | O |
| 34 | 138-142 | 5 | Traffic Volume Counted, after 23:00 – to 24:00 | O |
| 35 | 143 | 1 | Restrictions | C |
Note: C=Critical, C/O=Critical/Optional, O=Optional
Fields designated as Critical are required for entry into the TMAS software.
Fields designated as Optional are not required for this record to be processed in TMAS.*
The Hourly Traffic Volume record is defined as follows (note that the data items used in both the Hourly Traffic Volume Record and the Station Description Record are not redefined below, but simply referenced to the earlier definitions in Section 7.2):
1. Record Type (Column 1) – Critical
3 = Traffic volume record (Code the value “3” in the first column.)
2. FIPS State Code (Columns 2-3) – See section 7.2, Field #2. – Critical
3. Functional Classification Code (Columns 4-5) – See section 7.2, Field #7. – Critical
4. Station Identification (Columns 6-11) – See section 7.2, Field #3. – Critical
This should be right-justified with unused columns zero-filled. – Critical
5. Direction of Travel Code (Column 12) - See section 7.2, Field #4. – Critical
6. Lane of Travel (Column 13) – See section 7.2, Field #5. – Critical
The code for data being submitted with all lanes combined is zero (0).
7. Year of Data (Columns 14-17) – See section 7.2, Field #6. – Critical
8. Month of Data (Columns 18-19) – Critical
01 = January
02 = February
03 = March
04 = April
05 = May
06 = June
07 = July
08 = August
09 = September
10 = October
11 = November
12 = December
9. Day of Data (Columns 20-21) – Critical
Code the day of the month of data, 01-31. Must correspond to the month of data.
10. Day of Week (Column 22) – Critical
1 = Sunday
2 = Monday
3 = Tuesday
4 = Wednesday
5 = Thursday
6 = Friday
7 = Saturday
11.through 34. Traffic Volume Counted Fields (Columns 23-27, ..., 138-142) - Optional
Enter the traffic volume counted during the hour covered in the columns indicated in Table 7-10.
If the data is missing, blank fill the appropriate columns.
| Field | Hour Covered |
|---|---|
| 11 | after 00:00 to 01:00 |
| 12 | after 01:00 to 02:00 |
| 13 | after 02:00 to 03:00 |
| 14 | after 03:00 to 04:00 |
| 15 | after 04:00 to 05:00 |
| 16 | after 05:00 to 06:00 |
| 17 | after 06:00 to 07:00 |
| 18 | after 07:00 to 08:00 |
| 19 | after 08:00 to 09:00 |
| 20 | after 09:00 to 10:00 |
| 21 | after 10:00 to 11:00 |
| 22 | after 11:00 to 12:00 |
| 23 | after 12:00 to 13:00 |
| 24 | after 13:00 to 14:00 |
| 25 | after 14:00 to 15:00 |
| 26 | after 15:00 to 16:00 |
| 27 | after 16:00 to 17:00 |
| 28 | after 17:00 to 18:00 |
| 29 | after 18:00 to 19:00 |
| 30 | after 19:00 to 20:00 |
| 31 | after 20:00 to 21:00 |
| 32 | after 21:00 to 22:00 |
| 33 | after 22:00 to 23:00 |
| 34 | after 23:00 to 24:00 |
35. Restrictions (Column 143) -Critical
0 = no restrictions
1 = construction or other activity affected traffic flow, traffic pattern not impacted
2= traffic counting device problem (e.g., malfunction or overflow)
3 = weather affected traffic flow, traffic pattern not impacted
4 = construction or other activity affected traffic flow, traffic pattern impacted
5 = weather affected traffic flow, traffic pattern impacted
VOLUME SITE (4 LANES WITH ALL LANES AND DIRECTIONS COMBINED) VOLUME FILE
| Column Number: |
1 | 2-3 | 4-5 | 6-11 | 12 | 13 | 14-17 | 18-19 | 20-21 | 22 | 23-27 | 28-32 |
| Content Example: |
3 | 17 | 2R | 01710A | 9 | 0 | 2012 | 04 | 25 | 4 | 00046 | 00022 |
continued
| Column Number: |
33-37 | 38-42 | 43-47 | 48-52 | 53-57 | 58-62 | 63-67 | 68-72 | 73-77 | 78-82 | 83-87 | 88-92 |
| Content Example: |
00014 | 00013 | 00029 | 00030 | 00075 | 00136 | 00179 | 00218 | 00264 | 00293 | 00322 | 00401 |
continued
| Column Number: |
93-97 | 108-112 | 113-117 | 118-122 | 123-127 | 128-132 | 133-137 | 138-142 | 143 |
| Content Example: |
00439 | 00366 | 00261 | 00202 | 00143 | 00098 | 00054 | 00022 | 0 |
VOLUME SITE (4 LANES WITH ONLY LANES COMBINED) VOLUME FILE
| Column Number: |
1 | 2-3 | 4-5 | 6-11 | 12 | 13 | 14-17 | 18-19 | 20-21 | 22 | 23-27 | 28-32 | 33-37 |
| Content Example: |
3 | 17 | 2R | 018130 | 3 | 0 | 2012 | 04 | 25 | 4 | 00005 | 00004 | 00004 |
| Content Example: |
3 | 17 | 2R | 018130 | 3 | 0 | 2012 | 04 | 25 | 4 | 00008 | 00001 | 00003 |
continued
| Column Number: |
38-42 | 43-47 | 48-52 | 53-57 | 58-62 | 63-67 | 68-72 | 73-77 | 78-82 | 83-87 | 88-92 | 93-97 | 98-102 |
| Content Example: |
00002 | 00001 | 00001 | 00005 | 00003 | 00012 | 00016 | 00019 | 00019 | 00019 | 00026 | 00019 | 00020 |
| Content Example: |
00003 | 00004 | 00000 | 00000 | 00001 | 00004 | 00009 | 00019 | 00015 | 00014 | 00022 | 00026 | 00015 |
continued
| Column Number: |
103-17 | 108-112 | 113-117 | 118-122 | 123-127 | 128-132 | 133-137 | 138-142 | 143 |
| Content Example: |
00015 | 00019 | 00014 | 00011 | 00009 | 00013 | 00004 | 00002 | 0 |
| Content Example: |
00019 | 00011 | 00005 | 00016 | 00003 | 00010 | 00006 | 00004 | 0 |
The speed data file format is a variable length record used to report the number of vehicles traveling in specified 5 mph speed bins during specified time periods. Each record can contain 1 hour of data, 15 minutes of data, or 5 minutes of data. The submitting State chooses the time interval for which data is being reported and indicates that time interval as a field in the record.
To submit data to FHWA, the speed data format must have a minimum of 15 bins up to a maximum of 25 bins and should supply data in 5 mph speed bins defined as being required by FHWA. Any speed data records that do not meet these data specifications are purged by the TMAS software. All records should follow the record formats defined in the TMG. In addition to the minimum and maximum number of bins, a State may choose to report data in additional speed bins (see next paragraph). When submitting data only using the minimum number of speed bins (15), the first speed bin includes all vehicles traveling 20 mph or slower. The second speed bin is then defined as all vehicles traveling faster than 20 mph but less than or equal to 25 mph. The last of the fifteen speed bins is defined as all vehicles traveling faster than 85 mph.
If they desire, States may submit one or two additional speed bins for slow traveling vehicles. They may create one additional slow speed bin (for vehicles traveling 15 mph or slower), or two slow speed bins (one for vehicles traveling 10 mph or slower, and the other for vehicles traveling greater than 10 mph up to 15 mph.) Similarly, a State may create additional high speed bins. Up to eight additional bins may be added to provide more detail on high speed travel. The number of additional high speed bins being reported should be indicated on the speed record. Finally, when additional high speed bins are reported, the length of the speed record changes

Table 7-12 summarizes the Vehicle Speed record format.
| Field | Columns | Width | Description | Type |
|---|---|---|---|---|
| 1 | 1 | 1 | Record Type | C |
| 2 | 2-3 | 2 | FIPS State Code | C |
| 3 | 4-9 | 6 | Station ID | C |
| 4 | 10 | 1 | Direction of Travel Code | C |
| 5 | 11 | 1 | Lane of Travel | C |
| 6 | 12-15 | 4 | Year of Data | C |
| 7 | 16-17 | 2 | Month of Data | C |
| 8 | 18-19 | 2 | Day of Data | C |
| 9 | 20-21 | 2 | Hour of Data | C |
| 10 | 22 | 1 | Speed Data Time Interval | O |
| 11 | 23 | 1 | Definition of First Speed Bin | O |
| 12 | 24-25 | 2 | Total Number of Speed Bins Reported | O |
| 13 | 26-30 | 5 | Total Interval Volume | O |
| 14 | 31-35 | 5 | Bin 1 Count | C |
| 15 | 36-40 | 5 | Bin 2 Count | C |
| 16 | 41-45 | 5 | Bin 3 Count | C |
| 17 | 46-50 | 5 | Bin 4 Count | C |
| 18 | 51-55 | 1 | Bin 5 Count | C |
| 19 | 56-60 | 5 | Bin 6 Count | C |
| 20 | 61-65 | 5 | Bin 7 Count | C |
| 21 | 66-70 | 5 | Bin 8 Count | C |
| 22 | 71-75 | 5 | Bin 9 Count | C |
| 23 | 76-80 | 5 | Bin 10 Count | C |
| 24 | 81-85 | 5 | Bin 11 Count | C |
| 25 | 86-90 | 5 | Bin 12 Count | C |
| 26 | 91-95 | 5 | Bin 13 Count | C |
| 27 | 96-100 | 5 | Bin 14 Count | C |
| 28 | 101-105 | 5 | Bin 15 Count | C |
| 29 | 106-110 | 5 | Bin 16 Count | C/O |
| 30 | 111-115 | 5 | Bin 17 Count | C/O |
| 31 | 116-120 | 5 | Bin 18 Count | C/O |
| 32 | 121-125 | 5 | Bin 19 Count | C/O |
| 33 | 126-130 | 5 | Bin 20 Count | C/O |
| 34 | 131-135 | 5 | Bin 21 Count | C/O |
| 35 | 136-140 | 5 | Bin 22 Count | C/O |
| 36 | 141-145 | 5 | Bin 23 Count | C/O |
| 37 | 146-150 | 5 | Bin 24 Count | C/O |
| 38 | 151-155 | 5 | Bin 25 Count | C/O |
Note: C=Critical, C/O=Critical/Optional, O=Optional
Fields designated as Critical are required to upload speed data.
Fields designated as Optional are not required for this record format. Code these fields according the instructions for each optional field.
The fields for the Vehicle Speed record are defined as follows:
1. Record Type (Column 1) – Critical
T = Vehicle Speed record
2. FIPS State Code (Columns 2-3) – Critical
See section 7.2, Field #2.
3. Station Identification (Columns 4-9) – Critical
See section 7.2, Field #3.
This field should be right-justified with unused
columns zero-filled.
4. Direction of Travel Code (Column 10) – Critical
See section 7.2, Field #4.
5. Lane of Travel (Column 11) – Critical
See section 7.2, Field #5.
Note: The Station ID, Direction of Travel, and Lane of Travel make up the Station Code. No combined lanes allowed. There should be one Station
Description record per Station Code.
6. Year of Data (Columns 12-15) – Critical
See section 7.2, Field #6.
7. Month of Data (Columns 16 17) – Critical
See section 7.3, Field #8.
8. Day of Data (Columns 18-19) – Critical
See section 7.3, Field #9.
9. Hour of Data (Columns 20-21) – Critical
Code the beginning of the hour in which the count was taken:
00 = after 00:00 to 01:00
01 = after 01:00 to 02:00
...
...
...
22 = after 22:00 to 23:00
23 = after 23:00 to 24:00
10. Speed Data Time Interval (Column 22) – Optional
A 60 minute time interval is assumed if this column is left blank. This field can be used to designate either 5 minute or 15 minute binned speed data.
For 15 minute binned intervals of speed data use the following:
Code 1 for the interval 0.0-14.999
Code 2 for the interval 15.0-29.999
Code 3 for the interval 30.0-44.999
Code 4 for the interval 45.0-59.999
For 5 minute binned intervals of speed data use the following:
Code A for the interval 0.0-4.999
Code B for the interval 5.0-9.999
Code C for the interval 10.0-14.999
Code D for the interval 15.0-19.999
Code E for the interval 20.0-24.999
Code F for the interval 25.0-29.999
Code G for the interval 30.0-34.999
Code H for the interval 35.0-39.999
Code I for the interval 40.0-44.999
Code J for the interval 45.0-49.999
Code K for the interval 50.0-54.999
Code L for the interval 55.0-59.999
11. Definition of First Speed Bin (Column 23) – Optional
If this field is left blank, the first speed bin is assumed to be defined as being all vehicles traveling equal to or slower than 20 mph.
If the State wishes to submit data that provides more detail of vehicles traveling at slower speeds, it may supply data in one or two additional slow speed bins. If the value “1” is coded in Column 21 the first speed bin is defined as “all vehicles traveling at equal to or slower than 15 mph.” If the value “2” is coded in Column 21, the first speed bin submitted will contain “all vehicles traveling at equal to or slower than 10 mph” while the second bin will be defined as “all vehicles traveling faster than 10 mph and at equal to or slower than 15 mph.”
12. Total Number of Speed Bins Reported (Columns 24-25) – Optional
If this field is left blank the record should contain data in 15 speed bins; the first bin is defined as all vehicles traveling 20 mph or slower, and the last bin is defined as all vehicles traveling faster than 85 mph. The length of the record for 15 speed bins is 105 columns wide.
If the State is supplying data in additional speed bins, this value is used to determine the correct record length.
RECORD LENGTH
| Total Number of Speed Bins (Defined in Columns 24-25) |
Record Length (number of columns) |
|---|---|
| 15 | 105 |
| 16 | 110 |
| 17 | 115 |
| 18 | 120 |
| 19 | 125 |
| 20 | 130 |
| 21 | 135 |
| 22 | 140 |
| 23 | 145 |
| 24 | 150 |
| 25 | 155 |
When used in conjunction with Field 11 (Column 23) it is possible to determine the definition of all speed bins being submitted.
13. Total Interval Volume (Columns 26-30) – Optional
This numeric field is the total traffic volume for the interval being reported on this record. The total volume is needed because vehicle speed may not have been detected for all vehicles, in which case the sum of the speed counts would not equal the total volume. If the total volume is not collected, leave this field blank.
The following speed count fields are numeric fields with the traffic volume by vehicle speed for each interval being reported. Traffic volumes in each speed bin for each reporting interval should be entered as zero-filled or blank-filled right justified integers in the appropriate columns.
14. Bin 1 Count (Columns 31-35) – Critical
Bin 1 includes the number of vehicles in the slowest speed range being submitted. Right justify the integer volume number in the data entry field. The default condition for this speed bin is “all vehicles traveling equal to or slower than 20 mph.” If a different definition is used Field 11 (Column 23) should be used to define this speed bin. If there are no vehicles observed in this speed range during the time period being reported, enter “0”, not “ “ (blank), to indicate that there are no vehicles in this speed range, and enter “0” similarly for each speed bin below.
15. Bin 2 Count (Columns 36-40) – Critical
Bin 2 includes the number of vehicles in the second slowest speed range being submitted. Right justify the integer volume number in the data entry field. If there are no vehicles observed in this speed range during the time period being reported, enter “0.”
16. Bin 3 Count (Columns 41-45) – Critical
Bin 3 includes the number of vehicles in the third speed range being submitted. Right justify the integer volume number in the data entry field. If there are no vehicles observed in this speed range during the time period being reported, enter “0.”
17. Bin 4 Count (Columns 46-50) – Critical
Bin 4 includes the number of vehicles in the fourth speed range being submitted. Right justify the integer volume number in the data entry field. If there are no vehicles observed in this speed range during the time period being reported, enter “0.”
18. Bin 5 Count (Columns 51-55) – Critical
Bin 5 includes the number of vehicles in the fifth speed range being submitted. Right justify the integer volume number in the data entry field. If there are no vehicles observed in this speed range during the time period being reported, enter “0.”
19. Bin 6 Count (Columns 56-60) – Critical
Bin 6 includes the number of vehicles in the sixth speed range being submitted. Right justify the integer volume number in the data entry field. If there are no vehicles observed in this speed range during the time period being reported, enter “0.”
20. Bin 7 Count (Columns 61-65) – Critical
Bin 7 includes the number of vehicles in the seventh speed range being submitted. Right justify the integer volume number in the data entry field. If there are no vehicles observed in this speed range during the time period being reported, enter “0.”
21. Bin 8 Count (Columns 66-70) – Critical
Bin 8 includes the number of vehicles in the eighth speed range being submitted. Right justify the integer volume number in the data entry field. If there are no vehicles observed in this speed range during the time period being reported, enter “0
22. Bin 9 Count (Columns 71-75) – Critical
Bin 9 includes the number of vehicles in the ninth speed range being submitted. Right justify the integer volume number in the data entry field. If there are no vehicles observed in this speed range during the time period being reported, enter “0.”
23.Bin 10 Count (Columns 76-80) – Critical
Bin 10 includes the number of vehicles in the tenth speed range being submitted. Right justify the integer volume number in the data entry field. If there are no vehicles observed in this speed range during the time period being reported, enter “0.”
24. Bin 11 Count (Columns 81-85) – Critical
Bin 11 includes the number of vehicles in the eleventh speed range being submitted. Right justify the integer volume number in the data entry field. If there are no vehicles observed in this speed range during the time period being reported, enter “0.”
25. Bin 12 Count (Columns 86-90) – Critical
Bin 12 includes the number of vehicles in the 12th speed range being submitted. Right justify the integer volume number in the data entry field. If there are no vehicles observed in this speed range during the time period being reported, enter “0.”
26. Bin 13 Count (Columns 91-95) – Critical
Bin 13 includes the number of vehicles in the 13th speed range being submitted. Right justify the integer volume number in the data entry field. If there are no vehicles observed in this speed range during the time period being reported, enter “0.”
27. Bin 14 Count (Columns 96-100) – Critical
Bin 14 includes the number of vehicles in the fourteenth speed range being submitted. Right justify the integer volume number in the data entry field. If there are no vehicles observed in this speed range during the time period being reported, enter “
28. Bin 15 Count (Columns 101-105) – Critical
Bin 15 includes the number of vehicles in the fifteenth speed range being submitted. Right justify the integer volume number in the data entry field. If there are no vehicles observed in this speed range during the time period being reported, enter “0.”
29. Bin 16 Count (Columns 106-110) – Critical/Optional
Bin 16 includes the number of vehicles in the sixteenth speed range being submitted. It is used only when a State submits data in additional speed bins beyond the 15 required by FHWA. If this bin is used, Field #12 (Columns 24-25) should contain a value equal to or greater than 16. Right justify the integer volume number in the data entry field. If there are no vehicles observed in this speed range during the time period being reported, enter “0”.
30. Bin 17 Count (Columns 111-115) – Critical/Optional
Bin 17 includes the number of vehicles in the seventeenth speed range being submitted. It is used only when a State submits data in additional speed bins beyond the 15 required by FHWA. If this bin is used, Field #12 (Columns 24-25) should contain a value equal to or greater than 17. When reporting data in this speed bin right justify the integer volume number in the data entry field. If there are no vehicles observed in this speed range during the time period being reported, enter “0.”
31. Bin 18 Count (Columns 116-120) – Critical/Optional
Bin 18 includes the number of vehicles in the eighteenth speed range being submitted. It is used only when a State submits data in additional speed bins beyond the 15 required by FHWA. If this bin is used, Field #12 (Columns 24-25) should contain a value equal to or greater than 18. When reporting data in this speed bin right justify the integer volume number in the data entry field. If there are no vehicles observed in this speed range during the time period being reported, enter “0.”
32. Bin 19 Count (Columns 121-125) – Critical/Optional
Bin 19 includes the number of vehicles in the nineteenth speed range being submitted. It is used only when a State submits data in additional speed bins beyond the 15 required by FHWA. If this bin is used, Field #12 (Columns 24-25) should contain a value equal to or greater than 19. When reporting data in this speed bin right justify the integer volume number in the data entry field. If there are no vehicles observed in this speed range during the time period being reported, enter “0.”
33. Bin 20 Count (Columns 126-130) – Critical/Optional
Bin 20 includes the number of vehicles in the twentieth speed range being submitted. It is used only when a State submits data in additional speed bins beyond the 15 required by FHWA. If this bin is used, Field #12 (Columns 24-25) should contain a value equal to or greater than 20. When reporting data in this speed bin right justify the integer volume number in the data entry field. If there are no vehicles observed in this speed range during the time period being reported, enter “0.”
34. Bin 21 Count (Columns 131-135) – Critical/Optional
Bin 21 includes the number of vehicles in the twenty-first speed range being submitted. It is used only when a State submits data in additional speed bins beyond the 15 required by FHWA. If this bin is used, Field #12 (Columns 24-25) should contain a value equal to or greater than 21. When reporting data in this speed bin right justify the integer volume number in the data entry field. If there are no vehicles observed in this speed range during the time period being reported, enter “0.”
35. Bin 22 Count (Columns 136-140) – Critical/Optional
Bin 22 includes the number of vehicles in the twenty-second speed range being submitted. It is used only when a State submits data in additional speed bins beyond the 15 required by FHWA. If this bin is used, Field #12 (Columns 24-25) should contain a value equal to or greater than 22. When reporting data in this speed bin right justify the integer volume number in the data entry field. If there are no vehicles observed in this speed range during the time period being reported, enter “0.”
36. Bin 23 Count (Columns 141-145) – Critical/Optional
Bin 23 includes the number of vehicles in the twenty-third speed range being submitted. It is used only when a State submits data in additional speed bins beyond the 15 required by FHWA. If this bin is used, Field #12 (Columns 24-25) should contain a value equal to or greater than 23. When reporting data in this speed bin right justify the integer volume number in the data entry field. If there are no vehicles observed in this speed range during the time period being reported, enter “0.”
37. Bin 24 Count (Columns 146-150) – Critical/Optional
Bin 24 includes the number of vehicles in the twenty-fourth speed range being submitted. It is used only when a State submits data in additional speed bins beyond the 15 required by FHWA. If this bin is used, Field #12 (Columns 24-25) should contain a value equal to or greater than 24. When reporting data in this speed bin right justify the integer volume number in the data entry field. If there are no vehicles observed in this speed range during the time period being reported, enter “0.”
38. Bin 25 Count (Columns 151-155) – Critical/Optional
Bin 25 includes the number of vehicles in the twenty-fifth speed range being submitted. It is used only when a State submits data in additional speed bins beyond the 15 required by FHWA. If this bin is used, Field #12 (Columns 24-25) should contain a value equal to or greater than 25. When reporting data in this speed bin right justify the integer volume number in the data entry field. If there are no vehicles observed in this speed range during the time period being reported, enter “0.”
SPEED SITE (15 BIN, 2 LANES WITH LANES OR DIRECTIONS NOT COMBINED AT 5 MINUTE INTERVAL FOR 1 HOUR) SPEED FILE
| Column Number: |
1 | 2-3 | 4-9 | 10 | 11 | 12-15 | 16-17 | 18-19 | 20-21 | 22 | 23 | 24-25 |
| Content Example: |
T | 17 | 018114 | 1 | 1 | 2012 | 06 | 20 | 00 | A | Blank | 15 |
| Content Example: |
T | 17 | 018114 | 1 | 1 | 2012 | 06 | 20 | 00 | B | Blank | 15 |
| T | 17 | 018114 | 1 | 1 | 2012 | 06 | 20 | 00 | C | Blank | 15 | |
| T | 17 | 018114 | 1 | 1 | 2012 | 06 | 20 | 00 | D | Blank | 15 | |
| T | 17 | 018114 | 1 | 1 | 2012 | 06 | 20 | 00 | E | Blank | 15 | |
| T | 17 | 018114 | 1 | 1 | 2012 | 06 | 20 | 00 | F | Blank | 15 | |
| T | 17 | 018114 | 1 | 1 | 2012 | 06 | 20 | 00 | G | Blank | 15 | |
| T | 17 | 018114 | 1 | 1 | 2012 | 06 | 20 | 00 | H | Blank | 15 | |
| T | 17 | 018114 | 1 | 1 | 2012 | 06 | 20 | 00 | I | Blank | 15 | |
| T | 17 | 018114 | 1 | 1 | 2012 | 06 | 20 | 00 | J | Blank | 15 | |
| T | 17 | 018114 | 1 | 1 | 2012 | 06 | 20 | 00 | K | Blank | 15 | |
| T | 17 | 018114 | 1 | 1 | 2012 | 06 | 20 | 00 | L | Blank | 15 | |
| T | 17 | 018114 | 1 | 1 | 2012 | 06 | 20 | 00 | A | Blank | 15 | |
| T | 17 | 018114 | 1 | 1 | 2012 | 06 | 20 | 00 | B | Blank | 15 | |
| T | 17 | 018114 | 5 | 1 | 2012 | 06 | 20 | 00 | C | Blank | 15 | |
| T | 17 | 018114 | 5 | 1 | 2012 | 06 | 20 | 00 | D | Blank | 15 | |
| T | 17 | 018114 | 5 | 1 | 2012 | 06 | 20 | 00 | E | Blank | 15 | |
| T | 17 | 018114 | 5 | 1 | 2012 | 06 | 20 | 00 | F | Blank | 15 | |
| T | 17 | 018114 | 5 | 1 | 2012 | 06 | 20 | 00 | G | Blank | 15 | |
| T | 17 | 018114 | 5 | 1 | 2012 | 06 | 20 | 00 | H | Blank | 15 | |
| T | 17 | 018114 | 5 | 1 | 2012 | 06 | 20 | 00 | I | Blank | 15 | |
| T | 17 | 018114 | 5 | 1 | 2012 | 06 | 20 | 00 | J | Blank | 15 | |
| T | 17 | 018114 | 5 | 1 | 2012 | 06 | 20 | 00 | K | Blank | 15 | |
| T | 17 | 018114 | 5 | 1 | 2012 | 06 | 20 | 00 | L | Blank | 15 |
continued
| Column Number: |
26-30 | 31-35 | 36-40 | 41-45 | 46-50 | 51-55 | 56-60 | 61-65 | 66-70 | 71-75 | 76-80 | 81-85 |
| Content Example: |
00375 | 00000 | 00000 | 00000 | 00000 | 00000 | 00000 | 00007 | 00012 | 00048 | 00165 | 00086 |
| Content Example: |
00305 | 00000 | 00000 | 00000 | 00000 | 00000 | 00004 | 00005 | 00008 | 00025 | 00143 | 00079 |
| Content Example: |
00266 | 00000 | 00000 | 00000 | 00000 | 00000 | 00000 | 00003 | 00003 | 00032 | 00131 | 00058 |
| 00268 | 00000 | 00000 | 00000 | 00000 | 00000 | 00000 | 00002 | 00004 | 00037 | 00128 | 00043 | |
| 00248 | 00000 | 00000 | 00000 | 00000 | 00000 | 00001 | 00001 | 00003 | 00039 | 00119 | 00039 | |
| 00231 | 00000 | 00000 | 00000 | 00000 | 00000 | 00000 | 00002 | 00002 | 00025 | 00108 | 00042 | |
| 00197 | 00000 | 00000 | 00000 | 00000 | 00000 | 00000 | 00000 | 00001 | 00018 | 00099 | 00035 | |
| 00183 | 00000 | 00000 | 00000 | 00000 | 00000 | 00000 | 00000 | 00000 | 00013 | 00098 | 00032 | |
| 00173 | 00000 | 00000 | 00000 | 00000 | 00000 | 00000 | 00000 | 00000 | 00008 | 00095 | 00031 | |
| 00159 | 00000 | 00000 | 00000 | 00000 | 00000 | 00000 | 00000 | 00000 | 00007 | 00092 | 00028 | |
| 00154 | 00000 | 00000 | 00000 | 00000 | 00000 | 00000 | 00000 | 00000 | 00011 | 00088 | 00025 | |
| 00145 | 00000 | 00000 | 00000 | 00000 | 00000 | 00000 | 00000 | 00000 | 00012 | 00084 | 00021 | |
| 00427 | 00000 | 00000 | 00000 | 00000 | 00000 | 00000 | 00008 | 00013 | 00049 | 00015 | 60008 | |
| 00307 | 00000 | 00000 | 00000 | 00000 | 00000 | 00000 | 00006 | 00009 | 00026 | 00014 | 10008 | |
| 00268 | 00000 | 00000 | 00000 | 00000 | 00000 | 00000 | 00002 | 00003 | 00031 | 00012 | 80006 | |
| 00294 | 00000 | 00000 | 00000 | 00000 | 00000 | 00000 | 00000 | 00001 | 00035 | 00013 | 40006 | |
| 00277 | 00000 | 00000 | 00000 | 00000 | 00000 | 00000 | 00000 | 00007 | 00031 | 00012 | 10005 | |
| 00288 | 00000 | 00000 | 00000 | 00000 | 00000 | 00000 | 00000 | 00002 | 00026 | 00011 | 50005 | |
| 00272 | 00000 | 00000 | 00000 | 00000 | 00000 | 00000 | 00000 | 00004 | 00027 | 00012 | 20005 | |
| 00242 | 00000 | 00000 | 00000 | 00000 | 00000 | 00000 | 00000 | 00003 | 00021 | 00011 | 40004 | |
| 00212 | 00000 | 00000 | 00000 | 00000 | 00000 | 00000 | 00000 | 00000 | 00015 | 00010 | 40004 | |
| 00198 | 00000 | 00000 | 00000 | 00000 | 00000 | 00000 | 00000 | 00000 | 00012 | 00009 | 80004 | |
| 00185 | 00000 | 00000 | 00000 | 00000 | 00000 | 00000 | 00000 | 00000 | 00008 | 00008 | 70005 | |
| 00155 | 00000 | 00000 | 00000 | 00000 | 00000 | 00000 | 00000 | 00000 | 00005 | 00007 | 60004 |
continued
| Column Number: |
86-90 | 91-95 | 96-100 | 101-105 | 106-110 | 111-115 | 116-120 | 121-125 | 126-130 | 131-135 | 136-140 |
| Content Example: |
00031 | 00021 | 00005 | 00000 | Blank | Blank | Blank | Blank | Blank | Blank | Blank |
| Content Example: |
00025 | 00013 | 00003 | 00000 | Blank | Blank | Blank | Blank | Blank | Blank | Blank |
| 00026 | 00011 | 00001 | 00001 | Blank | Blank | Blank | Blank | Blank | Blank | Blank | |
| 00039 | 00012 | 00003 | 00000 | Blank | Blank | Blank | Blank | Blank | Blank | Blank | |
| 00028 | 00015 | 00004 | 00000 | Blank | Blank | Blank | Blank | Blank | Blank | Blank | |
| 00032 | 00015 | 00005 | 00000 | Blank | Blank | Blank | Blank | Blank | Blank | Blank | |
| 00028 | 00011 | 00005 | 00000 | Blank | Blank | Blank | Blank | Blank | Blank | Blank | |
| 00027 | 00009 | 00004 | 00000 | Blank | Blank | Blank | Blank | Blank | Blank | Blank | |
| 00028 | 00008 | 00003 | 00000 | Blank | Blank | Blank | Blank | Blank | Blank | Blank | |
| 00025 | 00005 | 00002 | 00000 | Blank | Blank | Blank | Blank | Blank | Blank | Blank | |
| 00026 | 00003 | 00001 | 00000 | Blank | Blank | Blank | Blank | Blank | Blank | Blank | |
| 00024 | 00004 | 00000 | 00000 | Blank | Blank | Blank | Blank | Blank | Blank | Blank | |
| 70003 | 20002 | 20000 | 60000 | Blank | Blank | Blank | Blank | Blank | Blank | Blank | |
| 20002 | 70001 | 10000 | 50000 | Blank | Blank | Blank | Blank | Blank | Blank | Blank | |
| 10002 | 50001 | 30000 | 40001 | Blank | Blank | Blank | Blank | Blank | Blank | Blank | |
| 50003 | 60001 | 50000 | 70001 | Blank | Blank | Blank | Blank | Blank | Blank | Blank | |
| 80003 | 10002 | 10000 | 80000 | Blank | Blank | Blank | Blank | Blank | Blank | Blank | |
| 50003 | 20002 | 20000 | 70001 | Blank | Blank | Blank | Blank | Blank | Blank | Blank | |
| 60003 | 50002 | 30000 | 50000 | Blank | Blank | Blank | Blank | Blank | Blank | Blank | |
| 90003 | 30001 | 80000 | 40000 | Blank | Blank | Blank | Blank | Blank | Blank | Blank | |
| 80002 | 40001 | 90000 | 20000 | Blank | Blank | Blank | Blank | Blank | Blank | Blank | |
| 70002 | 50001 | 30000 | 30000 | Blank | Blank | Blank | Blank | Blank | Blank | Blank | |
| 10002 | 40001 | 20000 | 30000 | Blank | Blank | Blank | Blank | Blank | Blank | Blank | |
| 40002 | 10000 | 90000 | 00000 | Blank | Blank | Blank | Blank | Blank | Blank | Blank |
continued
| Column Number: |
141-145 | 146-150 | 151-155 |
| Content Example: |
Blank | Blank | Blank |
| Content Example: |
Blank | Blank | Blank |
| Blank | Blank | Blank | |
| Blank | Blank | Blank | |
| Blank | Blank | Blank | |
| Blank | Blank | Blank | |
| Blank | Blank | Blank | |
| Blank | Blank | Blank | |
| Blank | Blank | Blank | |
| Blank | Blank | Blank | |
| Blank | Blank | Blank | |
| Blank | Blank | Blank | |
| Blank | Blank | Blank | |
| Blank | Blank | Blank | |
| Blank | Blank | Blank | |
| Blank | Blank | Blank | |
| Blank | Blank | Blank | |
| Blank | Blank | Blank | |
| Blank | Blank | Blank | |
| Blank | Blank | Blank | |
| Blank | Blank | Blank | |
| Blank | Blank | Blank | |
| Blank | Blank | Blank | |
| Blank | Blank | Blank |
SPEED SITE (21 BIN, 4 LANES WITH LANES OR DIRECTIONS NOT COMBINED AT 60 MINUTE INTERVAL FOR 1 HOUR, TOTAL VOLUME NOT RECORDED) SPEED FILE
| Column Number: |
1 | 2-3 | 4-9 | 10 | 11 | 12-15 | 16-17 | 18-19 | 20-21 | 22 | 23 | 24-25 |
| Content Example: |
T | 17 | 018114 | 1 | 1 | 2012 | 06 | 20 | 00 | Blank | 1 | 21 |
| Content Example: |
T | 17 | 018114 | 1 | 1 | 2012 | 06 | 20 | 00 | Blank | 1 | 21 |
| Content Example: |
T | 17 | 018114 | 1 | 1 | 2012 | 06 | 20 | 00 | Blank | 1 | 21 |
| Content Example: |
T | 17 | 018114 | 1 | 1 | 2012 | 06 | 20 | 00 | Blank | 1 | 21 |
continued
| Column Number: |
26-30 | 31-35 | 36-40 | 41-45 | 46-50 | 51-55 | 56-60 | 61-65 | 66-70 | 71-75 | 76-80 | 81-85 |
| Content Example: |
Blank | 00000 | 00000 | 00000 | 00000 | 00000 | 00000 | 00000 | 00000 | 00005 | 00034 | 00054 |
| Content Example: |
Blank | 00000 | 00000 | 00000 | 00000 | 00000 | 00000 | 00000 | 00000 | 00007 | 00030 | 00046 |
| Content Example: |
Blank | 00000 | 00000 | 00000 | 00000 | 00000 | 00000 | 00000 | 00000 | 00010 | 00028 | 00056 |
| Content Example: |
Blank | 00000 | 00000 | 00000 | 00000 | 00000 | 00000 | 00000 | 00000 | 00008 | 00026 | 00036 |
continued
| Column Number: |
86-90 | 91-95 | 96-100 | 101-105 | 106-110 | 111-115 | 116-120 | 121-125 | 126-130 | 131-135 | 136-140 |
| Content Example: |
00021 | 00015 | 00002 | 00001 | 00000 | 00000 | 00000 | 00000 | 00000 | 00000 | Blank |
| Content Example: |
00024 | 00013 | 00003 | 00002 | 00000 | 00000 | 00000 | 00000 | 00000 | 00000 | Blank |
| Content Example: |
00031 | 00021 | 00005 | 00004 | 00003 | 00000 | 00000 | 00000 | 00000 | 00000 | Blank |
| Content Example: |
00029 | 00018 | 00003 | 00003 | 00002 | 00001 | 00000 | 00000 | 00000 | 00000 | Blank |
continued
| Column Number: |
141-145 | 146-150 | 151-155 |
| Content Example: |
Blank | Blank | Blank |
| Content Example: |
Blank | Blank | Blank |
| Content Example: |
Blank | Blank | Blank |
| Content Example: |
Blank | Blank | Blank |
SPEED SITE (25 BIN, 2 LANES WITH LANES OR DIRECTIONS NOT COMBINED AT 60 MINUTE INTERVAL FOR 1 HOUR) SPEED FILE
| Column Number: |
1 | 2-3 | 4-9 | 10 | 11 | 12-15 | 16-17 | 18-19 | 20-21 | 22 | 23 | 24-25 |
| Content Example: |
T | 17 | 018114 | 1 | 1 | 2012 | 06 | 20 | 00 | Blank | 1 | 25 |
| Content Example: |
T | 17 | 018114 | 1 | 1 | 2012 | 06 | 20 | 00 | Blank | 1 | 25 |
continued
| Column Number: |
26-30 | 31-35 | 36-40 | 41-45 | 46-50 | 51-55 | 56-60 | 61-65 | 66-70 | 71-75 | 76-80 | 81-85 |
| Content Example: |
000683 | 00000 | 00000 | 00000 | 00000 | 00000 | 00000 | 00000 | 00000 | 00000 | 00005 | 00014 |
| Content Example: |
000681 | 00000 | 00000 | 00000 | 00000 | 00000 | 00000 | 00000 | 00000 | 00000 | 00004 | 00012 |
continued
| Column Number: |
86-90 | 91-95 | 96-100 | 101-105 | 106-110 | 111-115 | 116-120 | 121-125 | 126-130 | 131-135 | 136-140 |
| Content Example: |
00026 | 00056 | 00086 | 00109 | 00121 | 00095 | 00082 | 00042 | 00021 | 00015 | 00011 |
| Content Example: |
00028 | 00064 | 00085 | 00098 | 00127 | 00094 | 00081 | 00041 | 00018 | 00013 | 00013 |
continued
| Column Number: |
141-145 | 146-150 | 151-155 |
| Content Example: |
00000 | 00000 | 00000 |
| Content Example: |
00003 | 00000 | 00000 |
The Vehicle Classification file is a variable length record. It contains one record for each time period (e.g. by 5 min., 15 min., hour of the day) which data is being submitted. That record includes the traffic volume by vehicle class data for that hour. The length of the record (number of columns in each record) is determined by the value in Field 15 (columns 25-26) of the Station Description Record. This means that if two different kinds of data collection equipment are used at a site and those different pieces of equipment collect classification data in different formats (e.g., one uses length classes and the other uses the 13-FHWA categories), then an updated State Description Record should be submitted prior to submitting data using the second classification system or the records being submitted will not be read correctly. All lanes in one direction should have the same data being collected. FHWA uses the latest version of the State Description Record that is submitted. If this record type already exists in TMAS, and no change in the equipment functionality (e.g., the type of vehicle class data being collected) has occurred since that earlier record was submitted, it is not necessary to submit an additional Station Description Record for the data to be processed in TMAS.

A single file can contain data from multiple stations and/or locations.
Table 7-15 summarizes the Vehicle Classification record format.
| Field | Columns | Width | Description | Type |
|---|---|---|---|---|
| 1 | 1 | 1 | Record Type | C |
| 2 | 2-3 | 2 | FIPS State Code | C |
| 3 | 4-9 | 6 | Station ID | C |
| 4 | 10 | 1 | Direction of Travel Code | C |
| 5 | 11 | 1 | Lane of Travel | C |
| 6 | 12-15 | 4 | Year of Data | C |
| 7 | 16-17 | 2 | Month of Data | C |
| 8 | 18-19 | 2 | Day of Data | C |
| 9 | 20-21 | 2 | Hour of Data | C |
| 10 | 22 | 1 | Classification Data Time Interval | O |
| 11 | 23-27 | 5 | Total Interval Volume | C |
| 12 | 28 | 1 | Restrictions | C |
| 13 | 29-33 | 5 | Class 1 Count | C |
| 14 | 34-38 | 5 | Class 2 Count | C |
| 15 | 39-43 | 5 | Class 3 Count | C/O |
| 16 | 44-48 | 5 | Class 4 Count | C/O |
| 17 | 49-53 | 5 | Class 5 Count | C/O |
| 18 | 54-58 | 5 | Class 6 Count | C/O |
| 19 | 59-63 | 5 | Class 7 Count | C/O |
| 20 | 64-68 | 5 | Class 8 Count | C/O |
| 21 | 69-73 | 5 | Class 9 Count | C/O |
| 22 | 74-78 | 5 | Class 10 Count | C/O |
| 23 | 79-83 | 5 | Class 11 Count | C/O |
| 24 | 84-88 | 5 | Class 12 Count | C/O |
| 25 | 89-93 | 5 | Class 13 Count | C/O |
Note: C=Critical, C/O=Critical/Optional, O=Optional
Fields designated as Critical are required for entry into the TMAS software used for submitting data to FHWA.
Fields designated as Optional are not required for this record format, code according to the instructions for each Optional field.
The fields for the Vehicle Classification record are:
1. Record Type (Column 1) – Critical
C = Vehicle classification record (Code the letter “C” in the first column)
= Vehicle classification record (Code the letter “C” in the first column)
2. FIPS State Code (Columns 2-3) – Critical
See section 7.2, Field #2.
3. Station Identification (Columns 4-9) – Critical
See section 7.2, Field #3.
This field should be right-justified with unused columns zero-filled
4. Direction of Travel Code (Column 10) – Critical
See section 7.2, Field #4.
5. Lane of Travel (Column 11) – Critical
See section 7.2, Field #5.
Note: The Station ID, Direction of Travel, and Lane of Travel make up the Station Code. There should be one Station Description record per Station Code.
6. Year of Data (Columns 12-15) – Critical
See section 7.2, Field #6.
7. Month of Data (Columns 16-17) – Critical
See section 7.3, Field #8.
8. Day of Data (Columns 18-19) – Critical
See section 7.3, Field #9.
9. Hour of Data (Columns 20-21) – Critical
Code the beginning of the hour in which the count was taken:
00 = after 00:00 to 01:00
01 = after 01:00 to 02:00
...
...
…
22 = after 22:00 to 23:00
23 = after 23:00 to 24:00
10. Classification Data Time Interval – (Column 22) – Optional
A 60 minute time interval is assumed if this column is left blank. This field can be used to designate either 5 minute or 15 minute binned classification data.
For 15 minute binned intervals of classification data use the following:
Code 1 for the interval 0.0 – 14.999
Code 2 for the interval 15.0 – 29.999
Code 3 for the interval 30.0 – 44.999
Code 4 for the interval 45.0 – 59.999
For 5 minute binned intervals of classification data use the following:
Code A for the interval 0.0 – 4.999
Code B for the interval 5.0 – 9.999
Code C for the interval 10.0 – 14.999
Code D for the interval 15.0 – 19.999
Code E for the interval 20.0 – 24.999
Code F for the interval 25.0 – 29.999
Code G for the interval 30.0 – 34.999
Code H for the interval 35.0 – 39.999
Code I for the interval 40.0 – 44.999
Code J for the interval 45.0 – 49.999
Code K for the interval 50.0 – 54.999
Code L for the interval 55.0 – 59.999
11. Total Interval Volume (Columns 23-27) – Critical
This numeric field is the total traffic volume for the hour. The total volume is needed because the data collection process might not be able to classify some vehicles, in which case the sum of the vehicle class counts will not equal the total hourly volume.
Fields 12 to 24:
The following class count fields are numeric fields with the traffic volume by vehicle class for each hour of data. Field #15 in the Station Description Record, “Vehicle Classification Groupings,” determines the number of classes expected from this station. This value also determines how many columns are expected in the remainder of each record submitted in a given file. Truncate the vehicle classification record after the last classification field has been used. (That is, if only five vehicle classes are being reported, the record should only be 52 columns wide.)
The default classification system is the FHWA 13 class system (see Appendix C). Where a classification (grouping) system other than FHWA’s 13-category system is used, the total number of columns for which data is entered will change from that described below. When no vehicles of a class being monitored are counted during a given hour, zero fill and right-justify the data in the columns associated with that class of vehicles.
Before submittal to FHWA, these counts should be checked for reasonableness and quality controlled. When 13 vehicle types are reported, the Vehicle Classification record would not be larger than 92 columns, with Classes 1-13 (fields 12-24) all considered to be Critical. A relationship exists between Table 7-6 and the Vehicle Classes used. These need to be synchronized for proper processing in the TMAS software. TMAS allows users to set a limit for each class count as part of its automated quality assurance checks.
12. Restrictions (Column 28) – Critical
0 = no restrictions
1 = construction or other activity affected traffic flow, traffic pattern not impacted
2 = traffic counting device problem (e.g., malfunction or overflow)
3 = weather affected traffic flow, traffic pattern not impacted
4 = construction or other activity affected traffic flow, traffic pattern
5 = weather affected traffic flow, traffic pattern impacted
13. Class 1 Count (Columns 29-33 ) – Critical
Class 1 is for Motorcycles when using the 13 FHWA classification groups. If the FHWA 13-category system is not being used, this field will contain the traffic volume for the first class of vehicles being reported.
14.Class 2 Count (Columns 34-38) – Critical
Class 2 is for Passenger Cars when using the 13 FHWA classification groups. If the FHWA 13-category system is not being used, this field will contain the traffic volume for the second class of vehicles being reported.
15. Class 3 Count (Columns 39-43) – Critical/Optional
Class 3 is for Light Duty (2-axle, four-tire) Pick-up Trucks when using the 13 FHWA classification groups. If the FHWA 13-category system is not being used, this field will contain the traffic volume for the third class of vehicles being reported.
16.Class 4 Count (Columns 44-48) – Critical/Optional
Class 4 is for Buses when using the 13 FHWA classification groups. If the FHWA 13-category system is not being used, this field will contain the traffic volume for the fourth class of vehicles being reported
17. Class 5 Count (Columns 49-53) – Critical/Optional
Class 5 is for Two-Axle, Six-Tire, Single-Unit Trucks when using the 13 FHWA classification groups. If the FHWA 13-category system is not being used, this field will contain the traffic volume for the fifth class of vehicles being reported.
18. Class 6 Count (Columns 54-58) – Critical/Optional
Class 6 is for Three-Axle, Single-Unit Trucks when using the 13 FHWA classification groups. If the FHWA 13-category system is not being used, this field will contain the traffic volume for the sixth class of vehicles being reported.
19.Class 7 Count (Columns 59-63) – Critical/Optional
Class 7 is for Four-or-More Axle, Single-Unit Trucks when using the 13 FHWA classification groups. If the FHWA 13-category system is not being used, this field will contain the traffic volume for the seventh class of vehicles being reported.
20. Class 8 Count (Columns 64-68) – Critical/Optional
Class 8 is for Four-or-Less Axle, Single-Trailer Trucks when using the 13 FHWA classification groups. If the FHWA 13-category system is not being used, this field will contain the traffic volume for the eighth class of vehicles being reported.
21. Class 9 Count (Columns 69-73) – Critical/Optional
Class 9 is for Five-Axle, Single-Trailer Trucks when using the 13 FHWA classification groups. If the FHWA 13-category system is not being used, this field will contain the traffic volume for the ninth class of vehicles being reported.
22.Class 10 Count (Columns 74-78) – Critical/Optional
Class 10 is for Six-or-More Axle, Single-Trailer Trucks when using the 13 FHWA classification groups. If the FHWA 13-category system is not being used, this field will contain the traffic volume for the tenth class of vehicles being reported.
23. Class 11 Count (Columns 79-83) – Critical/Optional
Class 11 is for Five-or-Less Axle, Multi-Trailer Trucks when using the 13 FHWA classification groups. If the FHWA 13-category system is not being used, this field will contain the traffic volume for the eleventh class of vehicles being reported.
24. Class 12 Count (Columns 84-88) – Critical/Optional
Class 12 is for Six-Axle, Multi-Trailer Trucks when using the 13 FHWA classification groups. If the FHWA 13-category system is not being used, this field will contain the traffic volume for the 12th class of vehicles being reported.
25. Class 13 Count (Columns 89-93) – Critical/Optional
Class 13 is for Seven-or-More Axle, Multi-Trailer Trucks when using the 13 FHWA classification groups. If the FHWA 13-category system is not being used, this field will contain the traffic volume for the 13th class of vehicles being reported.
The vehicle classification record should be ended here if 13 classes are being reported. If volumes for additional classes of vehicles are being reported, add five additional columns for each additional vehicle class being reported. (These additional vehicle classes can include the vehicle categories of “Unclassified”, “Unclassifiable” vehicles that are reported by some types of equipment, or some state specific type of vehicle.)
LENGTH CLASSIFICATION (3 LENGTH CLASS BINS, 4 LANES WITH LANES AND DIRECTIONS NOT COMBINED AT 60 MINUTE INTERVAL FOR 2 HOURS) SITE CLASSIFICATION FILE
| Column Number: |
1 | 2-3 | 4-9 | 10 | 11 | 12-15 | 16-17 | 18-19 | 20-21 | 22 | 23-27 | 28 | 29-33 |
| Content Example: |
C | 17 | 01811B | 1 | 1 | 2012 | 04 | 25 | 00 | Blank | 00099 | 0 | 00051 |
| C | 17 | 01811B | 1 | 1 | 2012 | 04 | 25 | 00 | Blank | 00099 | 0 | 00005 | |
| C | 17 | 01811B | 1 | 1 | 2012 | 04 | 25 | 00 | Blank | 00099 | 0 | 00002 | |
| C | 17 | 01811B | 1 | 1 | 2012 | 04 | 25 | 00 | Blank | 00099 | 0 | 00023 | |
| C | 17 | 01811B | 1 | 1 | 2012 | 04 | 25 | 00 | Blank | 00099 | 0 | 00042 | |
| C | 17 | 01811B | 1 | 1 | 2012 | 04 | 25 | 00 | Blank | 00099 | 0 | 00005 | |
| C | 17 | 01811B | 1 | 1 | 2012 | 04 | 25 | 00 | Blank | 00099 | 0 | 00002 | |
| C | 17 | 01811B | 1 | 1 | 2012 | 04 | 25 | 00 | Blank | 00099 | 0 | 00021 |
continued
| Column Number: |
34-38 | 39-43 | 44-48 | 49-53 | 54-58 | 59-63 | 64-68 | 69-73 | 74-78 | 79-83 | 84-88 | 89-93 |
| Content Example: |
00048 | 00010 | Blank | Blank | Blank | Blank | Blank | Blank | Blank | Blank | Blank | Blank |
| 00014 | 00001 | Blank | Blank | Blank | Blank | Blank | Blank | Blank | Blank | Blank | Blank | |
| 00008 | 00001 | Blank | Blank | Blank | Blank | Blank | Blank | Blank | Blank | Blank | Blank | |
| 00037 | 00006 | Blank | Blank | Blank | Blank | Blank | Blank | Blank | Blank | Blank | Blank | |
| 00021 | 00009 | Blank | Blank | Blank | Blank | Blank | Blank | Blank | Blank | Blank | Blank | |
| 00011 | 00001 | Blank | Blank | Blank | Blank | Blank | Blank | Blank | Blank | Blank | Blank | |
| 00007 | 00002 | Blank | Blank | Blank | Blank | Blank | Blank | Blank | Blank | Blank | Blank | |
| 00029 | 00007 | Blank | Blank | Blank | Blank | Blank | Blank | Blank | Blank | Blank | Blank |
AXLE CLASSIFICATION (13 AXLE CLASS BINS, 2 LANES WITH LANES OR DIRECTIONS NOT COMBINED AT 15 MINUTE INTERVAL FOR 1 HOUR) SITE CLASSIFICATION FILE
| Column Number: |
1 | 2-3 | 4-9 | 10 | 11 | 12-15 | 16-17 | 18-19 | 20-21 | 22 | 23-27 | 28 | 29-33 |
| Content Example: |
C | 17 | 018140 | 3 | 1 | 2012 | 12 | 01 | 00 | 1 | 00054 | 0 | 00000 |
| C | 17 | 018140 | 7 | 1 | 2012 | 12 | 01 | 00 | 1 | 00055 | 0 | 00000 | |
| C | 17 | 018140 | 3 | 1 | 2012 | 12 | 01 | 00 | 2 | 00051 | 0 | 00001 | |
| C | 17 | 018140 | 7 | 1 | 2012 | 12 | 01 | 00 | 2 | 00058 | 0 | 00000 | |
| C | 17 | 018140 | 3 | 1 | 2012 | 12 | 01 | 00 | 3 | 00060 | 0 | 00000 | |
| C | 17 | 018140 | 7 | 1 | 2012 | 12 | 01 | 00 | 3 | 00067 | 0 | 00000 | |
| C | 17 | 018140 | 3 | 1 | 2012 | 12 | 01 | 00 | 4 | 00064 | 0 | 00000 | |
| C | 17 | 018140 | 7 | 1 | 2012 | 12 | 01 | 00 | 4 | 00063 | 0 | 00000 |
continued
| Column Number: |
34-38 | 39-43 | 44-48 | 49-53 | 54-58 | 59-63 | 64-68 | 69-73 | 74-78 | 79-83 | 84-88 | 89-93 |
| Content Example: |
00037 | 00006 | 00000 | 00001 | 00000 | 00000 | 00002 | 00007 | 00000 | 00000 | 00000 | 00001 |
| 00038 | 00009 | 00000 | 00000 | 00000 | 00000 | 00003 | 00005 | 00000 | 00000 | 00000 | 00000 | |
| 00039 | 00008 | 00000 | 00001 | 00001 | 00000 | 00001 | 00008 | 00000 | 00000 | 00000 | 00001 | |
| 00037 | 00010 | 00000 | 00000 | 00000 | 00000 | 00002 | 00009 | 00000 | 00000 | 00000 | 00000 | |
| 00037 | 00006 | 00000 | 00000 | 00001 | 00000 | 00004 | 00012 | 00001 | 00000 | 00000 | 00000 | |
| 00036 | 00005 | 00000 | 00001 | 00000 | 00000 | 00000 | 00015 | 00002 | 00000 | 00000 | 00000 | |
| 00034 | 00009 | 00001 | 00001 | 00000 | 00000 | 00002 | 00016 | 00000 | 00001 | 00000 | 00000 | |
| 00038 | 00008 | 00000 | 00000 | 00000 | 00000 | 00003 | 00013 | 00000 | 00000 | 00000 | 00001 |
The Weight Data Format is the mechanism currently used to submit weight data to FHWA. FHWA prefers that States submit weight data using the Per Vehicle Formats (PVF) described in Section 7.7. In particular, weight data should be submitted using the “W” or “Z” variants of the PVF record format (Sections 7.7.4 and 7.7.5, respectively).
If States still wish to use the current Weight Data Format, a description of that file format is as follows. Each file submitted in this format contains one record for each vehicle. Each record describes that vehicle’s axle weights and axle spacings.
As a reminder, all weight data is to use English units.

Table 7-17 summarizes the Weight record format.
| Field | Columns | Width | Description | Type |
|---|---|---|---|---|
| 1 | 1 | 1 | Record Type | C |
| 2 | 2-3 | 2 | FIPS State Code | C |
| 3 | 4-9 | 6 | Station ID | C |
| 4 | 10 | 1 | Direction of Travel Code | C |
| 5 | 11 | 1 | Lane of Travel | C |
| 6 | 12-15 | 4 | Year of Data | C |
| 7 | 16-17 | 2 | Month of Data | C |
| 8 | 18-19 | 2 | Day of Data | C |
| 9 | 20-21 | 2 | Hour of Data | C |
| 10 | 22-23 | 2 | Vehicle Class | C |
| 11 | 24-26 | 3 | Open | O |
| 12 | 27-32 | 6 | Total Weight of Vehicle | C |
| 13 | 33-34 | 2 | Number of Axles | C |
| 14 | 35-39 | 5 | Axle Weight 1 | C |
| 15 | 40-43 | 4 | Axles 1-2 Spacing | C |
| 16 | 44-48 | 5 | Axle Weight 2 | C |
| 17 | 49-52 | 4 | Axles 2-3 Spacing | C/O |
| 18 | 53-57 | 5 | Axle Weight 3 | C/O |
| 19 | 58-61 | 4 | Axles 3-4 Spacing | C/O |
| 20 | 62-66 | 5 | Axle Weight 4 | C/O |
| 21 | 67-70 | 4 | Axles 4-5 Spacing | C/O |
| 22 | 71-75 | 5 | Axle Weight 5 | C/O |
| 23 | 76-79 | 4 | Axles 5-6 Spacing | C/O |
| 24 | 80-84 | 5 | Axle Weight 6 | C/O |
| 25 | 85-88 | 4 | Axles 6-7 Spacing | C/O |
| 26 | 89-93 | 5 | Axle Weight 7 | C/O |
| 27 | 94-97 | 4 | Axles 7-8 Spacing | C/O |
| 28 | 98-102 | 5 | Axle Weight 8 | C/O |
| 29 | 103-106 | 4 | Axles 8-9 Spacing | C/O |
| 30 | 107-111 | 5 | Axle Weight 9 | C/O |
| 31 | 112-115 | 4 | Axles 9-10 Spacing | C/O |
| 32 | 116-120 | 5 | Axle Weight 10 | C/O |
| 33 | 121-124 | 4 | Axles 10-11 Spacing | C/O |
| 34 | 125-129 | 5 | Axle Weight 11 | C/O |
| 35 | 130-133 | 4 | Axles 11-12 Spacing | C/O |
| 36 | 134-138 | 5 | Axle Weight 12 | C/O |
| 37 | 139-142 | 4 | Axles 12-13 Spacing | C/O |
| 38 | 143-147 | 5 | Axle Weight 13 | C/O |
Note 1: C=Critical, C/O=Critical/Optional, O=Optional
Fields designated as Critical are required for entry into the TMAS software.
Fields designated as Optional are not required for this record format. Code these fields according the instructions for each optional field.
Fields designated as C/O could be either critical or optional based on other field values in the weight record.
Note 2: The number of axles determines the number of axle weight and spacing fields.
Note 3: For those vehicles with fourteen or more axles, add the appropriate number of additional fields.
Note 4: Additional axle spacing and axle weight fields may be added in the same manner if needed up to a maximum of 25 axles per record.
The fields for the weight record are:
1. Record Type (Column 1) – Critical
W = Truck weight record (Code the letter “W” in the first column.)
2. FIPS State Code (Columns 2-3) –Critical
See section 7.2, Field #2
3. Station Identification (Columns 4-9) –Critical
See section 7.2, Field #3.
This field should be right-justified with unused columns zero-filled.
4. Direction of Travel Code (Column 10) –Critical
See section 7.2, Field #4.
5. Lane of Travel (Column 11) –Critical
See section 7.2, Field #5.
Note: The Station ID, Direction of Travel, and Lane of Travel make up the Station Code. There should be one Station Description record per Station Code.
6. Year of Data (Columns 12-15) –Critical
See section 7.2, Field #6.
7. Month of Data (Columns 16-17) –Critical
See section 7.3, Field #8.
8. Day of Data (Columns 18-19) –Critical
See section 7.3, Field #9.
9. Hour of Data (Columns 20-21) –Critical
Code the beginning of the hour in which the count was taken:
00 = after 0:00 to 01:00
01 = after 01:00 to 02:00
...
...
...
22 = after 22:00 to 23:00
23 = after 23:00 to 24:00
10. Vehicle Class (Columns 22-23) –Critical
Enter the class of the vehicle from FHWA Vehicle Classes 1 to 13. (Note: vehicles from classes 1 - 3 are ordinarily omitted from weight data submittals.)
A dummy vehicle class of ‘m’ indicates that weight data for this hour are missing. A dummy vehicle class of ‘d’ indicates that weight data for this hour are not missing, and thus if there are no weight records for the hour, then there were no trucks during that hour. Without these indications, no weight records for an hour might be interpreted to mean that the WIM system was not working.
11. Open (Columns 24-26) –Optional
This field is for special studies or State use such as for vehicle speed (miles per hour) or pavement temperature (degrees Fahrenheit).
12. Total Weight of Vehicle (Columns 27-32) - Critical
Enter the gross vehicle weight to the nearest pound. For example, 110,200 lbs. would be reported in the field as 110200. There are no decimals or commas used in the field. This should equal the sum of all the axle weights except for rounding.
13. Number of Axles (Columns 33-34) –Critical
Enter the total number of axles in use by the vehicle (including any trailers).
The number of axles determines how many axle weight and spacing fields will be expected on each record. As a reminder, the axle weight and spacing fields should be reported in English units. The rest of the record alternates between axle weights and axle spacings, starting from the front of the vehicle. Axle weights are to the nearest pound. Axle spacings are to the nearest tenth of a foot. All values should be right-justified with leading blanks as needed.
Quality control (QC) checks should be performed on the axle weights and spacings.
14. Axle Weight 1 (Columns 35-39) -Critical
15. Axles 1-2 Spacing (Columns 40-43) - Critical
16. Axle Weight 2 (Columns 44-48) -Critical
17. Axles 2-3 Spacing (Columns 49-52) – Critical/Optional
18. Axle Weight 3 (Columns 53-57) – Critical/Optional
19. Axles 3-4 Spacing (Columns 58-61) - Critical/Optional
20. Axle Weight 4 (Columns 62-66) - Critical/Optional
21. Axles 4-5 Spacing (Columns 67-70) - Critical/Optional
22. Axle Weight 5 (Columns 71-75) - Critical/Optional
23. Axles 5-6 Spacing (Columns 76-79) - Critical/Optional
24. Axle Weight 6 (Columns 80-84) - Critical/Optional
25. Axles 6-7 Spacing (Columns 85-88) - Critical/Optional
26. Axle Weight 7 (Columns 89-93) - Critical/Optional
27. Axles 7-8 Spacing (Columns 94-97) - Critical/Optional
28. Axle Weight 8 (Columns 98-102) - Critical/Optional
29. Axles 8-9 Spacing (Columns 103-106) - Critical/Optional
30. Axle Weight 9 (Columns 107-111) - Critical/Optional
31. Axles 9-10 Spacing (Columns 112-115) - Critical/Optional
32. Axle Weight 10 (Columns 116-120) - Critical/Optional
33. Axles 10-11 Spacing (Columns 121-124) - Critical/Optional
34. Axle Weight 11 (Columns 125-129) - Critical/Optional
35. Axles 11-12 Spacing (Columns 130-133) - Critical/Optional
36. Axle Weight 12 (Columns 134-138) - Critical/Optional
37. Axles 12-13 Spacing (Columns 139-142) - Critical/Optional
38. Axle Weight 13 (Columns 143-147) - Critical/Optional
WEIGHT SITE WEIGHT FILE
| Column Number: |
1 | 2-3 | 4-9 | 10 | 11 | 12-15 | 16-17 | 18-19 | 20-21 | 22-23 |
| Content Example: |
W | 17 | 018115 | 3 | 1 | 2012 | 11 | 07 | 16 | 09 |
| Content Example: |
W | 17 | 018115 | 3 | 1 | 2012 | 11 | 07 | 16 | 04 |
| Content Example: |
W | 17 | 018115 | 3 | 1 | 2012 | 11 | 07 | 16 | 06 |
continued
| Column Number: |
24-26 | 27-32 | 33-34 | 35-39 | 40-43 | 44-48 | 49-52 | 53-57 | 58-61 | 62-66 |
| Content Example: |
Blank | 057886 | 05 | 11210 | 0151 | 12300 | 0045 | 13730 | 0214 | 09815 |
| Content Example: |
Blank | 018351 | 02 | 08522 | 0252 | 09829 | Blank | Blank | Blank | Blank |
| Content Example: |
Blank | 047289 | 03 | 09818 | 0131 | 91025 | 0046 | 18346 | Blank | Blank |
continued
| Column Number: |
67-70 | 71-75 | 76-79 | 80-84 | 85-88 | 89-93 | 94-97 | 98-102 | 103-106 | 107-111 |
| Content Example: |
0048 | Blank | Blank | Blank | Blank | Blank | Blank | Blank | Blank | Blank |
| Content Example: |
Blank | Blank | Blank | Blank | Blank | Blank | Blank | Blank | Blank | Blank |
| Content Example: |
Blank | Blank | Blank | Blank | Blank | Blank | Blank | Blank | Blank | Blank |
continued
| Column Number: |
112-115 | 116-120 | 121-124 | 125-129 | 130-133 | 134-138 | 139-142 | 143-147 |
| Content Example: |
Blank | Blank | Blank | Blank | Blank | Blank | Blank | Blank |
| Content Example: |
Blank | Blank | Blank | Blank | Blank | Blank | Blank | Blank |
| Content Example: |
Blank | Blank | Blank | Blank | Blank | Blank | Blank | Blank |
In the Weight Record examples listed above, the Vehicle Class field (columns 22-23) indicates either class 09 (semi-trailer), class 04 (bus), or class 06 (dump-truck; 3-axle single unit) as illustrated below.
09 – semi-truck
04-bus
06-dump-truck
| Class 9 5-Axle tractor semitrailer |  |
 |
|
| Class 4 Buses |  |
 |
|
 |
|
| Class 6 Three axle, single unit |  |
 |
|
 |
Source: Federal Highway Administration.
As an optional way to submit traffic monitoring data to FHWA, State highway agencies may submit volume, speed, vehicle classification, and vehicle weight data as individual vehicle records rather than using the more traditional formats described earlier in this chapter. The FHWA’s Travel Monitoring Analysis System (TMAS) will be configured to accept individual vehicle records in the formats described below.
Individual vehicle records require more disk space than aggregated records, but they also allow much more detailed analysis of traffic patterns. States are encouraged to submit data in these formats whenever possible. While these types of records are not necessary for all data collection efforts, having a sample of such records available for use permits the investigation of a number of key traffic flow and vehicle characteristics (e.g., vehicle gap analysis, speed by class, and changes in axle spacing
distributions) that are not possible when only aggregate traffic records are stored.
The submission of one PVF data file (1 record) will:
The following table provides a quick reference for the units of measurement to be reported for weight, length, speed, and temperature.
| Measure | Unit | Resolution Reported |
|---|---|---|
| Weight | Pounds | Pound |
| Vehicle Length | Feet | Tenths of feet |
| Speed | Mph | Tenths of mph |
| Temperature | Degrees Fahrenheit | Degrees |
| Time | Seconds | Hundredth of second |
| Inter-Axle Spacing | Feet | Tenths of feet |
Individual vehicle records can be collected by a variety of different traffic monitoring devices and technologies. However, the type of data collected for each passing vehicle differs when these alternative technologies are used. Consequently, FHWA has developed five different variations of the Per Vehicle Format. Each of these variations corresponds to a specific type of data collection device. All of the formats use a fixed column record structure, and the first 28 columns of data are the same for all five record formats. The 28th column contains a variable that describes the type of data contained in that record. After the first 28 columns, the remainder of each vehicle record differs based on the type and amount of data collected by that device for that vehicle.
The five different versions of the Per Vehicle Format are as follows:
1.Traffic volume only format;
2.Speed, length classification data formats;
3.Axle classification data format (i.e., axle spacing and classification data);
4.Weight data format for reporting axle weights; and
5.Vehicle classification and weight data format for reporting weight by wheel (path) load.
Each of these record formats is described in detail below. In all cases, each format uses one record for each vehicle observation. All units are given in English units (pounds for weight, feet for distance, miles per hour for speed, and degrees Fahrenheit for temperature). All unused entries are to be blank filled.
The first 28 columns contain the same information for all individual vehicle records. These 28 columns are all that is used by the Traffic Volume Only Format.

The following definitions describe the data to be included in the first 28 columns of all per vehicle records submitted to FHWA, regardless of which one of the five record types is being submitted.
| Field | Columns | Width | Description | Type |
|---|---|---|---|---|
| 1 | 1 | 1 | Record Type | C |
| 2 | 2-3 | 2 | FIPS State Code | C |
| 3 | 4-9 | 6 | Station ID | C |
| 4 | 10 | 1 | Direction of Travel Code | C |
| 5 | 11 | 1 | Lane of Travel | C |
| 6 | 12-15 | 4 | Year of Data | C |
| 7 | 16-17 | 2 | Month of Data | C |
| 8 | 18-19 | 2 | Day of Data | C |
| 9 | 20-27 | 8 | Time of Data | C |
| 10 | 28 | 1 | V | C |
| 11 | 29-32 | 4 | Vehicle Signature/Other Use | O |
Note: C=Critical, C/O=Critical/Optional, O=Optional
Fields designated as Critical are required to upload data through the TMAS system.
Fields designated as Optional are not required for this record format. Code these fields according to the instructions for each optional field.
Fields designated as Critical/Optional are based on other fields provided in the station record.
1. Record Type (Column 1) – Critical
I = Individual Vehicle Record
2. FIPS State Code (Columns 2-3) –Critical
See section 7.2, Field #2.
3.Station Identification (Columns 4-9) –Critical
See section 7.2, Field #3.
This field should be right-justified with unused columns zero-filled.
4. Direction of Travel Code (Column 10) –Critical
See section 7.2, Field #4.
5. Lane of Travel (Column 11) –Critical
See section 7.2, Field #5.
Note: The Station ID, Direction of Travel, and Lane of Travel make up the Station Code. There should be one Station Description record per Station Code.
6. Year of Data (Columns 12-15) –Critical
See section 7.2, Field #6
7. Month of Data (Columns 16-17)
Critical –See section 7.3, Field #8.
8. Day of Data (Columns 18-19) –Critical
See Chapter 7.3, Field #9.
9. Time of Data (Columns 20-27) – hhmmssff with an implied decimal – Critical
hh = Hour in which record was taken
Code the beginning of the hour (digits 20-21) in which the record was taken:
00 = after 00:00 to 01:00
01 = after 01:00 to 02:00
...
...
...
22 = after 22:00 to 23:00
23 = after 23:00 to 24:00
mm = Minute in which record was taken
Code the beginning of the minute (digits 22-23) in which the record was taken:
00 = 0 minute to less than 1 minute
01 = 1 minute to less than 2 minutes
...
...
...
58 = 58 minutes to less than 59 minutes
59 = 59 minutes to less than 60 minutes
ss = Second in which record was taken
Code the beginning of the second (digits 24-25) in which the record was taken:
00 = 0 second to less than 1 second
01 = 1 second to less than 2 seconds
...
...
...
58 = 58 seconds to less than 59 seconds
59 = 59 seconds to less than 60 seconds
ff = Fraction of a second to the nearest hundredth of a second in which the record was taken
Code the fraction of a second to the nearest hundredth second (digits 26-27) in which the record was taken:
00 = 00 hundredth seconds to less than 01 hundredth seconds
01 = 01 hundredth seconds to less than 02 hundredth seconds
…
…
…
98 = 98 hundredth seconds to less than 99 hundredth seconds
99 = 99 hundredth seconds to less than 100 hundredth seconds
10. Type of Base Counting Device (Column 28) – Critical
This alphanumeric field details the type of counting device recording the individual record formats, and the type of data contained in this record. The value in this field affects the length of the record being read (the number of columns software reading the record should expect to exist), as well as the definition of the data contained in subsequent columns. Code the correct value for type of traffic counting device.
V = volume only type of device (the expected number of columns is 32)
T = speed type of device (the expected number of columns is 44)
C = classification type of device (the expected number of columns varies with the number of axles on each vehicle)
W = weight type of device by axle weights (the expected number of columns varies with the number of axles on each vehicle)
Z = weight type of device by left and right wheel path weights (the expected number of columns varies with the number of axles on each vehicle)
Note: This assumes that “T” records have filled data columns, allowing speed records to supply vehicle length data, meaning those columns should be blank filled if not used.
11. Vehicle Signature or Other Use Field (Columns 29-32) – Optional
Enter the vehicle unique loop or magnetic signature using the right-most digits first. This field can also be used for other purposes such as vehicle overhang, vehicle width, or other uses. Blank fill all unused columns. For any distance measurement (English) the decimal is implied to be between the 31st and 32nd digits (XXX.X)
| Column Number: |
1 | 2-3 | 4-9 | 10 | 11 | 12-15 | 16-17 | 18-19 | 20-27 | 28 | 29-32 |
| Content Example: |
I | 17 | 018116 | 5 | 1 | 2012 | 11 | 07 | 13284687 | V | Blank |
| I | 17 | 018116 | 5 | 1 | 2012 | 11 | 07 | 13345054 | V | Blank | |
| I | 17 | 018116 | 5 | 1 | 2012 | 11 | 07 | 13383189 | V | Blank |
To submit individual vehicle records that also contain vehicle speed data for each of those vehicles, use the above data format for the first 28 columns, place the letter “T” in column 28, and optionally add vehicle signature data in columns 29-32, then add data to columns 33 to 44 as described below. Blank fill all columns for which data is not available.
| Field | Columns | Width | Description | Type |
|---|---|---|---|---|
| 1 | 1 | 1 | Record Type | C |
| 2 | 2-3 | 2 | FIPS State Code | C |
| 3 | 4-9 | 6 | Station ID | C |
| 4 | 10 | 1 | Direction of Travel Code | C |
| 5 | 11 | 1 | Lane of Travel | C |
| 6 | 12-15 | 4 | Year of Data | C |
| 7 | 16-17 | 2 | Month of Data | C |
| 8 | 18-19 | 2 | Day of Data | C |
| 9 | 20-27 | 8 | Time of Data | C |
| 10 | 28 | 1 | T | C |
| 11 | 29-32 | 4 | Vehicle Signature/Other Use | O |
| 12 | 33-362 | 4 | Vehicle Speed | C/O |
| 13 | 37-38 | 2 | Vehicle Classification | C/O |
| 14 | 39-40 | 2 | Number of Axles | C/O |
| 15 | 41-44 | 4 | Total Vehicle Length (bumper to bumper) |
C/O |
Note:C=Critical, C/O=Critical/Optional, O=Optional
Fields designated as Critical are required to upload data through the TMAS system.
Fields designated as Optional are not required for this record format. Code these fields according to the instructions for each optional field.
Fields designated as Critical/Optional are based on other fields provided in the station record.
12. Vehicle Speed (Columns 33-36) – Critical/Optional
Enter the speed of the vehicle to the nearest tenth of a mph. The decimal is implied between digits 35 and 36. Blank fill if unused.
Example – for a 104.1 mph vehicle, it would be coded as 1041.
13. Vehicle Classification (Columns 37-38) – Critical/Optional according to the following: Critical for C, W and Z devices, Optional for T devices
Enter the classification of the vehicle from FHWA classes 1 to 13. Blank fill if unused.
14. Number of Axles (Columns 39-40) – Critical/Optional according to the following: Critical for C, W and Z devices, Optional for T devices
Enter the total number of detected axles in use by the vehicle (including any trailers). Blank fill if unused.
Note –for the number of axles on the recorded vehicle, the data items related to those axles (in record formats C, W, and Z) shall be classified as critical. Otherwise, the remainder of the fields through column 44 should be blank filled. The record should end after column 44 if no axle spacing data is available (record formats C, W, and Z).
15. Total Vehicle Length (bumper to bumper) (Columns 41-44) – Critical/Optional
Enter the total length of the vehicle from bumper to bumper to the nearest tenth of a foot. The decimal is implied between digits 43 to 44. If no total vehicle length is available blank fill this field.
If the data being submitted do not contain axle spacing information, the data record should be 44 characters in length.
| Column Number: |
1 | 2-3 | 4-9 | 10 | 11 | 12-15 | 16-17 | 18-19 | 20-27 | 28 | 29-32 | 33-36 | 37-38 | 39-40 | 41-44 |
| Content Example: |
I | 17 | 018117 | 1 | 2 | 2012 | 11 | 07 | 09245838 | T | Blank | 0624 | 03 | 02 | 0163 |
| I | 17 | 018117 | 1 | 2 | 2012 | 11 | 07 | 09331278 | T | Blank | 0613 | 09 | 05 | 0691 | |
| I | 17 | 018117 | 1 | 2 | 2012 | 11 | 07 | 09421436 | T | Blank | 0648 | 02 | 02 | 0097 |
This section only applies to those individual records designated with a “C” in Field 10, column 28.
The “C” variant of the per vehicle record format is used to describe the vehicle characteristics (number and spacing of axles) of traffic observed by axle sensing vehicle classification devices. It is a variable length record, where the length (number of columns) of the record is controlled by the number of axles being reported for each vehicle. The number of axles associated with each vehicle is given in columns 39 and 40 as described above. This value is used by the TMAS software reading the record to determine how many columns remain to be read in each record. Do NOT zero fill additional columns beyond those required to report the observed axles for each vehicle.
The maximum record size allowed for “C” formatted records is 140 columns. A record this long is needed only if a single vehicle has 25 axles. The number of columns included in each record can be computed with the following formula.
Last column = ((number of axles - 1) × 4) + 44
Where:
number of axles is the value found in columns 39 and 40 of that record
| Field | Columns | Width | Description | Type |
|---|---|---|---|---|
| 1 | 1 | 1 | Record Type | C |
| 2 | 2-3 | 2 | FIPS State Code | C |
| 3 | 4-9 | 6 | Station ID | C |
| 4 | 10 | 1 | Direction of Travel Code | C |
| 5 | 11 | 1 | Lane of Travel | C |
| 6 | 12-15 | 4 | Year of Data | C |
| 7 | 16-17 | 2 | Month of Data | C |
| 8 | 18-19 | 2 | Day of Data | C |
| 9 | 20-27 | 8 | Time of Data | C |
| 10 | 28 | 1 | C | C |
| 11 | 29-32 | 4 | Vehicle Signature/Other Use | O |
| 12 | 33-36 | 4 | Vehicle Speed | C |
| 13 | 37-38 | 2 | Vehicle Classification | C |
| 14 | 39-40 | 2 | Number of Axles | C |
| 15 | 41-44 | 4 | Total Vehicle Length (bumper to bumper) | O |
| 16 | 45-48 | 4 | Axles 1-2 Spacing | C |
| 17 | 49-52 | 4 | Axles 2-3 Spacing | C/O |
| 18 | 53-56 | 4 | Axles 3-4 Spacing | C/O |
| 19 | 57-60 | 4 | Axles 4-5 Spacing | C/O |
| 20 | 61-64 | 4 | Axles 5-6 Spacing | C/O |
| 21 | 65-68 | 4 | Axles 6-7 Spacing | C/O |
| 22 | 69-72 | 4 | Axles 7-8 Spacing | C/O |
| 23 | 73-76 | 4 | Axles 8-9 Spacing | C/O |
| 24 | 77-80 | 4 | Axles 9-10 Spacing | C/O |
| 25 | 81-84 | 4 | Axles 10-11 Spacing | C/O |
| 26 | 85-88 | 4 | Axles 11-12 Spacing | C/O |
| 27+ | Use additional spacing in 4-digit increments up to 25 axles |
C/O |
Note: C=Critical, C/O=Critical/Optional, O=Optional
Fields designated as Critical are required to upload data through the TMAS system.
Fields designated as Optional are not required for this record format. Code these fields according to the instructions for each optional field.
Fields designated as Critical/Optional are based on other fields provided in the station record.
The definitions of the data to be contained in columns 1 – 44 for the “C” format are described above. The data to be included in columns 45 and later are defined as follows:
16. Axle 1 to 2 Spacing (Columns 45-48) – Critical for C, W, and Z record variants
Enter the total spacing between axles 1 and 2 as a right-justified value, in units of feet. All axle spacings are reported in tenths of a foot with an implied decimal between digits 3 and 4. For example, an axle spacing of 9.6 feet would be entered as “0096.”
17. Axle 2 to 3 Spacing (Columns 49-52) – Critical/Optional
Enter the total spacing between axles 2 and 3 as a right-justified, value, in units of feet.
18. Axle 3 to 4 Spacing (Columns 53-56) – Critical/Optional
Enter the total spacing between axles 3 and 4 as a right-justified, value, in units of feet.
19. Axle 4 to 5 Spacing (Columns 57-60) – Critical/Optional
Enter the total spacing between axles 4 and 5 as a right-justified, value, in units of feet.
20. Axle 5 to 6 Spacing (Columns 61-64) – Critical/Optional
Enter the total spacing between axles 5 and 6 as a right-justified, value, in units of feet.
21. Axle 6 to 7 Spacing (Columns 65-68) – Critical/Optional
Enter the total spacing between axles 6 and 7 as a right-justified, value, in units of feet.
22.Axle 7 to 8 Spacing (Columns 69-72) – Critical/Optional
Enter the total spacing between axles 7 and 8 as a right-justified, value, in units of feet.
23. Axle 8 to 9 Spacing (Columns 73-76) – Critical/Optional
Enter the total spacing between axles 8 and 9 as a right-justified, value, in units of feet.
24. Axle 9 to 10 Spacing (Columns 77-80) – Critical/Optional
Enter the total spacing between axles 9 and 10 as a right-justified, value, in units of feet
25. Axle 10 to 11 Spacing (Columns 81-84) – Critical/Optional
Enter the total spacing between axles 10 and 11 as a right-justified, value, in units of feet.
26. Axle 11 to 12 Spacing (Columns 85-88) – Critical/Optional
Enter the total spacing between axles 11 and 12 as a right-justified, value, in units of feet.
Each additional axle space measurement is allocated four columns. The maximum allowed number of axles is 25, which results in a maximum record length of 140 columns.
| Column Number: |
1 | 2-3 | 4-9 | 10 | 11 | 12-15 | 16-17 | 18-19 | 20-27 | 28 | 29-32 | 33-36 | 37-38 |
| Content Example: |
I | 17 | 018118 | 3 | 4 | 2012 | 11 | 07 | 18583348 | C | Blank | 0582 | 08 |
| Content Example: |
I | 17 | 018118 | 3 | 4 | 2012 | 11 | 07 | 18595775 | C | Blank | 0627 | 02 |
| Content Example: |
I | 17 | 018118 | 3 | 4 | 2012 | 11 | 07 | 19001358 | C | Blank | 0606 | 13 |
continued
| Column Number: |
39-40 | 41-44 | 45-48 | 49-52 | 53-56 | 57-60 | 61-64 | 65-68 | 69-72 | 73-76 | 77-80 | 81-84 | 85-88 |
| Content Example: |
04 | 0584 | 0135 | 0251 | 0048 | Blank | Blank | Blank | Blank | Blank | Blank | Blank | Blank |
| Content Example: |
02 | 0102 | 0076 | Blank | Blank | Blank | Blank | Blank | Blank | Blank | Blank | Blank | Blank |
| Content Example: |
08 | 0845 | 0152 | 0043 | 0154 | 0045 | 0128 | 0147 | 0046 | Blank | Blank | Blank | Blank |
This section only applies to those individual records designated with a W in Field 10, Column 28.
This variation of the individual record format (the “W” record format) is used to describe the number, spacing, and weight of axles for traffic observed by weigh-in-motion scales. The “W variant” is a variable length record, where the length (number of columns) of the record is controlled by the number of axles being reported for each vehicle. The number of axles associated with each vehicle is given in columns 39 and 40 as described above. This value is used by the TMAS software reading the record to determine how many columns should be read in each record. Do NOT zero fill additional columns beyond those required to report the observed axles for each vehicle.
The maximum record size permitted for “W” formatted records is 268 columns. A record this long is needed only if a single vehicle has 25 axles. The number of columns included in each record can be computed with the following formula.
A dummy vehicle class of ‘m’ indicates that weight data for this hour are missing. A dummy vehicle class of ‘d’ indicates that weight data for this hour are not missing, and thus if there are no weight records for the hour, then there were no trucks during that hour. Without these indications, no weight records for an hour might be interpreted to mean that the WIM system was not working.
Last column = ((number of axles - 1) × 9) + 52
Where:
number of axles is the value found in columns 39 and 40 of that record. Based on this ‘last column’ calculation, some optional fields could become critical if it is determined that more than 2 axles are on the given vehicle being reported in the record.
| Field | Columns | Width | Description | Type |
|---|---|---|---|---|
| 1 | 1 | 1 | Record Type | C |
| 2 | 2-3 | 2 | FIPS State Code | C |
| 3 | 4-9 | 6 | Station ID | C |
| 4 | 10 | 1 | Direction of Travel Code | C |
| 5 | 11 | 1 | Lane of Travel | C |
| 6 | 12-15 | 4 | Year of Data | C |
| 7 | 16-17 | 2 | Month of Data | C |
| 8 | 18-19 | 2 | Day of Data | C |
| 9 | 20-27 | 8 | Time of Data | C |
| 10 | 28 | 1 | W | C |
| 11 | 29-32 | 4 | Vehicle Signature/Other Use | O |
| 12 | 33-36 | 4 | Vehicle Speed | C |
| 13 | 37-38 | 2 | Vehicle Classification | C |
| 14 | 39-40 | 2 | Number of Axles | C |
| 15 | 41-44 | 4 | Total Vehicle Length (bumper to bumper) | O |
| 16 | 45-47 | 3 | Pavement Temperature | O |
| 17 | 48-52 | 5 | Axle Weight 1 | C |
| 18 | 53-56 | 4 | Axles 1-2 Spacing | C |
| 19 | 57-61 | 5 | Axle Weight 2 | C/O |
| 20 | 62-65 | 4 | Axles 2-3 Spacing | C/O |
| 21 | 66-70 | 5 | Axle Weight 3 | C/O |
| 22 | 71-74 | 4 | Axles 3-4 Spacing | C/O |
| 23 | 75-79 | 5 | Axle Weight 4 | C/O |
| 24 | 80-83 | 4 | Axles 4-5 Spacing | C/O |
| 25 | 84-88 | 5 | Axle Weight 5 | C/O |
| 26 | 89-92 | 4 | Axle Weight 7 | C/O |
| 27 | 93-97 | 5 | Axle Weight 6 | C/O |
| 28 | 98-101 | 4 | Axles 6-7 Spacing | C/O |
| 29 | 102-106 | 5 | Axle Weight 7 | C/O |
| 30 | 107-110 | 4 | Axles 7-8 Spacing | C/O |
| 31 | 111-115 | 5 | Axle Weight 8 | C/O |
| 32 | 116-119 | 4 | Axles 8-9 Spacing | C/O |
| 33 | 120-124 | 5 | Axle Weight 9 | C/O |
| 34 | 125-128 | 4 | Axles 9-10 Spacing | C/O |
| 35 | 129-133 | 5 | Axle Weight 10 | C/O |
| 36 | 134-137 | 4 | Axles 10-11 Spacing | C/O |
| 37 | 138-142 | 5 | Axle Weight 11 | C/O |
| 38 | 143-146 | 4 | Axles 11-12 Spacing | C/O |
| 39 | 147-151 | 5 | Axle Weight 12 | C/O |
| 40+ | Use additional spacing in 4-digit increments up to 25 axles |
C/O | ||
| 41+ | Use additional weights in 5-digit increments up to 25 axles |
C/O |
Note: C=Critical, C/O=Critical/Optional, O=Optional
Fields designated as Critical are required to upload data through the TMAS system.
Fields designated as Optional are not required for this record format. Code these fields according to the instructions for each optional field.
Fields designated as Critical/Optional are based on other fields provided in the station record.
The data to be provided in columns 1 – 44 are described earlier in sections 7.7.1 and 7.7.2 of this chapter. The data to be included in columns 45 and later are defined as follows:
16. Pavement Temperature (Columns 45-47) – Optional
Enter the pavement temperature rounded to the nearest integer Fahrenheit value. A negative sign may be placed in column 45 if appropriate. If the pavement temperature is unknown blank fill these digits.
17. Axle Weight 1 (Columns 48-52) – Critical
Enter the total axle 1 weight as a right-justified, decimal value, in units of pounds. For example, the axle weight measured as 9,120 pounds could be entered as “ _ 9120” or as “09120” (where “_” represents a blank space.)
18. Axle 1 to 2 Spacing (Columns 53-56) – Critical
Enter the total spacing between axles 1 and 2 as a right-justified value, in units of tenths of feet. All axle spacings are reported in tenths of feet with an implied decimal between digits 3 and 4. For example, an axle spacing of 11.35 feet would be entered as ”0114” or “_114” and an axle spacing of 9.6 feet would be entered as “0096” or “__96” (where “_” represents a blank space).
19. Axle Weight 2 (Columns 57-61) – Critical
Enter the total axle 2 weight as a right-justified value, in units pounds .
20. Axle 2 to 3 Spacing (Columns 62-65) – Critical/Optional
Enter the total spacing between axles 2 and 3 as a right-justified value, in units of tenths of feet.
21. Axle Weight 3 (Columns 66-70) – Critical/Optional
Enter the total axle 3 weight as a right-justified, decimal value, in units of pounds .
22. Axle 3 to 4 Spacing (Columns 71-74) – Critical/Optional
Enter the total spacing between axles 3 and 4 as a right-justified value, in units of tenths of feet.
23.Axle Weight 4 (Columns 75-79) – Critical/Optional
Enter the total axle 4 weight as a right-justified, value, in units of pounds .
24. Axle 4 to 5 Spacing (Columns 80-83) – Critical/Optional
Enter the total spacing between axles 4 and 5 as a right-justified value, in units of tenths of feet.
25. Axle Weight 5 (Columns 84-88) – Critical/Optional
Enter the total axle 5 weight as a right-justified value, in units of pounds
26. Axle 5 to 6 Spacing (Columns 89-92) – Critical/Optional
Enter the total spacing between axles 5 and 6 as a right-justified value, in units of tenths of feet.
27. Axle Weight 6 (Columns 93-97) – Critical/Optional
Enter the total axle 6 weight as a right-justified value, in units of pounds .
28. Axle 6 to 7 Spacing (Columns 98-101) – Critical/Optional
Enter the total spacing between axles 6 and 7 as a right-justified value, in units of tenths of feet.
29. Axle Weight 7 (Columns 102-106) – Critical/Optional
Enter the total axle 7 weight as a right-justified value, in units of pounds
30.Axle 7 to 8 Spacing (Columns 107-110) – Critical/Optional
Enter the total spacing between axles 7 and 8 as a right-justified value, in units of tenths of feet.
31. Axle Weight 8 (Columns 111-115) – Critical/Optional
Enter the total axle 8 weight as a right-justified value, in units of pounds.
32. Axle 8 to 9 Spacing (Columns 116-119) – Critical/Optional
Enter the total spacing between axles 8 and 9 as a right-justified value, in units of tenths of feet
33. Axle Weight 9 (Columns 120-124) – Critical/Optional
Enter the total axle 9 weight as a right-justified value, in units of pounds.
34. Axle 9 to 10 Spacing (Columns 125-128) – Critical/Optional
Enter the total spacing between axles 9 and 10 as a right-justified value, in units of tenths of feet
35. Axle Weight 10 (Columns 129-133) – Critical/Optional
Enter the total axle 10 weight as a right-justified value, in units of pounds.
36.Axle 10 to 11 Spacing (Columns 134-137) – Critical/Optional
Enter the total spacing between axles 10 and 11 as a right-justified value, in units of tenths of feet.
37. Axle Weight 11 (Columns 138-142) - Critical/Optional
Enter the total axle 11 weight as a right-justified value, in units of pounds.
38. Axle 11 to 12 Spacing (Columns 143-146) – Critical/Optional
Enter the total spacing between axles 11 and 12 as a right-justified value, in units of tenths of feet.
39. Axle Weight 12 (Columns 147-151) – Critical/Optional
Enter the total axle 12 weight as a right-justified value, in units of pounds.
For each additional axle beyond the 12th axle, an additional nine columns should be entered. The first four of these columns are the axle spacing to the next axle, followed by the five columns for the weight of that next axle. The maximum number of axles permitted is 25, which uses a record length of 268 columns.
| Column Number: |
1 | 2-3 | 4-9 | 10 | 11 | 12-15 | 16-17 | 18-19 | 20-27 | 28 | 29-32 |
| Content Example: |
I | 17 | 018119 | 7 | 3 | 2012 | 11 | 07 | 05123472 | W | Blank |
| Content Example: |
I | 17 | 018119 | 7 | 3 | 2012 | 11 | 07 | 05123821 | W | Blank |
| Content Example: |
I | 17 | 018119 | 7 | 3 | 2012 | 11 | 07 | 95124378 | W | Blank |
continued
| Column Number: |
33-36 | 37-38 | 39-40 | 41-44 | 45-47 | 48-52 | 53-56 | 57-61 | 62-65 | 66-70 | 71-74 |
| Content Example: |
0551 | 03 | 02 | 0174 | 065 | 03215 | 0142 | 05445 | Blank | Blank | Blank |
| Content Example: |
0572 | 05 | 02 | 0211 | 064 | 05620 | 0187 | 06523 | Blank | Blank | Blank |
| Content Example: |
0560 | 09 | 05 | 0753 | 064 | 12518 | 0152 | 15790 | 0043 | 16250 | 0285 |
continued
| Column Number: |
75-79 | 80-83 | 84-88 | 89-92 | 93-97 | 98-101 | 102-106 | 107-110 | 111-115 | 116-119 | 120-124 |
| Content Example: |
Blank | Blank | Blank | Blank | Blank | Blank | Blank | Blank | Blank | Blank | Blank |
| Content Example: |
Blank | Blank | Blank | Blank | Blank | Blank | Blank | Blank | Blank | Blank | Blank |
| Content Example: |
16535 | 0085 | 15885 | Blank | Blank | Blank | Blank | Blank | Blank | Blank | Blank |
continued
| Column Number: |
125-128 | 129-133 | 134-137 | 138-142 | 143-146 | 147-151 |
| Content Example: |
Blank | Blank | Blank | Blank | Blank | Blank |
| Content Example: |
Blank | Blank | Blank | Blank | Blank | Blank |
| Content Example: |
Blank | Blank | Blank | 15885 | Blank | Blank |
Use additional spacing in 4-digit increments up to 25 axles
Use additional weights in 3-digit increments up to 25 axles
This section only applies to those individual records designated with a Z in Field 10, column 28.
The “Z” variant of the individual record format is used to describe the number, spacing, and weight of axles for traffic observed by weigh-in-motion scales that measure both left and right axle weights. It differs from the “W” record by the fact that it allows the user to report the left- and right-side wheel path weights independently for each axle. This data is available when independent weight sensors are placed in the two wheel paths, such as is typically the case for bending plate, load cell load scale, and some by wheel path piezo systems. Like the “C” and “W” record variants, the “Z variant” is a variable length record, where the length (number of columns) of the record is controlled by the number of axles being reported for each vehicle. The number of axles associated with each vehicle is given in columns 39 and 40 as described in Section 7.7.2. This value is used by the TMAS software reading the record to determine how many columns remain to be read in each record. Do NOT zero fill additional columns beyond those required to report the observed number of axles for each vehicle.
The maximum record size permitted for “Z” formatted records is 393 columns. A record this long is needed only if a single vehicle has 25 axles. The number of columns included in each record can be computed with the following formula.
Last column = (number of axles × 14) + 43
Where:
number of axles is the value found in columns 39 and 40 of that record.
| Field | Columns | Width | Description | Type |
|---|---|---|---|---|
| 1 | 1 | 1 | Record Type | C |
| 2 | 2-3 | 2 | FIPS State Code | C |
| 3 | 4-9 | 6 | Station ID | C |
| 4 | 10 | 1 | Direction of Travel Code | C |
| 5 | 11 | 1 | Lane of Travel | C |
| 6 | 12-15 | 4 | Year of Data | C |
| 7 | 16-17 | 2 | Month of Data | C |
| 8 | 18-19 | 2 | Day of Data | C |
| 9 | 20-27 | 8 | Time of Data | C |
| 10 | 28 | 1 | Z | C |
| 11 | 29-32 | 4 | Vehicle Signature/Other Use | O |
| 12 | 33-36 | 4 | Vehicle Speed | C |
| 13 | 37-38 | 2 | Vehicle Classification | C |
| 14 | 39-40 | 2 | Number of Axles | C |
| 15 | 41-44 | 4 | Total Vehicle Length (bumper to bumper) | O |
| 16 | 45-47 | 3 | Pavement Temperature | O |
| 17 | 48-52 | 5 | Axle Weight 1 | C |
| 18 | 53-57 | 5 | Weight 1 Right Wheel Path | C |
| 19 | 58-61 | 4 | Axles 1-2 Spacing | C |
| 20 | 62-66 | 5 | Weight 2 Left Wheel Path | C |
| 21 | 67-71 | 5 | Weight 2 Right Wheel Path | C/O |
| 22 | 72-75 | 4 | Axles 2-3 Spacing | C/O |
| 23 | 76-80 | 5 | Weight 3 Left Wheel Path | C/O |
| 24 | 81-85 | 5 | Weight 3 Right Wheel Path | C/O |
| 25 | 86-89 | 4 | Axles 3-4 Spacing | C/O |
| 26 | 90-94 | 5 | Weight 4 Left Wheel Path | C/O |
| 27 | 95-99 | 5 | Weight 4 Right Wheel Path | C/O |
| 28 | 100-103 | 4 | Axles 4-5 Spacing | C/O |
| 29 | 104-108 | 5 | Weight 5 Left Wheel Path | C/O |
| 30 | 109-113 | 5 | Weight 5 Right Wheel Path | C/O |
| 31 | 114-117 | 4 | Axles 5-6 Spacing | C/O |
| 32 | 118-122 | 5 | Weight 6 Left Wheel Path | C/O |
| 33 | 123-127 | 5 | Weight 6 Right Wheel Path | C/O |
| 34 | 128-131 | 4 | Axles 6-7 Spacing | C/O |
| 35 | 132-136 | 5 | Weight 7 Left Wheel Path | C/O |
| 36 | 137-141 | 5 | Weight 7 Right Wheel Path | C/O |
| 37 | 142-145 | 4 | Axles 7-8 Spacing | C/O |
| 38 | 146-150 | 5 | Weight 8 Left Wheel Path | C/O |
| 39 | 151-155 | 5 | Weight 8 Right Wheel Path | C/O |
| 40 | 156-159 | 4 | Axles 8-9 Spacing | C/O |
| 41 | 160-164 | 5 | Weight 9 Left Wheel Path | C/O |
| 42 | 165-169 | 5 | Weight 9 Right Wheel Path | C/O |
| 43 | 170-173 | 4 | Axles 9-10 Spacing | C/O |
| 44 | 174-178 | 5 | Weight 10 Left Wheel Path | C/O |
| 45 | 179-183 | 5 | Weight 10 Right Wheel Path | C/O |
| 46 | 184-187 | 4 | Axles 10-11 Spacing | C/O |
| 47 | 188-192 | 5 | Weight 11 Left Wheel Path | C/O |
| 48 | 193-197 | 5 | Weight 11 Right Wheel Path | C/O |
| 49 | 198-201 | 4 | Axles 11-12 Spacing | C/O |
| 50 | 202-206 | 5 | Weight 12 Left Wheel Path | C/O |
| 51 | 207-211 | 5 | Weight 12 Right Wheel Path | C/O |
| 52+ | Use 4 columns for each axle up to 25 axles (include 10 columns of weight prior to the next axle distance |
C/O | ||
| 53+ | Use 5 additional columns for each additional axle for the left wheel path weight, up to 25 axles |
C/O | ||
| 54+ | Use 5 additional columns for each additional axle for the right wheel path weight, up to 25 axles |
C/O |
Note :C=Critical, C/O=Critical/Optional, O=Optional
Fields designated as Critical are required to upload data through the TMAS software.
Fields designated as Optional are not required for this record format. Code these fields according to the instructions for each optional field.
Fields designated as Critical/Optional are based on other fields provided in the station record.
The definitions of the data to be contained in columns 1 – 44 for the “Z” format are described in Sections 7.7.1 and 7.7.2 earlier in this chapter. The data to be included in columns 45 and later are defined as follows:
16. Pavement Temperature (Columns 45-47) – Optional
Enter the pavement temperature rounded to the nearest integer Fahrenheit value. A negative sign may be placed in Column 45 if required. If the pavement temperature is unknown blank fill these digits.
17. Weight 1 Left Wheel Path (Columns 48-52) – Critical
Enter the left axle 1 weight as a right-justified value, in units of pounds. For example, the axle weight measured as 9,120 pounds could be entered as ”09120” or “_9120”
18. Weight 1 Right Wheel Path (Columns 53-57) – Critical
Enter the right axle 1 weight as a right-justified value, in units of pounds
19.Axle 1 to 2 Spacing (Columns 58-61) – Critical
Enter the total spacing between axles 1 and 2 as a right-justified value, in units of tenths of feet. All axle spacings are reported in tenths of a foot with an implied decimal between digits 3 and 4. For example, an axle spacing of 11.35 feet would be entered as ”0114.”
20. Weight 2 Left Wheel Path (Columns 62-66) – Critical
Enter the left axle 2 weight as a right-justified value, in units of pounds
21. Weight 2 Right Wheel Path (Columns 67-71) – Critical
Enter the right axle 2 weight as a right-justified value, in units of pounds.
22. Axle 2 to 3 Spacing (Columns 72-75) – Critical/Optional
Enter the total spacing between axles 2 and 3 as a right-justified value, in units of tenths of feet.
23. Weight 3 Left Wheel Path (Columns 76-80) Critical/Optional
Enter the left axle 3 weight as a right-justified value, in units of pounds.
24. Weight 3 Right Wheel Path (Columns 81-85) – Critical/Optional
Enter the right axle 3 weight as a right-justified, decimal value, in units of pounds
25. Axle 3 to 4 Spacing (Columns 86-89) – Critical/Optional
Enter the total spacing between axles 3 and 4 as a right-justified value, in units of tenths of feet.
26. Weight 4 Left Wheel Path (Columns 90-94) Critical/Optional
Enter the left axle 4 weight as a right-justified value, in units of pounds.
27. Weight 4 Right Wheel Path (Columns 95-99) – Critical/Optional
Enter the right axle 4 weight as a right-justified value, in units of pounds
28. Axle 4 to 5 Spacing (Columns 100-103) – Critical/Optional
Enter the total spacing between axles 4 and 5 as a right-justified value, in units of tenths of feet.
29. Weight 5 Left Wheel Path (Columns 104-108) ) – Critical/Optional
Enter the left axle 5 weight as a right-justified value, in units of pounds.
30. Weight 5 Right Wheel Path (Columns 109-113) – Critical/Optional
Enter the right axle 5 weight as a right-justified value, in units of pounds.
31. Axle 5 to 6 Spacing (Columns 114-117) – Critical/Optional
Enter the total spacing between axles 5 and 6 as a right-justified value, in units of tenths of feet.
32. Weight 6 Left Wheel Path (Columns 118-122) – Critical/Optional
Enter the left axle 6 weight as a right-justified value, in units of pounds.
33. Weight 6 Right Wheel Path (Columns 123-127) Critical/Optional
Enter the right axle 6 weight as a right-justified value, in units of pounds.
34. Axle 6 to 7 Spacing (Columns 128-131) – Critical/Optional
Enter the total spacing between axles 6 and 7 as a right-justified value, in units of tenths of feet.
35. Weight 7 Left Wheel Path (Columns 132-136) – Critical/Optional
Enter the left axle 7 weight as a right-justified value, in units of pounds.
36. Weight 7 Right Wheel Path (Columns 137-141) – Critical/Optional
Enter the right axle 7 weight as a right-justified value, in units of pounds.
37. Axle 7 to 8 Spacing (Columns 142-145) – Critical/Optional
Enter the total spacing between axles 7 and 8 as a right-justified value, in units of tenths of feet.
38. Weight 8 Left Wheel Path (Columns 146-150) ) – Critical/Optional
Enter the left axle 8 weight as a right-justified value, in units of pounds
39. Weight 8 Right Wheel Path (Columns 151-155) ) – Critical/Optional
Enter the right axle 8 weight as a right-justified value, in units of pounds.
40. Axle 8 to 9 Spacing (Columns 156-159) – Critical/Optional
Enter the total spacing between axles 8 and 9 as a right-justified value, in units of tenths of feet.
41. Weight 9 Left Wheel Path (Columns 160-164) – Critical/Optional
Enter the left axle 9 weight as a right-justified value, in units of pounds.
42. Weight 9 Right Wheel Path (Columns 165-169) – Critical/Optional
Enter the right axle 9 weight as a right-justified value, in units of pounds.
43. Axle 9 to 10 Spacing (Columns 170-173) – Critical/Optional
Enter the total spacing between axles 9 and 10 as a right-justified value, in units of tenths of feet.
44. Weight 10 Left Wheel Path (Columns 174-178) – Critical/Optional
Enter the left axle 10 weight as a right-justified value, in units of pounds.
45. Weight 10 Right Wheel Path (Columns 179-183) – Critical/Optional
Enter the right axle 10 weight as a right-justified value, in units of pounds.
46. Axle 10 to 11 Spacing (Columns 184-187) – Critical/Optional
Enter the total spacing between axle 10 and 11 as a right-justified value, in units of tenths of feet.
47. Weight 11 Left Wheel Path (Columns 188-192) – Critical/Optional
Enter the left axle 11 weight as a right-justified value, in units of pounds.
48. Weight 11 Right Wheel Path (Columns 193-197) – Critical/Optional
Enter the right axle 11 weight as a right-justified value, in units of pounds.
49. Axle 11 to 12 Spacing (Columns 198-201) – Critical/Optional
Enter the total spacing between axle 11 and 12 as a right-justified value, in units of tenths of feet
50. Weight 12 Left Wheel Path (Columns 202-206) – Critical/Optional
Enter the total axle 12 weight as a right-justified value, in units of pounds.
51. Weight 12 Right Wheel Path (Columns 207-211) – Critical/Optional
Enter the total axle 12 weight as a right-justified value, in units of pounds.
For each additional axle beyond the 12th axle, an additional ten columns should be entered. The first four of these columns contain the axle spacing to the next axle, followed by five columns for the weight measured in the left wheel path for that axle, followed by five more columns for the weight measured in the right wheel path. The maximum number of axles permitted is 25, which creates a record length of 393 columns.
| Column Number: |
2-3 | 4-9 | 10 | 11 | 12-15 | 16-17 | 18-19 | 20-27 | 28 | 29-32 |
| Content Example: |
17 | 018119 | 7 | 1 | 2012 | 11 | 07 | 07103474 | Z | Blank |
| Content Example: |
17 | 018119 | 7 | 1 | 2012 | 11 | 07 | 07103838 | Z | Blank |
| Content Example: |
17 | 018119 | 7 | 1 | 2012 | 11 | 07 | 07105881 | Z | Blank |
continued
| Column Number: |
33-36 | 37-38 | 39-40 | 41-44 | 45-47 | 48-52 | 53-57 | 58-61 | 62-66 | 67-71 |
| Content Example: |
0561 | 01 | 02 | 0074 | 071 | Blank | 00590 | 0051 | Blank | 00400 |
| Content Example: |
0605 | 02 | 02 | 0074 | 071 | 01225 | 01315 | 0078 | 01700 | 01580 |
| Content Example: |
0593 | 07 | 04 | 0074 | 070 | 07335 | 06742 | 0128 | 03478 | 03765 |
continued
| Column Number: |
72-75 | 76-80 | 81-85 | 86-89 | 90-94 | 95-99 | 100-103 | 104-108 | 109-113 | 114-117 |
| Content Example: |
Blank | Blank | Blank | Blank | Blank | Blank | Blank | Blank | Blank | Blank |
| Content Example: |
Blank | Blank | Blank | Blank | Blank | Blank | Blank | Blank | Blank | Blank |
| Content Example: |
0038 | 05200 | 04797 | 0045 | 04935 | 04809 | Blank | Blank | Blank | Blank |
continued
| Column Number: |
118-122 | 123-127 | 128-131 | 132-136 | 137-141 | 142-145 | 146-150 | 151-155 | 156-159 | 160-164 |
| Content Example: |
Blank | Blank | Blank | Blank | Blank | Blank | Blank | Blank | Blank | Blank |
| Content Example: |
Blank | Blank | Blank | Blank | Blank | Blank | Blank | Blank | Blank | Blank |
| Content Example: |
Blank | Blank | Blank | Blank | Blank | Blank | Blank | Blank | Blank | Blank |
continued
| Column Number: |
165-169 | 170-173 | 174-178 | 179-183 | 184-187 | 188-192 | 193-197 | 198-201 | 202-206 | 207-211 |
| Content Example: |
Blank | Blank | Blank | Blank | Blank | Blank | Blank | Blank | Blank | Blank |
| Content Example: |
Blank | Blank | Blank | Blank | Blank | Blank | Blank | Blank | Blank | Blank |
| Content Example: |
Blank | Blank | Blank | Blank | Blank | Blank | Blank | Blank | Blank | Blank |
Use 4 columns for each axle up to 25 axles (include 6 columns of weight prior to the next axle distance)
Use 5 additional columns for each additional axle for the left wheel path weight, up to 25 axles
Use 5 additional columns for each additional axle for the right wheel path weight, up to 25 axles
Table 7-30 provides the recommended data submittal frequency to FHWA.
| Data Type | Submittal Frequency |
|---|---|
| Volume Data | Monthly, by 25 days after close of the month for which the data was collected |
| Station Description Record | Annually, or when a change occurs |
| Classification Data | Monthly, by 25 days after close of the month for which the data was collected |
| Weight Data | Minimum quarterly by the 25th of the month after the end of the quarter or, with recommended monthly submissions 25 days after the close of the month for which the data was collected |
| Speed Data | Monthly, by 25 days after close of the month for which the data was collected |
| Per Vehicle Format (PVF) (Optional) | Data type submissions follow the above timelines |
| Non-Motorized Data | Minimum quarterly by the 25th of the month after the end of the quarter |
All data files should be submitted to FHWA through TMAS via the User Profile and Access Control System (UPACS). States should contact their State FHWA Division Offices for further instructions regarding UPACS.
All data should be in the record formats described in this chapter and quality controlled to ensure it truly represents travel on the given location/time period. If the files are large, it is preferable that a compression program such as PKZIP be used to condense them. For further information, contact the Travel Monitoring and Surveys Division at (202) 366-0175 or access information from the Office of Highway Policy and Information web site.
This publication of the TMG includes a new chapter (Chapter 4) on the collection of non-motorized data. Collecting and reporting on non-motorized travel is growing in importance, due to the significant efforts being made to encourage the use of more active modes of transportation (walking/biking) in order to gain a variety of health, financial, and environmental benefits. It is therefore, important to be able to track changes in the amount of walking and biking that result from changes in public attitudes and land uses, the implementation of new policies, and the construction of new facilities.
Two record formats are defined for submitting non-motorized data:
The Count Station Description Record parameters are described in this section, and Section 7.10 describes the requirements for the Non-Motorized Count Record.
The Non-Motorized Count Station Description Record is needed for reporting all non-motorized data to FHWA. If a Non-Motorized Station Description record is omitted, any succeeding records containing non-motorized data will not be processed by the TMAS software. The Non-Motorized Count Station Description file contains one record per traffic monitoring station for each land by direction per year. In addition, updated station records can be submitted at any time during the year if an equipment change occurs at a site, which would result in a different type of data being submitted at that location. All fields on each record are considered to be character fields.
The TMAS software retains all approved station records as of December 31st of each year. FHWA recommends that a yearly review of all station record fields be conducted to insure the records are current and reflect what is in the field.

The non-motorized record formats should be submitted to FHWA on a quarterly basis. A future version of TMAS (3.0 or prior) will include pedestrian and bicycle data formats, processing and reporting.
| Field | Columns | Width | Description | Type |
|---|---|---|---|---|
| 1 | 1 | 1 | Non-motorized station/location record identifier (L) | C |
| 2 | 2-3 | 2 | State FIPS Code | C |
| 3 | 4-6 | 3 | County FIPS Code | C |
| 4 | 7-12 | 6 | Station ID | C |
| 5 | 13 | 1 | (Functional) classification of road (expanded) | C |
| 6 | 14 | 1 | Direction of route | C |
| 7 | 15 | 1 | Location of count relative to roadway orientation | C |
| 8 | 16 | 1 | Direction of travel | C |
| 9 | 17 | 1 | Crosswalk, sidewalk, or exclusive facility | C |
| 10 | 18 | 1 | Intersection | O |
| 11 | 19 | 1 | Type of count (bike/pedestrian/both) | C |
| 12 | 20-21 | 2 | Method of counting | C |
| 13 | 22-23 | 2 | Type of Sensor | O |
| 14 | 24-27 | 4 | Year of data | C |
| 15 | 28 | 1 | Factor Group 1 | O |
| 16 | 29 | 1 | Factor Group 2 | O |
| 17 | 30 | 1 | Factor Group 3 | O |
| 18 | 31 | 1 | Factor Group 4 | O |
| 19 | 32 | 1 | Factor Group 5 | O |
| 20 | 33 | 1 | Primary Count Purpose | O |
| 21 | 34-35 | 2 | Posted Speed Limit | O |
| 22 | 36-39 | 4 | Year station established | C |
| 23 | 40-43 | 4 | Year station discontinued | O |
| 24 | 44 | 1 | National highway system | O |
| 25 | 45-52 | 8 | Latitude | C |
| 26 | 53-61 | 9 | Longitude | C |
| 27 | 62-63 | 2 | Posted Route Signing | O |
| 28 | 64-71 | 8 | Posted Signed Route Number | O |
| 29 | 72-131 | 60 | LRS Identification | O |
| 30 | 132-139 | 8 | LRS Location Point | O |
| 31 | 140-189 | 50 | Station location | O |
| 32 | 190-239 | 50 | Other Notes | O |
Note : C = Critical, O = Optional
Fields designated as Critical are required for this record format.
Fields designated as Optional are not required for this record format. Code these fields according to the instructions for each optional field.
Non-motorized station/location record identifier (Column 1) – Critical
Code the letter “L”
State FIPS Code (Columns 2-3) – Critical
| State | Code | State | Code | State | Code |
|---|---|---|---|---|---|
| Alabama | 1 | Maine | 23 | Pennsylvania | 42 |
| Alaska | 2 | Maryland | 24 | Rhode Island | 44 |
| Arizona | 4 | Massachusetts | 25 | South Carolina | 45 |
| Arkansas | 5 | Michigan | 26 | South Dakota | 46 |
| California | 6 | Minnesota | 27 | Tennessee | 47 |
| Colorado | 8 | Mississippi | 28 | Texas | 48 |
| Connecticut | 9 | Missouri | 29 | Utah | 49 |
| Delaware | 10 | Montana | 30 | Vermont | 50 |
| D.C. | 11 | Nebraska | 31 | Virginia | 51 |
| Florida | 12 | Nevada | 32 | Washington | 53 |
| Georgia | 13 | New Hampshire | 33 | West Virginia | 54 |
| Hawaii | 15 | New Jersey | 34 | Wisconsin | 55 |
| Idaho | 16 | New Mexico | 35 | Wyoming | 56 |
| Illinois | 17 | New York | 36 | Puerto Rico | 72 |
| Indiana | 18 | North Carolina | 37 | American Samoa | 60 |
| Iowa | 19 | North Dakota | 38 | Guam | 66 |
| Kansas | 20 | Oregon | 41 | Northern Mariana Islands | 69 |
| Kentucky | 21 | Ohio | 39 | Virgin Islands of the U.S. | 78 |
| Louisiana | 22 | Oklahoma | 40 |
Canadian Provinces may use TMAS with the following codes (based on the LTPP):
| State | Code | State | Code | State | Code |
|---|---|---|---|---|---|
| Alberta | 81 | Nova Scotia | 86 | Yukon | 91 |
| British Columbia | 82 | Ontario | 87 | Northwest Territory | 92 |
| Manitoba | 83 | Prince Edward Island | 88 | Labrador | 93 |
| New Brunswick | 84 | Quebec | 89 | Nunavut | 94 |
| Newfoundland | 85 | Saskatchewan | 90 |
County FIPS Code (Columns 4-6) – Critical
Use the three-digit FIPS county code (see Federal Information Processing Standards Publication 6, Counties of the States of the United States).
Station ID (Columns 7-12) - Critical
This field should contain an alphanumeric designation for the station where the survey data is collected. Station identification field entries should be identical in all records for a given station. Differences in characters, including spaces, blanks, hyphens, etc., prevent proper match.
This field should be right-justified with unused columns zero-filled. Do not use embedded blanks.
Functional Classification of Road (expanded) (Column 13) – Critical
This starts with the current U.S. DOT functional classification system, but also adds categories for trail or share use path, and general activity count (i.e., for pedestrian counts in an open area like the Mall in Washington, D.C.). It is used in association with a second variable that indicates for roads whether the count was made on the main roadway, on a sidewalk, or on a special lane intended for use exclusively by non-motorized vehicles (e.g., bike lane.)
| Code | Classification |
|---|---|
| 1 | Interstate |
| 2 | Principal Arterial – Other Freeways and Expressways |
| 3 | Principal Arterial – Other |
| 4 | Minor Arterial |
| 5 | Major Collector |
| 6 | Minor Collector |
| 7 | Local |
| 8 | Trail or Shared Use Path |
| 9 | General Activity Count |
6. Direction of Route (Column 14) – Critical
This is the direction of travel of the main roadway. Note that a north/south roadway can be coded as either a “N” or as a “S” but the selection of the direction affects how the “Location of Count Relative to Roadway Orientation” variable (the next variable) is coded in order to effectively define the location and direction of the non-motorized count.
| Code | Direction |
|---|---|
| 0 | East-West or Southeast-Northwest combined (volume stations only) |
| 1 | North |
| 2 | Northeast |
| 3 | East |
| 4 | Southeast |
| 5 | South |
| 6 | Southwest |
| 7 | West |
| 8 | Northwest |
| 9 | North-South or Northeast-Southwest combined (volume stations only) |
7.Location of Count Relative to Roadway Orientation (Column 15) – Critical
1 = the count is taken on the side of the road for the listed direction of travel;
2 = the count is taken on the opposite side of the road from the listed direction (i.e., the side with on-coming traffic, given the listed direction of travel);
3 = both sides of the road combined (appropriate for example, if counting a trail or other shared use path); and
4 = traffic moving perpendicular to the roadway (that is, crossing the street).
Example: If you code the Direction of Route as “North” and are in fact driving in that northbound direction, a “1” for this variable would indicate that you are counting on the right (eastern) side of the road; a “2” would indicate you are counting non-motorized traffic on the left (western) side of the road; a “3” would indicate that you are counting all non-motorized traffic, regardless of which side of the road, and would be appropriate for use on a trail or other shared use path. For that same facility, if Direction of Route were coded as “South” then a count performed on the eastern side of the road would be coded as a “2”, since it would be on the opposite side of the road for vehicle traveling southbound.
8. Direction of Travel (Column 16) – Critical
1 = travel monitored only occurring in the Direction of Route;
2 = travel monitored only occurring opposite to the Direction of Route;
3 = travel in both (all) directions; and
4 = travel at an intersection that includes all movements (e.g., the sum of movements on all four crosswalks, or all movements occurring during a pedestrian scramble (or “Barnes Dance”) phase. Note: The “Intersection” variable should also be coded as a 1 or 2 if this variable is coded as a 4. For a “General Activity Count” that includes all movements in all directions, code direction of travel as a “3” “all directions.”)
Note: To actually understand where a count is being taken (what side of the road, and which directions of travel are being counted) it is necessary to look at all three variables, Direction of Route, Location of Count Relative to Roadway Orientation, and Direction of Travel. It may also be necessary to look at the Crosswalk variable immediately below.
9. Crosswalk, Sidewalk, Exclusive Facility, or Total Intersection Count (Column 17) – Critical
Indicates if the count was taken outside of the primary right-of-way:
1 = in roadway/trail right of way (potentially shared with motorized vehicles)
2 = exclusively in a crosswalk
3 = on a sidewalk
4 = on an exclusive (for non-motorized traffic) right-of-way, parallel to the primary facility (including exclusive bike lanes, whether those lanes are separated from motorized vehicles by paint stripes or by some specific physical barrier but not including sidewalks, crosswalks, or trails or other shared use paths that are not for licensed, motorized vehicles)
5 = on a grade separate facility designed to allow non-motorized traffic to pass over top of a roadway (e.g., a pedestrian bridge)
6 = on a grade separate facility designed to allow non-motorized traffic to cross underneath a roadway (e.g., a pedestrian undercrossing)
For an “Area Count” leave this field blank.
Note 1: if “perpendicular to traffic” is selected in “Location of Count Relative to Roadway Orientation” variable and the “Crosswalk” variable is coded as “in roadway right of way” then the count includes ALL people crossing a roadway. If “exclusively in a crosswalk” is indicated, then only those in the crosswalk (or directly next to the crosswalk) are being counted. This coding differentiation is designed to indicate if all pedestrians crossing a street within a given block (including jaywalkers) are being counted, or whether only pedestrians actually using a marked crosswalk are being counted.
Note 2: if the count is being taken on a trail or other shared use path that is not intended for conventional passenger cars or licensed commercial vehicles, code the trail count as a “0”, even if the trail may be routinely used by motorcycles, snowmobiles or other motorized vehicles designed for off-road uses.
10.Intersection (Column 18) – Optional
1 = count is taken at an intersection (but not an intersection with a roundabout),
2 = count taken at an intersection with a roundabout
otherwise (blank) NOT at an intersection
11.Type of Count (Column 19) – Critical
1 = pedestrians (only) are being counted
2 = bicycles (only) are being counted
3 = equestrians (only) are being counted
4 = both pedestrians and bicycles are included in this count
5 = all passing non-motorized traffic are included in this count
6 = motorized vehicles are being counted (intended for counts of snowmobiles, all terrain vehicles, and other off-road vehicles using a trail or other shared use path)
7 = all motorized and non-motorized traffic using the facility (intended for trails and share use paths that experience a combination of pedestrian, bicycle, equestrian, and off-road vehicle traffic)
8 = other animals (specify in Field #32 (Other Notes) what kind of animals)
12.Method of Counting (Columns 20-21) – Critical
1 = Human observation (manual)
2 = Portable traffic recording device
3 = Permanent, continuous count station (CCS
13. Type of Sensor (Columns 22-23) – Optional
Code for the type of sensor used for detection.
9 = Multiple counts are made at this location, different counts may use different sensors (see the individual count records for the sensors used for specific counts)
H = Human observation (manual)
I = Infrared (passive)
2 = Active Infrared (requires a target on other side of facility being monitored)
K = Laser/lidar
L = Inductive loop
M = Magnetometer
P = Piezoelectric
Q = Quartz piezoelectric
R = Air tube
S = Sonic/acoustic
T = Tape switch
3 = other pressure sensor/mat
U = Ultrasonic
V = Video image (with automated or semi-automated conversion of images to counts)
1 = Video image with manual reduction of images to counts performed at a later time
W = Microwave (radar)
X = Radio wave (radar)
Z = Other
14. Year of Data (Columns 24-27) – Critical
Code the four digits of the year in which the data were collected.
FACTOR GROUPS: A total of five single digit fields are provided so that States can list the identifiers used to factor the count provided. The values in these records are not the factors themselves, but simply identifiers of the factor groups used. The factors are used to convert short duration counts to estimates of daily travel or annual travel. In the case of permanent, continuous count locations these identifiers describe which factor group that count location belongs to, so that these adjustment factors can be computed. States and other submitting agencies can use the text field in the “other information” category at the end of this record to further describe the factor groups to which the site is assigned. At this time, the use of these factor groups is both optional and flexible. A submitting agency may assign each factor identifier to purposes as the agency sees fit.
15. Factor Group 1 (Column 28) – Optional
The first of five allowable (but optional) variables that allow identification of a factor group that is used to adjust short duration counts at this location to estimates of annual average condition. (For example, this first factor group could be used to identify this site’s time-of-day pattern, but it does not have to be used for that purpose.)
16. Factor Group 2 (Column 29) – Optional
The second of five allowable (but optional) variables that allow identification of a factor group that is used to adjust short duration counts at this location to estimates of annual average condition. For example, this second factor group could be used to identify DOW patterns (Is this a commuter route or a recreational route?), but it does not have to be used for that purpose
17. Factor Group 3 (Column 30) – Optional
The third of five allowable (but optional) variables that allow identification of a factor group that is used to adjust short duration counts at this location to estimates of annual average condition. (For example, this third factor group could be used to identify monthly or seasonal patterns, but it does not have to be used for that purpose.)
18. Factor Group 4 (Column 31) – Optional
The fourth of five allowable (but optional) variables that allow identification of a factor group that is used to adjust short duration counts at this location to estimates of annual average condition. (For example, this factor group could be used to identify equipment adjustment patterns needed because of the specific type of equipment being used, but it does not have to be used for that purpose.)
19. Factor Group 5 (Column 32) – Optional
The fifth of five allowable (but optional) variables that allow identification of a factor group that is used to adjust short duration counts at this location to estimates of annual average condition. (For example, this factor group could be used for adjustments due to the type of weather being experienced during the count, but does not have to be used for that purpose.)
20. Primary Count Purpose – (Column 33) – Optional
This field indicates the primary purpose for installing the station and hence which organization is responsible for it and supplies the data
O = Operations and facility management purposes
P = Planning or statistic reporting purposes
R = Research purposes
S = Count taken as part of a Safe Route to School data collection effort
L = Facility design purposes
E = Enforcement purposes
21. Posted Speed Limit (Columns 34-35) – Optional
If count is taken on a facility with posted speed limit indicate that limit in miles per hour. Otherwise leave blank.
22. Year Station Established (Columns 36-39) – Optional
Code the four digits of the appropriate year if known
23. Year Station Discontinued (Columns 40-43) – Optional
Code the four digits of the appropriate year if known
24. National Highway System (Column 44) – Optional
N = No, not on National Highway System
Y = Yes, on National Highway System
25.Latitude (Columns 45-52) – Critical
This is the latitude of the station location with the north hemisphere assumed and an implied decimal place understood as XX.XXX XXX
26. Longitude (Columns 53-61) – Critical
This is the longitude of the station location with the west hemisphere assumed and an implied decimal place understood as XXX.XXX XXX
27. Posted Route Signing – (Columns 62-63) – Optional
This is the same as Route Signing in the 2012 HPMS Field Manual (Data Item 18 in HPMS Sections dataset). These codes are shown below.
| Code | Description |
|---|---|
| 1 | Not signed |
| 2 | Interstate |
| 3 | U.S. |
| 4 | State |
| 5 | Off-Interstate Business Marker |
| 6 | County |
| 7 | Township |
| 8 | Municipal |
| 9 | Parkway Marker or Forest Route Marker |
| 10 | None of the above |
28. Posted Signed Route Number (Columns 64-71) – Optional
If the station is located on a city street and is not on a U.S. Bike Route, zero-fill this field.
29. Linear Referencing System (LRS) Identification (Columns 72-131) – Optional
The LRS Identification reported in this item for the station must be the same as the LRS identification reported in the HPMS for the section of roadway where the station is located. The LRS identification is a 60-character, right justified value. The LRS ID can be alphanumeric, but must not contain blanks; leading zeros must be coded. More information concerning the LRS may be found in Chapter III of the HPMS Field Manual (Sept. 2010), Linear Referencing System Requirements.
30. Linear Referencing System (LRS) Location Point (Columns 132-139) - Optional
This is the LRS location point for the station. It is similar information to the LRS Beginning Point and LRS Ending Point in the HPMS. The milepoint for the station must be within the range of the LRS beginning point and LRS ending point for the roadway section upon which the station is located. It is coded in miles, to the nearest thousandth of a mile, with an implied decimal in the middle: XXXX.XXX.
31. Station Location (Columns 140-189) – Optional
This is an English text entry field. For stations located on a numbered route, enter the name of the nearest major intersecting route, State border, or landmark on State road maps and the distance and direction of the station from that landmark to the station (e.g., “12 miles south of the Kentucky border”). If the station is located on a city street, enter the city and street name. Abbreviate if necessary. Left justify
32. Other Notes (Columns 190-239) - Optional
This is an English text field that can be used to provide notes to others users of data from this location. For example, it can be used to describe the specific use of factor groups 1 through 5. Also, if Field #11 (Type of Count) is coded as 8 (other animals), indicate the type(s) of animals in this field (Other Notes).
| Column Number: |
1 | 2-3 | 4-6 | 7-12 | 13 | 14 | 15 | 16 | 17 | 18 | 19 | 20-21 | 22-23 |
| Content Example: |
L | 08 | 045 | GLWD06 | 2 | 3 | 1 | 1 | 4 | Blank | 2 | 01 | -H |
continued
| Column Number: |
24-27 | 28 | 29 | 30 | 31 | 32 | 33 | 34-35 | 36-39 | 40-43 | 44 | 45-52 | 53-61 |
| Content Example: |
2011 | Blank | Blank | Blank | Blank | R | 65 | 2010 | Blank | Blank | Y | 39550600N | 107324200 |
continued
| Column Number: |
64-71 | 72-131 | 132-139 | 140-189 | 62-63 | 190-239 | |||||||
| Content Example: |
- - - - US-6 | 0000…. 00LRSID123456 |
2 miles east of US 6 and SH82 | 03 | This station is for collection of bicycle counts using human observation | ||||||||
The Non-Motorized Count Record format is a variable length, fixed field record. One record is used for each calendar day for which traffic monitoring data is being submitted. Considerable flexibility is built into this record. It allows non-motorized data to be reported at a variety of time intervals. The time interval being counted can be 5, 10, 15, 20, 30, 60, or 120 minutes, with the interval being reported as a field on each record. Table 7-37 describes all the fields used in this record.
As with previous data formats, all numeric fields should be right-justified and blank fill the columns for which no data is being reported. All fields should be blank filled if not used.

| Field | Columns | Width | Description | Type |
|---|---|---|---|---|
| 1 | 1 | 1 | Non-motorized count record identifier (N) | C |
| 2 | 2-3 | 2 | State FIPS Code | C |
| 3 | 4-6 | 3 | County FIPS Code | C |
| 4 | 7-12 | 6 | Station ID | C |
| 5 | 13-20 | 8 | Latitude | O |
| 6 | 21-29 | 9 | Longitude | O |
| 7 | 30 | 1 | Direction of route | C |
| 8 | 31 | 1 | Location of count relative to roadway orientation | C |
| 9 | 32 | 1 | Direction of travel | C |
| 10 | 33 | 1 | Crosswalk, sidewalk, or exclusive facility | C |
| 11 | 34 | 1 | Intersection | O |
| 12 | 35 | 1 | Type of count (e.g., bike/pedestrian/both) | C |
| 13 | 36-37 | 2 | Type of sensor | C |
| 14 | 38/td> | 1 | Precipitation (yes/no) | O |
| 15 | 39-41 | 3 | High temperature | O |
| 16 | 42-44 | 3 | Low temperature | O |
| 17 | 45-48 | 4 | Year of count | C |
| 18 | 49-50 | 2 | Month of count | C |
| 19 | 51-52 | 2 | Day of count | C |
| 20 | 53-56 | 4 | Count start time for this record (military time, HHMM) | C |
| 21 | 57-59 | 3 | Count interval being reported (in minutes) Allowable entries: 05, 10, 15, 20, 30, 60, or 120) |
C |
| 22 | 60-64 | 5 | Count for interval 1 | C |
| 23 | 65-69 | 5 | Count for interval 2 | C/O |
| 24 | 70-74 | 5 | Count for interval 3 | C/O |
| 25 | 75-79 | 5 | Count for interval 4 | C/O |
| 26 | 80-84 | 5 | Count for interval 5 | C/O |
| 27 | 85-89 | 5 | Count for interval 6 | C/O |
| 28 | 90-94 | 5 | Count for interval 7 | C/O |
| 29 | 95-99 | 5 | Count for interval 8 | C/O |
| 30 | 100-104 | 5 | Count for interval 9 | C/O |
| 31 | 105-109 | 5 | Count for interval 10 | C/O |
| 32 | 110-114 | 5 | Count for interval 11 | C/O |
| 33 | 115-119 | 5 | Count for interval 12 | C/O |
| 34 | 120-124 | 5 | Count for interval 13 | C/O |
| 35 | 125-129 | 5 | Count for interval 14 | C/O |
| 36 | 130-134 | 5 | Count for interval 15 | C/O |
| 37 | 135-139 | 5 | Count for interval 16 | C/O |
| 38 | 140-144 | 5 | Count for interval 17 | C/O |
| 39 | 145-149 | 5 | Count for interval 18 | C/O |
| 40 | 150-154 | 5 | Count for interval 19 | C/O |
| 41 | 155-159 | 5 | Count for interval 20 | C/O |
| 42 | 160-164 | 5 | Count for interval 21 | C/O |
| 43 | 165-169 | 4 | Count for interval 22 | C/O |
| 44 | 170-174 | 5 | Count for interval 23 | C/O |
| 45 | 175-179 | 5 | Count for interval 24 – End of hourly count record | C/O |
| 46- 309 | 180-2500 | Count intervals 25 – 288 are used only if the reported day contains this many reporting time periods. Only report those periods for which data were collected. Up to 288 reporting periods are needed if 5-minute intervals are used. Up to 144 periods are needed for 10-minute intervals. Up to 96 periods are needed for 15-minute intervals Up to 72 periods are needed for 20-minute intervals Up to 48 periods are needed for 30-minute intervals Up to 24 periods are needed for 60-minute intervals |
O |
Note: C = Critical, O = Optional and C/O = Critical or Optional
1.Non-motorized count record identifier (Column 1) – Critical
Code the letter “N”
2. State FIPS Code (Columns 2-3) – Critical
See Section 7.9, Field #2 of Non-Motorized Count Station Description Record.
3. County FIPS Code (Columns 4-6) – Critical
Use the three-digit FIPS county code (see Federal Information Processing Standards Publication 6, “Counties of the States of the United States”).
4. Station ID (Columns 7-12) – Critical
This field should contain an alphanumeric designation for the station where the survey data is collected. Station identification field entries should be identical in all records for a given station. Differences in characters, including spaces, blanks, hyphens, etc., prevent proper match.
This field should be right-justified with unused columns zero-filled. Do not use embedded blanks.
5. Latitude (Columns 13-20) – Optional
This is the latitude of the station location with the north hemisphere assumed and an implied decimal place understood as XX.XXX XXX.
6. Longitude (Columns 21-29) – Optional
This is the longitude of the station location with the west hemisphere assumed and an implied decimal place understood as XXX.XXX XXX
7. Direction of route (Column 30) – Critical
This is the direction of travel of the main roadway. Note that a north/south roadway can be coded as either a “N” or as a “S” but the selection of the direction affects how the “Location of Count Relative to Roadway Orientation” variable (the next variable) is coded in order to effectively define the location and direction of the non-motorized count
| Code | Direction |
|---|---|
| 1 | North |
| 2 | Northeast |
| 3 | East |
| 4 | Southeast |
| 5 | South |
| 6 | Southwest |
| 7 | West |
| 8 | Northwest |
| 9 | North-South or Northeast-Southwest combined (volume stations only) |
| 0 | East-West or Southeast-Northwest combined (volume stations only) |
8. Location of count relative to roadway orientation (Column 31) – Critical
1 = the count is taken on the side of the road for the listed direction of travel
2 = the count is taken on the opposite side of the road from the listed direction (i.e., the side with on-coming traffic, given the listed direction of travel)
3 = both sides of the road combined (appropriate for example, if you were counting a trail
4 = traffic moving perpendicular to the roadway (that is, crossing the street)
Example: if you code the Direction of Route as “North” and are in fact driving in that northbound direction, a 1 for this variable would indicate that you are counting on the right (eastern) side of the road. A “2” would indicate you are counting non-motorized traffic on the left (western) side of the road. A “3” would indicate you are counting all non-motorized traffic, regardless of which side of the road, and would be appropriate for use on a trail or other shared use path. For that same facility if Direction of Route were coded as “South” then a count performed on the eastern side of the road would be coded as a “2” as it would be on the opposite side of the road for vehicle traveling southbound.
9. Direction of Travel (Column 32) – Critical
1 = travel monitored only occurring in the Direction of Route
2 = travel monitored only occurring opposite to the Direction of Route
3 = travel in both (all) directions
4 = travel at an intersection that includes all movements (e.g., the sum of movements on all four crosswalks, or all movements occurring during a pedestrian scramble (or “Barnes Dance”) phase. Note: The “Intersection” variable should also be coded as a 1 or 2 if this variable is coded as a 4. For a “General Activity Count” that is not taken on a linear facility, and that includes all movements in all directions, code the Direction of Travel variable as a “3” all directions.
Note: To actually understand where a count is being taken (what side of the road, and which directions of travel are being counted) it is necessary to look at all three variables, Direction of Route, Location of Count Relative to Roadway Orientation, and Direction of Travel. It may also be necessary to look at the Crosswalk variable immediately below.
10. Crosswalk, sidewalk, or exclusive facility (Column 33) – Critical
Indicates if the count was taken outside of the primary right-of-way:
1 = in roadway/trail right of way (potentially shared with motorized vehicles)
2 = exclusively in a crosswalk
3 = on a sidewalk
4 = on an exclusive (for non-motorized traffic) right-of-way, parallel to the primary facility (including exclusive bike lanes, whether those lanes are separated from motorized vehicles by paint stripes or by some specific physical barrier. But not including sidewalks, crosswalks, or trails or other shared use paths that are not for licensed, motorized vehicles)
5 = on a grade separate facility designed to allow non-motorized traffic to pass over top of a roadway (e.g., a pedestrian bridge)
6 = on a grade separate facility designed to allow non-motorized traffic to cross underneath a roadway (e.g., a pedestrian undercrossing)
For an “Area Count” leave this field blank
Note 1: if “perpendicular to traffic” is selected in “Location of Count Relative to Roadway Orientation” variable and the “Crosswalk” variable is coded as “in roadway right of way” then the count includes ALL people crossing a roadway. If “exclusively in a crosswalk” is indicated, then only those in the crosswalk (or directly next to the crosswalk) are being counted. This coding differentiation is designed to indicate if all pedestrians crossing a street within a given block (including jaywalkers) are being counted, or whether only pedestrians actually using a marked crosswalk are being counted.
Note 2: if the count is being taken on a trail or shared use path that is not intended for conventional passenger cars or licensed commercial vehicles, code the trail count as a “0”, even if the trail may be routinely used by motorcycles, snowmobiles or other motorized vehicles designed for off-road uses.
11. Intersection (Column 34) – Optional
1 = count is taken at an intersection (but not an intersection with a roundabout)
2 = count taken at an intersection with a roundabout
otherwise (blank) NOT at an intersection
12. Type of Count (Column 35) – Critical
1 = pedestrians (only) are being counted
2 = bicycles (only) are being counted
3 = equestrians (only) are being counted
4 = both pedestrians and bicycles are included in this count
5 = all passing non-motorized traffic are included in this count
6 = motorized vehicles are being counted (intended for counts of snowmobiles, all terrain vehicles, and other off-road vehicles using a trail or other shared use path)
7 = all motorized and non-motorized traffic using the facility (intended for trails and share use paths that experience a combination of pedestrian, bicycle, equestrian, and off-road vehicle traffic)
8 = other animals (specify what kind of animals in Field #32 of the Non-Motorized Count Station Description Record)
13. Type of Sensor (Columns 36-37) – Optional
Code for the type of sensor used for detection:
H = Human observation (manual)
I = Infrared (passive)
2 = Active Infrared (requires a target on other side of facility being monitored)
K = Laser/lidar
L = Inductive loop
M = Magnetometer
P = Piezoelectric
Q = Quartz piezoelectric
R = Air tube
S = Sonic/acoustic
T = Tape switch
3 = other pressure sensor/mat
U = Ultrasonic
V = Video image (with automated or semi-automated conversion of images to counts)
1 = Video image with manual reduction of images to counts performed at a later time
W = Microwave (radar)
X = Radio wave (radar)
Z = Other
14.Precipitation (Column 38) (yes/no) – Optional
1 = measurable precipitation fell at some time during this record’s data collection at this location
2 = measurable precipitation did not fall at some time during this record’s data collection at this location
15. High Temperature (Columns 39-41) – Optional
Approximate high temperature for either the day (if a day or longer count), or the high temperature during the duration of the count, if the count is less than a day in duration. Expressed in Fahrenheit
16. Low Temperature (Columns 42-44) – Optional
Approximate low temperature for either the day (if a day or longer count), or the low temperature during the duration of the count, if the count is less than a day in duration. Expressed in Fahrenheit
17. Year of count (Columns 45-48) – Critical
Code the four digits of the year in which this data was collected.
18. Month of count (Columns 49-50) – Critical
Code the two digits for the month in which this data was collected
19. Day of Count (Columns 51-52) – Critical
Code the two digits for the day on which this data was collected
20.Count Start Time for this record (Columns 53-56) – Critical
Expressed in military time. The count start time must be on a five minute interval. For hourly records it is expected to be on the hour (e.g., 0900), and if a 15-minute count interval, it is expected to be on one of the 15-minute intervals (e.g., 0900, 0915, 0930, or 0945)
Note that this value will change from record to record.
21. Count Interval being reported (Columns 57-59) – Critical
Must be 05, 10, 15, 20, 30, 60, or 120.
NOTE: The remaining data items are the actual count data being submitted. They can represent 5, 10, 15, 20, 30, 60, or 120 minute time intervals, depending on how the record is coded. (See Item #21 - The first count interval is for the time period starting at “Start Time for this Record” (Item #20)).
NOTE 2: Data from different days should be submitted on different records. This allows each record to be read independently. One entire day of data can be submitted on one record, regardless of the count interval being reported. If 24 consecutive hours of data is collected on two separate days (e.g., 9 a.m. on June 1 – 8:59 a.m. on June 2) then two records are required to submit the data. If a 48 hour count, reported at 15-minute intervals, is taken starting at 9 a.m. on June 1 and ending at 8:59:59 a.m. on June 3rd, three records are needed. The first record provides data from 9:00 a.m. on June 1 through 11:59:59 p.m. on June 1. This count data is supplied in the count interval variable fields “Count Interval 1” through “Count Interval 60.” The “Start Time for this Record” variable should be recorded as “0900.” The second record provides all 24-hours of data for June 2nd. It requires the use of count interval variable fields “Count Interval 1” through “Count Interval 96.” The variable “Start Time for this Record” should be “0000.” The last record for reporting this 2 day count should also have a “Start Time for this Record” of “0000.” It will use only variables Count Interval 1 through Count Interval 36.
22. Count for interval 1 (Columns 60-64) – Critical
This contains the number of pedestrians, bicycles or other units counted in the first time interval being reported. The beginning of the time period reported is given by the variable “Start Time for this Record.” Right justify the integer being reported. Blank fill leading columns as needed. If no traffic was counted during this time period, place a zero (0) in column 64. Blank fill columns 60 through 63.
23. Count for interval 2 (Columns 65-69) – Optional
This contains the number of pedestrians, bicycles or other units counted in the second time interval being reported. Right justify the integer being reported. Blank fill leading columns as needed. If no traffic was counted during this time period, place a zero (0) in column 69. Blank fill columns 65 through 68 as necessary.
24. Count for interval 3 (Columns 70-74) – Optional
This contains the number of pedestrians, bicycles or other units counted in the third time interval being reported. Right justify the integer being reported. Blank fill leading columns as needed. If no traffic was counted during this time period, place a zero (0) in column 74. Blank fill columns 70-73 as necessary.
25-309. Count intervals 4-288 (Columns 75-79; 80-84; 85-89; …2496-2500) – Optional
These variables are used as needed for fields 25 - 309. Five columns are required for each time period reported for that day. All time periods from start to end of the count on that day should be reported. Right justify each reported count in the 5 columns allocated for that time interval. Blank fill any required leading columns. If no traffic was counted during a given time period, place a zero (0) in the right most column for that count interval. Blank fill the prior columns for that time period.
Note: It is assumed that the software reading each record can determine the end of each record and the start of the next record (which indicates either a new day of counting or a new station location.) The software should then parse the data based on the information included in the record (time interval being reported, and start time of the count).
| Column Number: |
2-3 | 4-6 | 7-12 | 13-20 | 21-29 | 30 | 31 | 32 | 33 | 34 | 35 | 36-37 | 38 | 39-41 |
| Content Example: |
08 | 045 | GLWD06 | 39550060 | 107324200 | 3 | 1 | 1 | 4 | - | 2 | H | 2 | 60a |
aThis is 60° (high temp) or 45° (low temp) Fahrenheit, not ‘minus 60° or 45°. The ‘-‘ indicates a blank prior to the number 60 (or 45).
continued
| Column Number: |
42-44 | 45-48 | 49-50 | 51-52 | 53-56 | 57-59 | 60-64 | 65-69 | 70-74 | 75-79 | 80-84 | 85-89 | 2496-2500 | |
| Content Example: |
45a | 2011 | 06 | 15 | 0800 | 060 | - - -45 | - - - 30 | - - - 25 | - - - -0 | - - - -0 | - - - - 0 | … | |

