U.S. Department of Transportation
Federal Highway Administration
1200 New Jersey Avenue, SE
Washington, DC 20590
202-366-4000
October 2019 Traffic Volume Trends
- Travel on all roads and streets changed by 1.0% (2.9 billion vehicle miles) for October 2019 as compared with October 2018. Travel for the month is estimated to be 285.1 billion vehicle miles.
- The seasonally adjusted vehicle miles traveled for October 2019 is 272.1 billion miles, a 0.8% (2.2 billion vehicle miles) increase over October 2018. It also represents -0.3% decline (-0.7 billion vehicle miles) compared with September 2019.
- Cumulative Travel for 2019 changed by 1.0% (27.0 billion vehicle miles). The cumulative estimate for the year is 2,722.1 billion vehicle miles of travel.
38.6
0.8%
62.2
1.1%
63.9
0.7%
56.1
0.8%
64.2
1.6%
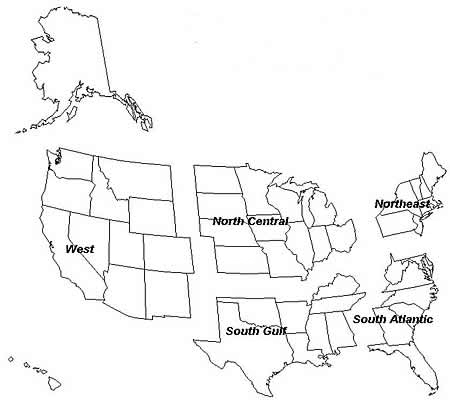
- Estimated Vehicle-Miles of Travel by Region - October 2019 - (in Billions)
- Change in Traffic as compared to same month last year.
| Region |
Total Travel |
Percentage Change |
| North-East |
38.6 |
0.8 |
| South-Atlantic |
62.2 |
1.1 |
| North-Central |
63.9 |
0.7 |
| South-Gulf |
56.1 |
0.8 |
| West |
64.2 |
1.6 |
Note:
- All data for this month are preliminary. Revised values for the previous month are shown in Tables 1 and 2.
- All vehicle-miles of travel computed with Highway Statistics 2016 Table VM-2 as a base.
- Compiled with data on hand as of December 12, 2019.
- Some historical data were revised based on HPMS and amended TVT data as of December 2016.
- For information on total licensed drivers in the U.S. visit https://www.fhwa.dot.gov/policy/ohpi/hss/hsspubs.htm. Select the year of interest then Section III (Driver Licensing).
- For information on total registered motor vehicles in the U.S., visit https://www.fhwa.dot.gov/policy/ohpi/hss/hsspubs.htm. Select the year of interest and Section II (Motor Vehicles).
- Seasonally adjusted vehicle miles traveled removes seasonal changes allowing month-to-month, year-to-year trend comparisons.
- Travel Trends (October 2019)
- Individual Monthly Motor Vehicle Travel in the U.S. for October 2019
- Changes on Rural Arterial Roads by Region and State
- Changes on Urban Arterial Roads by Region and State
- Changes on All Estimated Roads by Region and State
- Volume Trends - Rural
- Volume Trends - Urban
- Figure 1 - Moving 12-Month Total on All Highways
- Figure 2 - Travel on U.S. Highways By Month
- Figure 3 - Seasonally Adjusted Vehicle Miles Traveled
Return to top
Page last modified on December 17, 2019

